• Cat-intel
  • MedIntelliX
  • Resources
  • About Us
  • Hero Background
    English
    Chinese
    French
    Japanese
    Korean
    German
    Spanish

    Silane Coupling Agents Market Analysis

    ID: MRFR/CnM/6174-HCR
    140 Pages
    Chitranshi Jaiswal
    October 2025

    Silane Coupling Agents Market Research Report Information by Product (Aminosilane, Epoxysilane, Acryloxy, Vinylsilane), End-use Industries (Chemicals, Electrical, Automotive, Energy, Construction), Region (North America, Europe, Latin America) - Forecast till 2035

    Share:
    Download PDF ×

    We do not share your information with anyone. However, we may send you emails based on your report interest from time to time. You may contact us at any time to opt-out.

    Silane Coupling Agents Market Infographic
    $ 4,950.0
    $ 5,950.0
    $ 7,250.0

    Market Analysis

    In-depth Analysis of Silane Coupling Agents Market Industry Landscape

    The Silane Coupling Agents market is characterized by a set of dynamic factors that collectively shape its overall dynamics. One of the primary drivers influencing this market is the growing demand from the construction and automotive industries. Silane coupling agents play a crucial role in enhancing adhesion between dissimilar materials, providing durability and structural integrity to composite materials used in these sectors. As these industries continue to expand globally, the need for high-performance materials with superior bonding properties fuels the demand for silane coupling agents, driving market growth.

    Moreover, the increasing focus on sustainable and eco-friendly products contributes to the market dynamics of silane coupling agents. These agents enable the development of environmentally friendly materials by improving the compatibility between organic and inorganic components. As environmental regulations become more stringent, industries are seeking solutions that reduce the environmental impact of their products. Silane coupling agents address this demand by facilitating the production of greener materials, making them a key component in the market's response to sustainability requirements.

    The constant evolution of material science and technology is another crucial factor shaping the dynamics of the Silane Coupling Agents market. Ongoing research and development efforts focus on enhancing the performance characteristics of these agents, such as improving their compatibility with various polymers and optimizing their reactivity. These advancements contribute to the versatility of silane coupling agents, expanding their applicability across a wide range of industries. The ability of these agents to adapt to evolving manufacturing processes and materials positions them as indispensable components in modern material development.

    Global economic conditions significantly impact the Silane Coupling Agents market dynamics. Economic growth, industrialization, and infrastructure development drive the demand for advanced materials, subsequently influencing the consumption of silane coupling agents. Additionally, economic downturns may temporarily affect market growth as industries reassess their priorities and investments. However, the fundamental role of silane coupling agents in enhancing material performance ensures a resilient demand even during economic fluctuations.

    Trade policies and regulations also play a pivotal role in the market dynamics of Silane Coupling Agents. Compliance with international standards and regulations is crucial for manufacturers and suppliers to gain market access. Changes in trade policies, tariffs, or environmental regulations can affect the cost structure and supply chain of silane coupling agents, influencing market dynamics. Manufacturers need to stay abreast of these regulatory developments to navigate the global market effectively.

    Technological advancements in end-use industries, such as the development of advanced composites and nanotechnology, impact the Silane Coupling Agents market. The demand for lightweight and high-strength materials in aerospace, electronics, and other industries drives the exploration of new materials and manufacturing processes. Silane coupling agents contribute to these innovations by improving the bonding and performance characteristics of composite materials, aligning with the broader technological trends shaping various industries.

    Competitive dynamics within the Silane Coupling Agents market are influenced by factors such as product differentiation, pricing strategies, and mergers and acquisitions. Companies seek to differentiate their products through proprietary formulations, superior performance, and cost-effectiveness. Pricing strategies are crucial, balancing the need for competitiveness with maintaining profitability. Mergers and acquisitions contribute to market consolidation, enabling companies to expand their product portfolios and strengthen their market presence.

    In conclusion, the Silane Coupling Agents market is shaped by a combination of factors ranging from industry-specific demands and technological advancements to economic conditions and regulatory landscapes. As industries continue to seek high-performance and environmentally friendly materials, the demand for silane coupling agents is expected to remain robust. The market's dynamics will continue to evolve in response to these multifaceted influences, requiring industry players to stay agile and innovative to capitalize on emerging opportunities and navigate challenges effectively.

    Market Summary

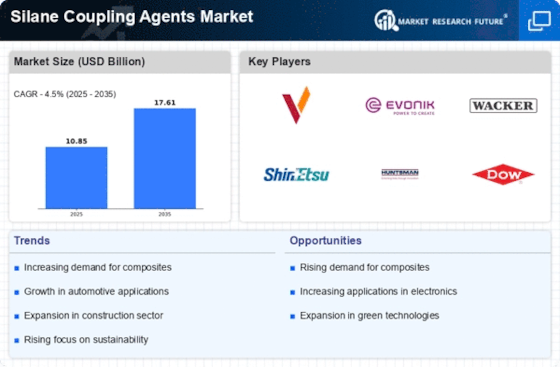
    As per Market Research Future Analysis, the Silane Coupling Agents Market was valued at USD 10.85 Billion in 2024 and is projected to grow to USD 17.61 Billion by 2035, with a CAGR of 4.50% from 2025 to 2035. These agents serve as intermediaries that bond organic and inorganic materials, enhancing properties such as heat resistance, weatherability, and water resistance. They are crucial in thermosetting resin-based fiber reinforced materials and surface treatments for glass fiber products. The increasing demand in the chemical industry for bonding organic materials is expected to drive market growth.

    Key Market Trends & Highlights

    The Silane Coupling Agents Market is witnessing significant growth driven by various factors.

    • Market Size in 2024: USD 10.85 Billion
    • Projected Market Size by 2035: USD 17.61 Billion
    • CAGR from 2025 to 2035: 4.50%
    • Key applications include adhesives & sealants and paints & coatings in automotive and construction industries.

    Market Size & Forecast

    2024 Market Size USD 10.85 Billion
    2035 Market Size USD 17.61 Billion
    CAGR (2024-2035) 4.50%
    2024 Projected Market Size USD 10.85 Billion
    2032 Projected Market Size USD 15.62 Billion

    Major Players

    Prominent companies include Evonik Industries, China National Bluestar, Nanjing Union Silicon Chemical Co. Ltd., Gelest Inc., Wacker Chemie AG, DowDuPont, Momentive Performance Materials Holdings LLC, Shin-Etsu Chemical Co. Ltd., Hexpol Compounding, 3M, Rayton Chemicals, Advanced Polymer Inc, and Tianjin Shengbin Chemical Engineering.

    Market Trends

    The increasing demand for high-performance materials across various industries is driving the growth of the silane coupling agents market, as these agents enhance adhesion and improve the durability of composite materials.

    U.S. Department of Commerce

    Silane Coupling Agents Market Market Drivers

    Rising Demand in Automotive Sector

    The Global Silane Coupling Agents Market Industry experiences a notable surge in demand driven by the automotive sector. As manufacturers increasingly seek to enhance the performance and durability of composite materials, silane coupling agents play a critical role in improving adhesion between different substrates. This trend is particularly evident as the automotive industry aims to reduce vehicle weight and improve fuel efficiency. The market is projected to reach 10.8 USD Billion in 2024, reflecting the growing reliance on advanced materials. The integration of silane coupling agents in automotive applications not only boosts performance but also aligns with sustainability goals, thereby fostering market growth.

    Market Trends and Growth Projections

    Expansion in Construction Applications

    The Global Silane Coupling Agents Market Industry is significantly influenced by the expansion of construction applications. Silane coupling agents are increasingly utilized in the production of construction materials, such as concrete and adhesives, to enhance their mechanical properties and resistance to environmental factors. As urbanization accelerates globally, the demand for durable and high-performance construction materials rises. This trend is expected to contribute to the market's growth, with projections indicating a market value of 17.8 USD Billion by 2035. The incorporation of silane coupling agents in construction applications not only improves material longevity but also supports the development of sustainable building practices.

    Technological Advancements in Material Science

    Technological advancements in material science are reshaping the Global Silane Coupling Agents Market Industry. Innovations in silane chemistry and formulations enable the development of more efficient coupling agents that enhance the performance of various materials. These advancements facilitate the production of composites with superior mechanical properties, making them suitable for a wider range of applications, including electronics and coatings. The anticipated compound annual growth rate (CAGR) of 4.62% from 2025 to 2035 underscores the potential for growth driven by these technological innovations. As industries continue to adopt advanced materials, the demand for silane coupling agents is likely to increase, further propelling market expansion.

    Increased Investment in Research and Development

    Increased investment in research and development (R&D) is a pivotal driver for the Global Silane Coupling Agents Market Industry. Companies are allocating resources to innovate and improve silane formulations, aiming to enhance their effectiveness across various applications. This focus on R&D not only leads to the development of new products but also improves existing ones, thereby expanding their applicability in diverse sectors. As industries recognize the value of high-performance materials, the demand for advanced silane coupling agents is expected to grow. This trend indicates a commitment to quality and performance, which is likely to sustain market growth in the coming years.

    Growing Awareness of Environmental Sustainability

    The Global Silane Coupling Agents Market Industry is increasingly shaped by growing awareness of environmental sustainability. Industries are progressively seeking eco-friendly alternatives to traditional materials, prompting the adoption of silane coupling agents that enhance the performance of sustainable composites. This shift is particularly relevant in sectors such as construction and automotive, where the emphasis on reducing carbon footprints is paramount. The market's trajectory suggests that as sustainability becomes a core focus for manufacturers, the demand for silane coupling agents will likely rise. This trend aligns with global efforts to promote environmentally responsible practices, thereby fostering a more sustainable future.

    Market Segment Insights

    Regional Insights

    Key Companies in the Silane Coupling Agents Market market include

    Industry Developments

    Future Outlook

    Silane Coupling Agents Market Future Outlook

    The Global Silane Coupling Agents Market is projected to grow at a 4.50% CAGR from 2025 to 2035, driven by increasing demand in automotive and construction sectors.

    New opportunities lie in:

    • Develop eco-friendly silane formulations to meet sustainability regulations.
    • Expand into emerging markets with tailored product offerings.
    • Leverage advanced manufacturing technologies to enhance production efficiency.

    By 2035, the market is expected to achieve robust growth, solidifying its position as a key player in material science.

    Market Segmentation

    Market Segmentation

    Intended Audience
    • Silane Coupling Agent Manufacturers
    • Traders and Distributors of Silane Coupling Agent
    • Research and Development Institutes
    • Potential Investors
    • Raw Material Suppliers
    • Nationalized Laboratories

    Report Scope

    Report Attribute/Metric Details
    Market Size 2024 USD 10.85 Billion
    Market Size 2035 17.61 (Value (USD Billion))
    Compound Annual Growth Rate (CAGR) 4.50% (2025 - 2035)
    Base Year 2024
    Market Forecast Period 2025 - 2035
    Historical Data 2018 - 2021
    Market Forecast Units Value (USD Billion)
    Report Coverage Revenue Forecast, Market Competitive Landscape, Growth Factors, and Trends
    Segments Covered By Product, End-Use Industry and Region
    Geographies Covered North America, Europe, Asia Pacific, and Rest of the World
    Countries Covered The U.S, Canada, Germany, France, UK, Italy, Spain, China, Japan, India, Australia, South Korea, and Brazil
    Key Companies Profiled Evonik Industries (Germany), China National Bluestar (China), Nanjing Union Silicon Chemical Co. Ltd. (China), Gelest Inc. (US), Wacker Chemie AG (Germany), DowDuPont (US), Momentive Performance Materials Holdings LLC (US), Shin-Etsu Chemical Co. Ltd. (Japan), Hexpol Compounding (Belgium), 3M (US), Rayton Chemicals (US), Advanced Polymer Inc (US) and Tianjin Shengbin Chemical Engineering (China).
    Key Market Opportunities Rise in chemical industry is expected to propel silane coupling agents demand.
    Key Market Dynamics Increasing application of silane coupling agents in chemical industry for bonding organic materials
    Market Size 2025 11.34 (Value (USD Billion))

    Market Highlights

    Author

    Chitranshi Jaiswal
    Research Analyst Level I

    She holds an experience of about 6+ years in market research and business consulting, working under the spectrum of information communication technology, telecommunications and semiconductor domains. aarti conceptualizes and implements a scalable business strategy and provides strategic leadership to the clients. her expertise lies in market estimation, competitive intelligence, pipeline analysis, customer assessment, etc.

    Leave a Comment

    Latest Comments

    John Doe
    john@example.com

    This is a great article! Really helped me understand the topic better.

    Posted on July 23, 2025, 10:15 AM
    Jane Smith
    jane@domain.com

    Thanks for sharing this. I’ve bookmarked it for later reference.

    Posted on July 22, 2025, 7:45 PM

    FAQs

    What was the value of the global silane coupling agents market in 2018?

    Silane Coupling Agents Market size was valued at USD 10.85 Billion in 2024

    At what CAGR is the global silane coupling agents market projected to grow in the forecast period?

    Silane Coupling Agents Market is projected to grow at a CAGR of 4.5% during the forecast period, 2025-2035

    Which are the major segments in the global silane coupling agents market?

    By product, the epoxy silane segment and by applications the paints & coatings segment account for major share in the global silane coupling agents market.

    Which region holds the largest share in the global silane coupling agents market?

    Asia Pacific holds the largest share in the global silane coupling agents market, followed by North America and Europe, respectively.

    Who are the top players in the global silane coupling agents market?

    China National Bluestar (China), Evonik Industries (Germany), Nanjing Union Silicon Chemical Co. Ltd. (China), Wacker Chemie AG (Germany), Gelest Inc. (US), DowDuPont (US), Shin-Etsu Chemical Co. Ltd. (Japan), Momentive Performance Materials Holdings LLC (US), Hexpol Compounding (Belgium), Rayton Chemicals (US), 3M (US), Tianjin Shengbin Chemical Engineering (China), and Advanced Polymer Inc. (US), are some of the major players operating in the silane coupling agents market.

    1. . Global Silane Coupling Agents Market, by Product
      1. Introduction
      2. Vinyl silane
      3. Market Estimates & Forecast, 2020–2027
      4. Market Estimates & Forecast, by Region, 2020–2027
      5. Sulfur Silane
      6. Market Estimates & Forecast, 2020–2027
      7. Market Estimates & Forecast, by Region, 2020–2027
      8. Epoxy silane
    2. Introduction
    3. Vinyl silane
    4. Market Estimates & Forecast, 2020–2027
    5. Market Estimates & Forecast, by Region, 2020–2027
    6. Sulfur Silane
    7. Market Estimates & Forecast, 2020–2027
    8. Market Estimates & Forecast, by Region, 2020–2027
    9. Epoxy silane
    10. . Market Estimates & Forecast, 2020–2027
    11. . Market Estimates & Forecast, 2020–2027
      1. Amino silane
    12. Amino silane
    13. . Market Estimates & Forecast, 2020–2027
    14. . Market Estimates & Forecast, 2020–2027
      1. Others
    15. Others
    16. . Market Estimates & Forecast, 2020–2027
    17. . Market Estimates & Forecast, 2020–2027
    18. . Global Silane Coupling Agents Market, by Application
      1. Introduction
      2. Plastics
      3. Market Estimates & Forecast, 2020–2027
      4. Market Estimates & Forecast, by Region, 2020–2027
      5. Fiber Treatment
      6. Market Estimates & Forecast, 2020–2027
      7. Market Estimates & Forecast, by Region, 2020–2027
      8. Adhesives & Sealants
      9. Market Estimates & Forecast, 2020–2027
      10. Market Estimates & Forecast, by Region, 2020–2027
      11. Paints & Coatings
      12. Market Estimates & Forecast, 2020–2027
      13. Market Estimates & Forecast, by Region, 2020–2027
      14. Others
      15. Market Estimates & Forecast, 2020–2027
      16. Market Estimates & Forecast, by Region, 2020–2027
    19. Introduction
    20. Plastics
    21. Market Estimates & Forecast, 2020–2027
    22. Market Estimates & Forecast, by Region, 2020–2027
    23. Fiber Treatment
    24. Market Estimates & Forecast, 2020–2027
    25. Market Estimates & Forecast, by Region, 2020–2027
    26. Adhesives & Sealants
    27. Market Estimates & Forecast, 2020–2027
    28. Market Estimates & Forecast, by Region, 2020–2027
    29. Paints & Coatings
    30. Market Estimates & Forecast, 2020–2027
    31. Market Estimates & Forecast, by Region, 2020–2027
    32. Others
    33. Market Estimates & Forecast, 2020–2027
    34. Market Estimates & Forecast, by Region, 2020–2027
    35. . Global Silane Coupling Agents Market, by Region
      1. Introduction
      2. North America
      3. Market Estimates & Forecast, 2020–2027
      4. Market Estimates & Forecast by Product, 2020–2027
      5. Market Estimates & Forecast by Application, 2020–2027
      6. US
      7. Market Estimates & Forecast, 2020–2027
      8. Market Estimates & Forecast by Product, 2020–2027
      9. Market Estimates & Forecast by Application, 2020–2027
      10. Canada
      11. Market Estimates & Forecast, 2020–2027
      12. Market Estimates & Forecast by Product, 2020–2027
      13. Market Estimates & Forecast by Application, 2020–2027
      14. Europe
      15. Market Estimates & Forecast, 2020–2027
      16. Market Estimates & Forecast by Product, 2020–2027
      17. Market Estimates & Forecast by Application, 2020–2027
      18. Germany
      19. Market Estimates & Forecast, 2020–2027
      20. Market Estimates & Forecast by Product, 2020–2027
      21. Market Estimates & Forecast by Application, 2020–2027
    36. Introduction
    37. North America
    38. Market Estimates & Forecast, 2020–2027
    39. Market Estimates & Forecast by Product, 2020–2027
    40. Market Estimates & Forecast by Application, 2020–2027
    41. US
    42. Market Estimates & Forecast, 2020–2027
    43. Market Estimates & Forecast by Product, 2020–2027
    44. Market Estimates & Forecast by Application, 2020–2027
    45. Canada
    46. Market Estimates & Forecast, 2020–2027
    47. Market Estimates & Forecast by Product, 2020–2027
    48. Market Estimates & Forecast by Application, 2020–2027
    49. Europe
    50. Market Estimates & Forecast, 2020–2027
    51. Market Estimates & Forecast by Product, 2020–2027
    52. Market Estimates & Forecast by Application, 2020–2027
    53. Germany
    54. Market Estimates & Forecast, 2020–2027
    55. Market Estimates & Forecast by Product, 2020–2027
    56. Market Estimates & Forecast by Application, 2020–2027
    57. . France
      1. Market Estimates & Forecast, 2020–2027
      2. Market Estimates & Forecast by Product, 2020–2027
      3. Market Estimates & Forecast by Application, 2020–2027
      4. Italy
      5. Market Estimates & Forecast, 2020–2027
      6. Market Estimates & Forecast by Product, 2020–2027
      7. Market Estimates & Forecast by Application, 2020–2027
      8. Spain
      9. Market Estimates & Forecast, 2020–2027
      10. Market Estimates & Forecast by Product, 2020–2027
      11. Market Estimates & Forecast by Application, 2020–2027
      12. UK
      13. Market Estimates & Forecast, 2020–2027
      14. Market Estimates & Forecast by Product, 2020–2027
      15. Market Estimates & Forecast by Application, 2020–2027
      16. Russia
      17. Market Estimates & Forecast, 2020–2027
      18. Market Estimates & Forecast by Product, 2020–2027
      19. Market Estimates & Forecast by Application, 2020–2027
      20. Netherlands
      21. Market Estimates & Forecast, 2020–2027
      22. Market Estimates & Forecast by Product, 2020–2027
      23. Market Estimates & Forecast by Application, 2020–2027
      24. Rest of Europe
      25. Market Estimates & Forecast, 2020–2027
      26. Market Estimates & Forecast by Product, 2020–2027
      27. Market Estimates & Forecast by Application, 2020–2027
      28. Asia Pacific
      29. Market Estimates & Forecast, 2020–2027
      30. Market Estimates & Forecast by Product, 2020–2027
      31. Market Estimates & Forecast by Application, 2020–2027
      32. China
      33. Market Estimates & Forecast, 2020–2027
      34. Market Estimates & Forecast by Product, 2020–2027
      35. Market Estimates & Forecast by Application, 2020–2027
      36. India
      37. Market Estimates & Forecast, 2020–2027
      38. Market Estimates & Forecast by Product, 2020–2027
      39. Market Estimates & Forecast by Application, 2020–2027
      40. Japan
      41. Market Estimates & Forecast, 2020–2027
      42. Market Estimates & Forecast by Product, 2020–2027
      43. Market Estimates & Forecast by Application, 2020–2027
      44. Australia
      45. Market Estimates & Forecast, 2020–2027
      46. Market Estimates & Forecast by Product, 2020–2027
      47. Market Estimates & Forecast by Application, 2020–2027
      48. Malaysia
      49. Market Estimates & Forecast, 2020–2027
      50. Market Estimates & Forecast by Product, 2020–2027
      51. Market Estimates & Forecast by Application, 2020–2027
      52. South Korea
      53. Market Estimates & Forecast, 2020–2027
      54. Market Estimates & Forecast by Product, 2020–2027
      55. Market Estimates & Forecast by Application, 2020–2027
      56. Rest of Asia Pacific
      57. Market Estimates & Forecast, 2020–2027
      58. Market Estimates & Forecast by Product, 2020–2027
      59. Market Estimates & Forecast by Application, 2020–2027
      60. Middle East & Africa
      61. Market Estimates & Forecast, 2020–2027
      62. Market Estimates & Forecast by Product, 2020–2027
      63. Market Estimates & Forecast by Application, 2020–2027
      64. Saudi Arabia
      65. Market Estimates & Forecast, 2020–2027
      66. Market Estimates & Forecast by Product, 2020–2027
      67. Market Estimates & Forecast by Application, 2020–2027
      68. UAE
      69. Market Estimates & Forecast, 2020–2027
      70. Market Estimates & Forecast by Product, 2020–2027
      71. Market Estimates & Forecast by Application, 2020–2027
      72. Africa
      73. Market Estimates & Forecast, 2020–2027
      74. Market Estimates & Forecast by Product, 2020–2027
      75. Market Estimates & Forecast by Application, 2020–2027
      76. Rest of the Middle East & Africa
      77. Market Estimates & Forecast, 2020–2027
      78. Market Estimates & Forecast by Product, 2020–2027
      79. Market Estimates & Forecast by Application, 2020–2027
      80. Latin America
      81. Market Estimates & Forecast, 2020–2027
      82. Market Estimates & Forecast by Product, 2020–2027
      83. Market Estimates & Forecast by Application, 2020–2027
      84. Brazil
      85. Market Estimates & Forecast, 2020–2027
      86. Market Estimates & Forecast by Product, 2020–2027
      87. Market Estimates & Forecast by Application, 2020–2027
      88. Argentina
      89. Market Estimates & Forecast, 2020–2027
      90. Market Estimates & Forecast by Product, 2020–2027
      91. Market Estimates & Forecast by Application, 2020–2027
      92. Mexico
      93. Market Estimates & Forecast, 2020–2027
      94. Market Estimates & Forecast by Product, 2020–2027
      95. Market Estimates & Forecast by Application, 2020–2027
      96. Rest of Latin America
      97. Market Estimates & Forecast, 2020–2027
      98. Market Estimates & Forecast by Product, 2020–2027
      99. Market Estimates & Forecast by Application, 2020–2027
    58. Market Estimates & Forecast, 2020–2027
    59. Market Estimates & Forecast by Product, 2020–2027
    60. Market Estimates & Forecast by Application, 2020–2027
    61. Italy
    62. Market Estimates & Forecast, 2020–2027
    63. Market Estimates & Forecast by Product, 2020–2027
    64. Market Estimates & Forecast by Application, 2020–2027
    65. Spain
    66. Market Estimates & Forecast, 2020–2027
    67. Market Estimates & Forecast by Product, 2020–2027
    68. Market Estimates & Forecast by Application, 2020–2027
    69. UK
    70. Market Estimates & Forecast, 2020–2027
    71. Market Estimates & Forecast by Product, 2020–2027
    72. Market Estimates & Forecast by Application, 2020–2027
    73. Russia
    74. Market Estimates & Forecast, 2020–2027
    75. Market Estimates & Forecast by Product, 2020–2027
    76. Market Estimates & Forecast by Application, 2020–2027
    77. Netherlands
    78. Market Estimates & Forecast, 2020–2027
    79. Market Estimates & Forecast by Product, 2020–2027
    80. Market Estimates & Forecast by Application, 2020–2027
    81. Rest of Europe
    82. Market Estimates & Forecast, 2020–2027
    83. Market Estimates & Forecast by Product, 2020–2027
    84. Market Estimates & Forecast by Application, 2020–2027
    85. Asia Pacific
    86. Market Estimates & Forecast, 2020–2027
    87. Market Estimates & Forecast by Product, 2020–2027
    88. Market Estimates & Forecast by Application, 2020–2027
    89. China
    90. Market Estimates & Forecast, 2020–2027
    91. Market Estimates & Forecast by Product, 2020–2027
    92. Market Estimates & Forecast by Application, 2020–2027
    93. India
    94. Market Estimates & Forecast, 2020–2027
    95. Market Estimates & Forecast by Product, 2020–2027
    96. Market Estimates & Forecast by Application, 2020–2027
    97. Japan
    98. Market Estimates & Forecast, 2020–2027
    99. Market Estimates & Forecast by Product, 2020–2027
    100. Market Estimates & Forecast by Application, 2020–2027
    101. Australia
    102. Market Estimates & Forecast, 2020–2027
    103. Market Estimates & Forecast by Product, 2020–2027
    104. Market Estimates & Forecast by Application, 2020–2027
    105. Malaysia
    106. Market Estimates & Forecast, 2020–2027
    107. Market Estimates & Forecast by Product, 2020–2027
    108. Market Estimates & Forecast by Application, 2020–2027
    109. South Korea
    110. Market Estimates & Forecast, 2020–2027
    111. Market Estimates & Forecast by Product, 2020–2027
    112. Market Estimates & Forecast by Application, 2020–2027
    113. Rest of Asia Pacific
    114. Market Estimates & Forecast, 2020–2027
    115. Market Estimates & Forecast by Product, 2020–2027
    116. Market Estimates & Forecast by Application, 2020–2027
    117. Middle East & Africa
    118. Market Estimates & Forecast, 2020–2027
    119. Market Estimates & Forecast by Product, 2020–2027
    120. Market Estimates & Forecast by Application, 2020–2027
    121. Saudi Arabia
    122. Market Estimates & Forecast, 2020–2027
    123. Market Estimates & Forecast by Product, 2020–2027
    124. Market Estimates & Forecast by Application, 2020–2027
    125. UAE
    126. Market Estimates & Forecast, 2020–2027
    127. Market Estimates & Forecast by Product, 2020–2027
    128. Market Estimates & Forecast by Application, 2020–2027
    129. Africa
    130. Market Estimates & Forecast, 2020–2027
    131. Market Estimates & Forecast by Product, 2020–2027
    132. Market Estimates & Forecast by Application, 2020–2027
    133. Rest of the Middle East & Africa
    134. Market Estimates & Forecast, 2020–2027
    135. Market Estimates & Forecast by Product, 2020–2027
    136. Market Estimates & Forecast by Application, 2020–2027
    137. Latin America
    138. Market Estimates & Forecast, 2020–2027
    139. Market Estimates & Forecast by Product, 2020–2027
    140. Market Estimates & Forecast by Application, 2020–2027
    141. Brazil
    142. Market Estimates & Forecast, 2020–2027
    143. Market Estimates & Forecast by Product, 2020–2027
    144. Market Estimates & Forecast by Application, 2020–2027
    145. Argentina
    146. Market Estimates & Forecast, 2020–2027
    147. Market Estimates & Forecast by Product, 2020–2027
    148. Market Estimates & Forecast by Application, 2020–2027
    149. Mexico
    150. Market Estimates & Forecast, 2020–2027
    151. Market Estimates & Forecast by Product, 2020–2027
    152. Market Estimates & Forecast by Application, 2020–2027
    153. Rest of Latin America
    154. Market Estimates & Forecast, 2020–2027
    155. Market Estimates & Forecast by Product, 2020–2027
    156. Market Estimates & Forecast by Application, 2020–2027
    157. . Competitive Landscape
      1. Introduction
      2. Market Key Strategies
      3. Key Development Analysis (Expansions/Mergers & Acquisitions/Joint Ventures/New Product Developments/Agreements/Investments)
    158. Introduction
    159. Market Key Strategies
    160. Key Development Analysis (Expansions/Mergers & Acquisitions/Joint Ventures/New Product Developments/Agreements/Investments)
    161. . Company Profiles
      1. Evonik Industries
      2. Company Overview
      3. Financial Updates
      4. Product/Business Segment Overview
      5. Key Developments
      6. SWOT Analysis
      7. Key Strategies
      8. China National Bluestar
      9. Company Overview
      10. Financial Updates
      11. Product/Business Segment Overview
      12. Key Developments
      13. SWOT Analysis
      14. Key Strategies
      15. Nanjing Union Silicon Chemical Co. Ltd.
      16. Company Overview
      17. Financial Updates
      18. Product/Business Segment Overview
      19. Key Developments
      20. SWOT Analysis
      21. Key Strategies
      22. Gelest Inc.
      23. Company Overview
      24. Financial Updates
      25. Product/Business Segment Overview
      26. Key Developments
      27. SWOT Analysis
      28. Key Strategies
      29. Wacker Chemie AG
      30. Company Overview
      31. Financial Updates
      32. Product/Business Segment Overview
      33. Key Developments
      34. SWOT Analysis
      35. Key Strategies
      36. DowDuPont
      37. Company Overview
      38. Financial Updates
      39. Product/Business Segment Overview
      40. Key Developments
      41. SWOT Analysis
      42. Key Strategies
      43. Momentive Performance Materials Holdings LLC
      44. Company Overview
      45. Financial Updates
      46. Product/Business Segment Overview
      47. Key Developments
      48. SWOT Analysis
      49. Key Strategies
      50. Shin-Etsu Chemical Co. Ltd.
      51. Company Overview
      52. Financial Updates
      53. Product/Business Segment Overview
      54. Key Developments
      55. SWOT Analysis
      56. Key Strategies
      57. Hexpol Compounding
      58. Company Overview
      59. Financial Updates
      60. Product/Business Segment Overview
      61. Key Developments
      62. SWOT Analysis
      63. Key Strategies
      64. 3M
      65. Company Overview
      66. Financial Updates
      67. Product/Business Segment Overview
      68. Key Developments
      69. SWOT Analysis
      70. Key Strategies
      71. Advanced Polymer Inc
      72. Company Overview
      73. Financial Updates
      74. Product/Business Segment Overview
      75. Key Developments
      76. SWOT Analysis
      77. Key Strategies
      78. Tianjin Shengbin Chemical Engineering
      79. Company Overview
      80. Financial Updates
      81. Product/Business Segment Overview
      82. Key Developments
      83. SWOT Analysis
      84. Key Strategies
      85. Rayton Chemicals
      86. Company Overview
      87. Financial Updates
      88. Product/Business Segment Overview
      89. Key Developments
      90. SWOT Analysis
      91. Key Strategies
    162. Evonik Industries
    163. Company Overview
    164. Financial Updates
    165. Product/Business Segment Overview
    166. Key Developments
    167. SWOT Analysis
    168. Key Strategies
    169. China National Bluestar
    170. Company Overview
    171. Financial Updates
    172. Product/Business Segment Overview
    173. Key Developments
    174. SWOT Analysis
    175. Key Strategies
    176. Nanjing Union Silicon Chemical Co. Ltd.
    177. Company Overview
    178. Financial Updates
    179. Product/Business Segment Overview
    180. Key Developments
    181. SWOT Analysis
    182. Key Strategies
    183. Gelest Inc.
    184. Company Overview
    185. Financial Updates
    186. Product/Business Segment Overview
    187. Key Developments
    188. SWOT Analysis
    189. Key Strategies
    190. Wacker Chemie AG
    191. Company Overview
    192. Financial Updates
    193. Product/Business Segment Overview
    194. Key Developments
    195. SWOT Analysis
    196. Key Strategies
    197. DowDuPont
    198. Company Overview
    199. Financial Updates
    200. Product/Business Segment Overview
    201. Key Developments
    202. SWOT Analysis
    203. Key Strategies
    204. Momentive Performance Materials Holdings LLC
    205. Company Overview
    206. Financial Updates
    207. Product/Business Segment Overview
    208. Key Developments
    209. SWOT Analysis
    210. Key Strategies
    211. Shin-Etsu Chemical Co. Ltd.
    212. Company Overview
    213. Financial Updates
    214. Product/Business Segment Overview
    215. Key Developments
    216. SWOT Analysis
    217. Key Strategies
    218. Hexpol Compounding
    219. Company Overview
    220. Financial Updates
    221. Product/Business Segment Overview
    222. Key Developments
    223. SWOT Analysis
    224. Key Strategies
    225. 3M
    226. Company Overview
    227. Financial Updates
    228. Product/Business Segment Overview
    229. Key Developments
    230. SWOT Analysis
    231. Key Strategies
    232. Advanced Polymer Inc
    233. Company Overview
    234. Financial Updates
    235. Product/Business Segment Overview
    236. Key Developments
    237. SWOT Analysis
    238. Key Strategies
    239. Tianjin Shengbin Chemical Engineering
    240. Company Overview
    241. Financial Updates
    242. Product/Business Segment Overview
    243. Key Developments
    244. SWOT Analysis
    245. Key Strategies
    246. Rayton Chemicals
    247. Company Overview
    248. Financial Updates
    249. Product/Business Segment Overview
    250. Key Developments
    251. SWOT Analysis
    252. Key Strategies
    253. . Conclusion LIST OF TABLES: Table 1 Global Silane Coupling Agents Market, by Region, 2020–2027 Table 2 North America: Silane Coupling Agents Market, by Country, 2020–2027 Table 3 Europe: Silane Coupling Agents Market, by Country, 2020–2027 Table 4 Asia-Pacific: Silane Coupling Agents Market, by Country, 2020–2027 Table 5 Middle East & Africa: Silane Coupling Agents Market, by Country, 2020–2027 Table 6 Latin America: Silane Coupling Agents Market, by Country, 2020–2027 Table 7 Silane Coupling Agents Product Market, by Region, 2020–2027 Table 8 North America: Silane Coupling Agents Product Market, by Country, 2020–2027 Table 9 Europe: Silane Coupling Agents Product Market, by Country, 2020–2027 Table 10 Asia-Pacific: Silane Coupling Agents Product Market, by Country, 2020–2027 Table 11 Middle East & Africa: Silane Coupling Agents Product Market, by Country, 2020–2027 Table 12 Latin America: Silane Coupling Agents Product Market, by Country, 2020–2027 Table 11 Silane Coupling Agents Application Market, by Region, 2020–2027 Table 14 North America: Silane Coupling Agents Application Market, by Country, 2020–2027 Table 15 Europe: Silane Coupling Agents Application Market, by Country, 2020–2027 Table 16 Asia-Pacific: Silane Coupling Agents Application Market, by Country, 2020–2027 Table 17 Middle East & Africa: Silane Coupling Agents Application Market, by Country, 2020–2027 Table 18 Latin America: Silane Coupling Agents Application Market, by Country, 2020–2027 Table 19 Global Product Market, by Region, 2020–2027 Table 20 Global Application Market, by Region, 2020–2027 Table 21 North America: Silane Coupling Agents Market, by Country, 2020–2027 Table 22 North America: Silane Coupling Agents Market, by Product, 2020–2027 Table 23 North America: Silane Coupling Agents Market, by Application, 2020–2027 Table 24 Europe Silane Coupling Agents Market, by Country, 2020–2027 Table 25 Europe Silane Coupling Agents Market, by Product, 2020–2027 Table 26 Europe Silane Coupling Agents Market, by Application, 2020–2027 Table 27 Asia-Pacific Silane Coupling Agents Market, by Country, 2020–2027 Table 28 Asia-Pacific Silane Coupling Agents Market, by Product, 2020–2027 Table 29 Asia-Pacific Silane Coupling Agents Market, by Application, 2020–2027 Table 30 Middle East & Africa: Silane Coupling Agents Market, by Country, 2020–2027 Table 31 Middle East & Africa: Silane Coupling Agents Market, by Product, 2020–2027 Table 32 Middle East & Africa: Silane Coupling Agents Market, by Application, 2020–2027 Table 33 Latin America: Silane Coupling Agents Market, by Country, 2020–2027 Table 34 Latin America: Silane Coupling Agents Market, by Product, 2020–2027 Table 35 Latin America: Silane Coupling Agents Market, by Application, 2020–2027 LIST OF FIGURES: FIGURE 1 Silane Coupling Agents Market Segmentation FIGURE 2 Forecast Methodology FIGURE 3 Porter’s Five Forces Analysis of Silane Coupling Agents Market FIGURE 4 Supply Chain of Silane Coupling Agents Market FIGURE 5 Share of Silane Coupling Agents Market, by Country, 2020 (%) FIGURE 6 Global Silane Coupling Agents Market, 2020–2027 FIGURE 7 Sub Segments of Product FIGURE 9 Silane Coupling Agents Market size, by Product, 2020 (%) FIGURE 10 Share of Silane Coupling Agents Market, by Product, 2020–2027 FIGURE 17 Sub Segments of Application FIGURE 18 Silane Coupling Agents Market size, by Application, 2020 (%) FIGURE 19 Share of Silane Coupling Agents Market, by Application, 2020–2027
    254. List of Tables and Figures
      1. Table : FIGURE 1 Silane Coupling Agents Market Segmentation FIGURE 2 Forecast Methodology FIGURE 3 Porter’s Five Forces Analysis of Silane Coupling Agents Market FIGURE 4 Supply Chain of Silane Coupling Agents Market FIGURE 5 Share of Silane Coupling Agents Market, by Country, 2020 (%) FIGURE 6 Global Silane Coupling Agents Market, 2020–2027 FIGURE 7 Sub Segments of Product FIGURE 9 Silane Coupling Agents Market size, by Product, 2020 (%) FIGURE 10 Share of Silane Coupling Agents Market, by Product, 2020–2027 FIGURE 17 Sub Segments of Application FIGURE 18 Silane Coupling Agents Market size, by Application, 2020 (%) FIGURE 19 Share of Silane Coupling Agents Market, by Application, 2020–2027
    255. Table : FIGURE 1 Silane Coupling Agents Market Segmentation FIGURE 2 Forecast Methodology FIGURE 3 Porter’s Five Forces Analysis of Silane Coupling Agents Market FIGURE 4 Supply Chain of Silane Coupling Agents Market FIGURE 5 Share of Silane Coupling Agents Market, by Country, 2020 (%) FIGURE 6 Global Silane Coupling Agents Market, 2020–2027 FIGURE 7 Sub Segments of Product FIGURE 9 Silane Coupling Agents Market size, by Product, 2020 (%) FIGURE 10 Share of Silane Coupling Agents Market, by Product, 2020–2027 FIGURE 17 Sub Segments of Application FIGURE 18 Silane Coupling Agents Market size, by Application, 2020 (%) FIGURE 19 Share of Silane Coupling Agents Market, by Application, 2020–2027

    Silane Coupling Agents Market Segmentation

    Market Segmentation Overview

    • Detailed segmentation data will be available in the full report
    • Comprehensive analysis by multiple parameters
    • Regional and country-level breakdowns
    • Market size forecasts by segment
    Infographic

    Free Sample Request

    Kindly complete the form below to receive a free sample of this Report

    Get Free Sample

    Customer Strories

    “I am very pleased with how market segments have been defined in a relevant way for my purposes (such as "Portable Freezers & refrigerators" and "last-mile"). In general the report is well structured. Thanks very much for your efforts.”

    Victoria Milne

    Founder
    Case Study
    Chemicals and Materials