

Top Industry Leaders in the Self Service Analytics Market
Competitive Landscape of Self-Service Analytics Market
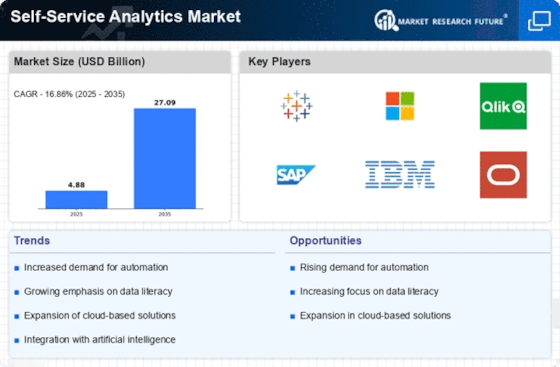
The self-service analytics (SSA) market is experiencing explosive growth, fueled by the democratization of data and the rising need for business agility. This empowers non-technical users to explore and analyze data independently, fostering data-driven decision-making across all organizational levels. Understanding the competitive landscape is crucial for both established players and aspiring entrants.
Key Players:
- Tableau Software (U.S)
- Microsoft Corporation (U.S.)
- IBM Corporation (U.S.)
- SAP SE (Germany)
- Splunk (U.S)
- Syncsort (U.S)
- Crimson Hexagon (U.S)
- Alteryx (U.S)
- SAS Institute (U.S)
- TIBCO Software (U.S.)
- Oracle Corporation (U.S.)
- Vista equity partners (U.S)
- DrivenBI (U.S)
Strategies Adopted:
- Product Innovation: Continuous development of intuitive interfaces, drag-and-drop features, AI-powered insights, and natural language processing capabilities are key differentiators.
- Cloud Focus: The shift towards cloud-based solutions offering scalability, accessibility, and lower maintenance costs is driving market adoption.
- Embedding and Integrations: Integrating SSA tools with existing business applications and platforms streamlines workflows and enhances user experience.
- Partnerships and Acquisitions: Strategic partnerships with technology providers and targeted acquisitions in specialized domains expand reach and capabilities.
Market Share Analysis Factors:
- Product Features and Functionality: The breadth and depth of analytical capabilities, ease of use, and data visualization tools are crucial considerations.
- Pricing and Deployment Models: Flexible pricing options and attractive subscription models for cloud-based solutions influence market penetration.
- Industry Focus and Specialization: Catering to specific industry needs with pre-built templates and domain-specific functions can be a competitive advantage.
- Customer Support and Services: Responsive technical support, training programs, and data governance expertise are essential for customer retention.
Current Investment Trends:
- Artificial Intelligence and Machine Learning: Integrating AI capabilities like automated insights generation and anomaly detection is a major focus area.
- Embedded Analytics: Embedding analytics directly into business applications fosters real-time decision-making and improves user experience.
- Augmented Analytics: Utilizing natural language processing and voice assistants to make data exploration more conversational and accessible.
- Data Democratization: Democratizing data access and analysis capabilities across all organizational levels is a key growth driver.
Latest Company Updates:
Dec 20, 2023: This move strengthens Power BI's cloud analytics capabilities, allowing users to seamlessly analyze large datasets stored in Azure Synapse Analytics.
Nov 15, 2023: Tableau highlights enhanced user collaboration features like shared dashboards and improved commenting functionalities, aiming to foster data-driven teamwork.
Oct 26, 2023: Looker introduces data lineage tracking and access control enhancements, addressing growing concerns about data security and governance within self-service environments.
Sept 21, 2023: This acquisition strengthens Domo's data integration capabilities, simplifying data ingestion from diverse sources for comprehensive analysis.
Aug 3, 2023: This partnership integrates DataRobot's AI-powered insights generation into Data Studio, allowing users to uncover hidden patterns and trends automatically.


