×
  • Cat-intel
  • MedIntelliX
  • Resources
  • About Us
  • Hero Background
    English
    Chinese
    French
    Japanese
    Korean
    German
    Spanish

    Primary Osteoarthritis Market Trends

    ID: MRFR/Pharma/3937-HCR
    120 Pages
    Rahul Gotadki
    October 2025

    Primary Osteoarthritis Market Research Report Information By Type (Knee, Hand, Neck, Hip, Wrist, Spinal, and Shoulder Osteoarthritis), Product Type, Drug Class (Combination Drug, LTA, ICS, SABA, LABA), Route of Administration, End User – Global Forecast till 2035

    Share:
    Download PDF ×

    We do not share your information with anyone. However, we may send you emails based on your report interest from time to time. You may contact us at any time to opt-out.

    Primary Osteoarthritis Market Infographic
    Purchase Options

    Market Trends

    Key Emerging Trends in the Primary Osteoarthritis Market

    Market trends related to primary osteoarthritis reflect a dynamic landscape resulting from several factors including aging populations, lifestyle changes as well as advancements in medical treatments. One major trend is increased incidence of primary OA due mainly to aging population worldwide. This has therefore resulted into increased patients’ number who look forward early diagnosis procedures through effective management practices.

    Concurrently with the growing incidence, treatment of primary OA is seen to change towards a holistic and multimodal approach. Although pharmaceutical interventions such as analgesics and anti-inflammatory drugs are still vital, there is an increasing awareness on the significance of non-pharmacologic alternatives. Within the context of comprehensive osteoarthritis management strategy, physical therapy, lifestyle adjustments, weight control and exercise programs have been given priority in the recent past as it cures both symptoms and help in stopping further degeneration.

    Additionally, the market has witnessed pharmaceutical advancements targeting the pathogenesis of OA. Research initiatives are currently aimed at developing disease modifying drugs that can slow or halt OA progression thereby giving patients more than mere symptom alleviation. The exploration of novel therapeutic agents including techniques for regenerative medicine like stem cell therapy signifies a shift from traditional options toward new treatment modalities.

    Moreover there has been growing attention to personalized and precision medicine for primary OA. As our understanding of genetic and molecular factors underlying OA susceptibility and progression expands so does the demand for tailored treatments strategies designed for individual patients. Biomarker discovery as well as genetic profiling paves way for targeted therapies making it possible to manage primary OA more effectively personalized approaches.

    The adoption of digital health interventions for managing OA also plays a part in market dynamics. Mobile apps, wearable tech and telehealth channels are being employed to increase patients’ involvement in care, assess symptoms and enable remote OA management support. This is important since it improves the accessibility of healthcare services especially to individuals who cannot move around freely or reside in far areas.

    However, issues persist in the primary OA market. The problem of accessing effective therapies remains at large especially in regions with different healthcare infrastructure. Furthermore, concerns have also arisen about affordability and sustainability of all-inclusive OA care because of economic burden caused by medication expenses, physiotherapy fees and surgical procedures.

    Author
    Rahul Gotadki
    Assistant Manager

    He holds an experience of about 7+ years in Market Research and Business Consulting, working under the spectrum of Life Sciences and Healthcare domains. Rahul conceptualizes and implements a scalable business strategy and provides strategic leadership to the clients. His expertise lies in market estimation, competitive intelligence, pipeline analysis, customer assessment, etc. In addition to the above, his other responsibility includes strategic tracking of high growth markets & advising clients on the potential areas of focus they could direct their business initiatives

    Leave a Comment

    FAQs

    What would be the primary osteoarthritis market CAGR during the forecast period (2022-2030)?

    The primary osteoarthritis market CAGR would be 9.42% during the forecast period.

    Which region would dominate the primary osteoarthritis market?

    North America would dominate the primary osteoarthritis market.

    Which would be the fastest-growing region in the primary osteoarthritis market?

    Asia Pacific region would be the fastest-growing primary osteoarthritis market.

    Name the end users included in the primary osteoarthritis market report.

    The primary osteoarthritis market report includes end users like research organization, medical institutes, hospitals & clinics, and others.

    What could be the primary osteoarthritis market restraint?

    Stringent regulatory procedures could hold back the primary osteoarthritis market growth.

    Market Summary

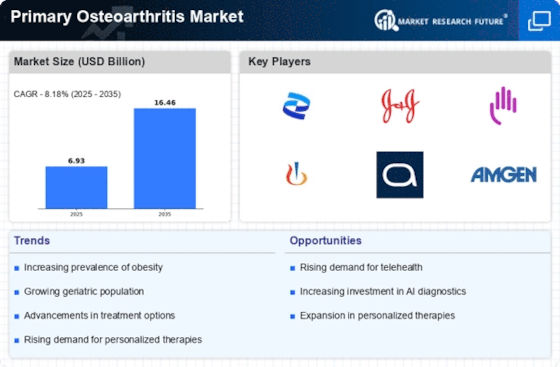
    The global primary osteoarthritis market is projected to experience substantial growth from 2024 to 2035.

    Key Market Trends & Highlights

    Primary Osteoarthritis Key Trends and Highlights

    • The market valuation is expected to rise from 6.93 USD billion in 2024 to 16.5 USD billion by 2035. A compound annual growth rate (CAGR) of 8.18 percent is anticipated for the period between 2025 and 2035. This growth trajectory indicates a robust demand for innovative treatment options and management strategies. Growing adoption of advanced therapeutic solutions due to increasing prevalence of osteoarthritis is a major market driver.

    Market Size & Forecast

    2024 Market Size 6.93 (USD Billion)
    2035 Market Size 16.5 (USD Billion)
    CAGR (2025-2035) 8.18%
    Largest Regional Market Share in 2024 latin_america)

    Major Players

    <p>Abbott Laboratories (U.S.), Johnson &amp; Johnson Limited (U.S.), Novartis AG (Switzerland), <a href="https://www.pfizer.com/news/articles/the_facts_about_osteoarthritis">Pfizer</a>, Inc. (U.S.), Eli Lilly and Company (U.S.), Abiogen Pharma (Italy), Ampio pharmaceuticals (U.S.), BioDelivery Sciences International (U.S.), CrystalGenomics (South Korea), Daiichi Sankyo (Japan), Eli Lilly (U.S.), Horizon Pharma (Republic of Ireland), Iroko Pharmaceuticals (U.S.), Merck &amp; Co. Ltd (U.S.), Nuvo Research (U.S.), Regeneus (Australia), Sanofi (France), SantoSolve (U.S.), Smith &amp; Nephew (UK), Winston Pharmaceuticals (India)</p>

    Market Trends

    <p>The increasing prevalence of primary osteoarthritis, coupled with an aging population, suggests a growing demand for innovative treatment options and management strategies in the healthcare sector.</p>

    Centers for Disease Control and Prevention (CDC)

    Primary Osteoarthritis Market Market Drivers

    Market Growth Projections

    The Global Primary Osteoarthritis Market Industry is poised for substantial growth, with projections indicating a market value of 6.93 USD Billion in 2024 and an anticipated increase to 16.5 USD Billion by 2035. This growth trajectory reflects a compound annual growth rate of 8.18% from 2025 to 2035. Factors contributing to this expansion include rising prevalence rates, advancements in treatment options, and increased healthcare investments. The market's evolution is likely to be influenced by ongoing research and development efforts aimed at improving patient outcomes and enhancing the overall quality of care for individuals suffering from osteoarthritis.

    Rising Healthcare Expenditure

    The Global Primary Osteoarthritis Market Industry is benefiting from the increasing healthcare expenditure observed globally. Governments and private sectors are investing more in healthcare infrastructure, which includes the development of specialized clinics and research facilities focused on osteoarthritis. This trend is likely to enhance access to care and improve treatment options for patients. As healthcare systems evolve and allocate more resources to managing chronic conditions like osteoarthritis, the market is expected to flourish. The anticipated growth trajectory, with a market value of 16.5 USD Billion by 2035, indicates that rising healthcare investments will play a crucial role in shaping the future of the industry.

    Increased Awareness and Education

    There is a growing emphasis on awareness and education regarding osteoarthritis, which is positively impacting the Global Primary Osteoarthritis Market Industry. Public health campaigns and educational initiatives are informing individuals about the risk factors, symptoms, and management strategies associated with osteoarthritis. This heightened awareness encourages early diagnosis and treatment, potentially reducing the burden of the disease. As more individuals seek medical advice and intervention, the market is likely to expand. The projected compound annual growth rate of 8.18% from 2025 to 2035 underscores the importance of education in driving market growth and improving patient outcomes.

    Rising Prevalence of Osteoarthritis

    The Global Primary Osteoarthritis Market Industry is experiencing a surge in demand due to the increasing prevalence of osteoarthritis among the aging population. As individuals age, the likelihood of developing osteoarthritis escalates, with estimates indicating that by 2024, the market is projected to reach 6.93 USD Billion. This rise is attributed to lifestyle factors, obesity, and genetic predispositions. The growing number of patients seeking treatment options drives innovation and investment in therapies, thereby enhancing the market's growth potential. Consequently, healthcare providers are focusing on developing effective management strategies to address this chronic condition.

    Advancements in Treatment Modalities

    Innovations in treatment modalities are propelling the Global Primary Osteoarthritis Market Industry forward. Recent advancements in pharmacological therapies, including disease-modifying osteoarthritis drugs and biologics, are enhancing patient outcomes. Additionally, the integration of minimally invasive surgical techniques is providing patients with effective alternatives to traditional surgery. These developments not only improve the quality of life for patients but also contribute to the overall market growth. As the industry evolves, the anticipated market value of 16.5 USD Billion by 2035 reflects the potential for continued advancements in treatment options, which may further stimulate demand and investment.

    Emerging Markets and Demographic Shifts

    Emerging markets are playing a pivotal role in the expansion of the Global Primary Osteoarthritis Market Industry. Countries with rapidly growing populations and increasing urbanization are witnessing a rise in lifestyle-related diseases, including osteoarthritis. As these regions develop economically, there is a corresponding increase in healthcare access and awareness. This demographic shift is likely to drive demand for osteoarthritis treatments and management solutions. The market's growth potential is underscored by the projected CAGR of 8.18% from 2025 to 2035, suggesting that emerging markets will significantly contribute to the overall expansion of the industry.

    Market Segment Insights

    Primary Osteoarthritis Type Insights

    <p>On the basis of the type, the market is segmented into knee osteoarthritis, hand osteoarthritis, neck osteoarthritis, hip osteoarthritis, wrist osteoarthritis, spinal osteoarthritis, shoulder osteoarthritis, and others</p>

    Primary Osteoarthritis Diagnosis Insights

    <p>On the basis of the diagnosis, the Primary Osteoarthritis Market is segmented into imaging, joint fluid analysis, and others. The imaging segment is further classified into divided X-rays, Magnetic resonance imaging (MRI), and others.</p>

    Primary Osteoarthritis Treatment Insights

    <p>On the basis of the treatment, the Primary Osteoarthritis Market is segmented into medication, therapies, surgery, and others. The medication segment can be classified into analgesics and non-steroidal anti-inflammatory drugs. The analgesics segment is further classified as acetaminophen, duloxetine, and others. The non-steroidal anti-inflammatory drugs can be further classified into aspirin, ibuprofen, naproxen sodium/ naproxen, and others.</p>

    Primary Osteoarthritis End-user Insights

    <p>On the basis of the end-user, the market is segmented into hospitals &amp; clinics, medical institutes, research organization, and others.</p>

    Get more detailed insights about Primary Osteoarthritis Market Research Report - Global Forecast till 2035

    Regional Insights

    Key Companies in the Primary Osteoarthritis Market market include

    Industry Developments

    Future Outlook

    Primary Osteoarthritis Market Future Outlook

    <p>The Global Primary Osteoarthritis Market is projected to grow at an 8.18% CAGR from 2024 to 2035, driven by increasing aging populations, advancements in treatment modalities, and rising healthcare expenditures.</p>

    New opportunities lie in:

    • <p>Develop innovative digital therapeutics for osteoarthritis management. Expand telehealth services to enhance patient access to care. Invest in regenerative medicine technologies to offer novel treatment options.</p>

    <p>By 2035, the market is expected to demonstrate robust growth, reflecting evolving treatment paradigms and increasing patient demand.</p>

    Market Segmentation

    Report Scope

    Report Attribute/MetricDetails
    Market Size 20235.63 (USD Billion)
    Market Size 20246.93 (USD Billion)
    Market Size 203212.56 (USD Billion)
    Compound Annual Growth Rate (CAGR)9.42 % (2024 - 2032)
    Report CoverageRevenue Forecast, Competitive Landscape, Growth Factors, and Trends
    Base Year2023
    Market Forecast Period2024 - 2032
    Historical Data2019 - 2023
      Geographies CoveredNorth America, Europe, Asia-Pacific, and Rest of the World (RoW)
      Key VendorsAbbott Laboratories (U.S.), Johnson & Johnson Limited (U.S.), Novartis AG (Switerzland), Pfizer, Inc. (U.S.), and Eli Lilly and Company (U.S.), Abiogen Pharma (Italy),  Ampio pharmaceuticals (U.S.),  BioDelivery Sciences International (U.S.), CrystalGenomics (South Korea), Daiichi Sankyo (Japan), Eli Lilly (U.S.), Horizon Pharma (Republic of Ireland), Iroko Pharmaceuticals (U.S.), Merck & Co. Ltd (U.S.), Nuvo Research (U.S.), Regeneus (Australia), Sanofi (France), SantoSolve (U.S.),  Smith & Nephew (UK), Winston Pharmaceuticals (India).
      Key Market OpportunitiesInnovations in medical technology, including imaging techniques, biomaterials, and minimally invasive surgical procedures
      Key Market DriversIncreasing prevalence of osteoarthritis in the elderly population due to longer life expectancies.

    FAQs

    What would be the primary osteoarthritis market CAGR during the forecast period (2022-2030)?

    The primary osteoarthritis market CAGR would be 9.42% during the forecast period.

    Which region would dominate the primary osteoarthritis market?

    North America would dominate the primary osteoarthritis market.

    Which would be the fastest-growing region in the primary osteoarthritis market?

    Asia Pacific region would be the fastest-growing primary osteoarthritis market.

    Name the end users included in the primary osteoarthritis market report.

    The primary osteoarthritis market report includes end users like research organization, medical institutes, hospitals &amp; clinics, and others.

    What could be the primary osteoarthritis market restraint?

    Stringent regulatory procedures could hold back the primary osteoarthritis market growth.

    1. SECTION I: EXECUTIVE SUMMARY AND KEY HIGHLIGHTS
      1. | 1.1 EXECUTIVE SUMMARY
      2. | | 1.1.1 Market Overview
      3. | | 1.1.2 Key Findings
      4. | | 1.1.3 Market Segmentation
      5. | | 1.1.4 Competitive Landscape
      6. | | 1.1.5 Challenges and Opportunities
      7. | | 1.1.6 Future Outlook
    2. SECTION II: SCOPING, METHODOLOGY AND MARKET STRUCTURE
      1. | 2.1 MARKET INTRODUCTION
      2. | | 2.1.1 Definition
      3. | | 2.1.2 Scope of the study
      4. | | | 2.1.2.1 Research Objective
      5. | | | 2.1.2.2 Assumption
      6. | | | 2.1.2.3 Limitations
      7. | 2.2 RESEARCH METHODOLOGY
      8. | | 2.2.1 Overview
      9. | | 2.2.2 Data Mining
      10. | | 2.2.3 Secondary Research
      11. | | 2.2.4 Primary Research
      12. | | | 2.2.4.1 Primary Interviews and Information Gathering Process
      13. | | | 2.2.4.2 Breakdown of Primary Respondents
      14. | | 2.2.5 Forecasting Model
      15. | | 2.2.6 Market Size Estimation
      16. | | | 2.2.6.1 Bottom-Up Approach
      17. | | | 2.2.6.2 Top-Down Approach
      18. | | 2.2.7 Data Triangulation
      19. | | 2.2.8 Validation
    3. SECTION III: QUALITATIVE ANALYSIS
      1. | 3.1 MARKET DYNAMICS
      2. | | 3.1.1 Overview
      3. | | 3.1.2 Drivers
      4. | | 3.1.3 Restraints
      5. | | 3.1.4 Opportunities
      6. | 3.2 MARKET FACTOR ANALYSIS
      7. | | 3.2.1 Value chain Analysis
      8. | | 3.2.2 Porter's Five Forces Analysis
      9. | | | 3.2.2.1 Bargaining Power of Suppliers
      10. | | | 3.2.2.2 Bargaining Power of Buyers
      11. | | | 3.2.2.3 Threat of New Entrants
      12. | | | 3.2.2.4 Threat of Substitutes
      13. | | | 3.2.2.5 Intensity of Rivalry
      14. | | 3.2.3 COVID-19 Impact Analysis
      15. | | | 3.2.3.1 Market Impact Analysis
      16. | | | 3.2.3.2 Regional Impact
      17. | | | 3.2.3.3 Opportunity and Threat Analysis
    4. SECTION IV: QUANTITATIVE ANALYSIS
      1. | 4.1 Healthcare, BY Type (USD Billion)
      2. | | 4.1.1 knee osteoarthritis
      3. | | 4.1.2 hand osteoarthritis
      4. | | 4.1.3 neck osteoarthritis
      5. | | 4.1.4 hip osteoarthritis
      6. | | 4.1.5 wrist osteoarthritis
      7. | | 4.1.6 spinal osteoarthritis
      8. | | 4.1.7 shoulder osteoarthritis
      9. | | 4.1.8 others
      10. | 4.2 Healthcare, BY Diagnosis (USD Billion)
      11. | | 4.2.1 imaging
      12. | | 4.2.2 joint fluid analysis
      13. | | 4.2.3 others
      14. | 4.3 Healthcare, BY Treatment (USD Billion)
      15. | | 4.3.1 medication
      16. | | 4.3.2 therapies
      17. | | 4.3.3 surgery
      18. | | 4.3.4 others
      19. | 4.4 Healthcare, BY End-user (USD Billion)
      20. | | 4.4.1 hospitals & clinics
      21. | | 4.4.2 medical institutes
      22. | | 4.4.3 research organization
      23. | | 4.4.4 others
      24. | 4.5 Healthcare, BY Region (USD Billion)
      25. | | 4.5.1 North America
      26. | | | 4.5.1.1 US
      27. | | | 4.5.1.2 Canada
      28. | | 4.5.2 Europe
      29. | | | 4.5.2.1 Germany
      30. | | | 4.5.2.2 UK
      31. | | | 4.5.2.3 France
      32. | | | 4.5.2.4 Russia
      33. | | | 4.5.2.5 Italy
      34. | | | 4.5.2.6 Spain
      35. | | | 4.5.2.7 Rest of Europe
      36. | | 4.5.3 APAC
      37. | | | 4.5.3.1 China
      38. | | | 4.5.3.2 India
      39. | | | 4.5.3.3 Japan
      40. | | | 4.5.3.4 South Korea
      41. | | | 4.5.3.5 Malaysia
      42. | | | 4.5.3.6 Thailand
      43. | | | 4.5.3.7 Indonesia
      44. | | | 4.5.3.8 Rest of APAC
      45. | | 4.5.4 South America
      46. | | | 4.5.4.1 Brazil
      47. | | | 4.5.4.2 Mexico
      48. | | | 4.5.4.3 Argentina
      49. | | | 4.5.4.4 Rest of South America
      50. | | 4.5.5 MEA
      51. | | | 4.5.5.1 GCC Countries
      52. | | | 4.5.5.2 South Africa
      53. | | | 4.5.5.3 Rest of MEA
    5. SECTION V: COMPETITIVE ANALYSIS
      1. | 5.1 Competitive Landscape
      2. | | 5.1.1 Overview
      3. | | 5.1.2 Competitive Analysis
      4. | | 5.1.3 Market share Analysis
      5. | | 5.1.4 Major Growth Strategy in the Healthcare
      6. | | 5.1.5 Competitive Benchmarking
      7. | | 5.1.6 Leading Players in Terms of Number of Developments in the Healthcare
      8. | | 5.1.7 Key developments and growth strategies
      9. | | | 5.1.7.1 New Product Launch/Service Deployment
      10. | | | 5.1.7.2 Merger & Acquisitions
      11. | | | 5.1.7.3 Joint Ventures
      12. | | 5.1.8 Major Players Financial Matrix
      13. | | | 5.1.8.1 Sales and Operating Income
      14. | | | 5.1.8.2 Major Players R&D Expenditure. 2023
      15. | 5.2 Company Profiles
      16. | | 5.2.1 Pfizer (US)
      17. | | | 5.2.1.1 Financial Overview
      18. | | | 5.2.1.2 Products Offered
      19. | | | 5.2.1.3 Key Developments
      20. | | | 5.2.1.4 SWOT Analysis
      21. | | | 5.2.1.5 Key Strategies
      22. | | 5.2.2 Johnson & Johnson (US)
      23. | | | 5.2.2.1 Financial Overview
      24. | | | 5.2.2.2 Products Offered
      25. | | | 5.2.2.3 Key Developments
      26. | | | 5.2.2.4 SWOT Analysis
      27. | | | 5.2.2.5 Key Strategies
      28. | | 5.2.3 Bristol-Myers Squibb (US)
      29. | | | 5.2.3.1 Financial Overview
      30. | | | 5.2.3.2 Products Offered
      31. | | | 5.2.3.3 Key Developments
      32. | | | 5.2.3.4 SWOT Analysis
      33. | | | 5.2.3.5 Key Strategies
      34. | | 5.2.4 Novartis (CH)
      35. | | | 5.2.4.1 Financial Overview
      36. | | | 5.2.4.2 Products Offered
      37. | | | 5.2.4.3 Key Developments
      38. | | | 5.2.4.4 SWOT Analysis
      39. | | | 5.2.4.5 Key Strategies
      40. | | 5.2.5 AbbVie (US)
      41. | | | 5.2.5.1 Financial Overview
      42. | | | 5.2.5.2 Products Offered
      43. | | | 5.2.5.3 Key Developments
      44. | | | 5.2.5.4 SWOT Analysis
      45. | | | 5.2.5.5 Key Strategies
      46. | | 5.2.6 Amgen (US)
      47. | | | 5.2.6.1 Financial Overview
      48. | | | 5.2.6.2 Products Offered
      49. | | | 5.2.6.3 Key Developments
      50. | | | 5.2.6.4 SWOT Analysis
      51. | | | 5.2.6.5 Key Strategies
      52. | | 5.2.7 Sanofi (FR)
      53. | | | 5.2.7.1 Financial Overview
      54. | | | 5.2.7.2 Products Offered
      55. | | | 5.2.7.3 Key Developments
      56. | | | 5.2.7.4 SWOT Analysis
      57. | | | 5.2.7.5 Key Strategies
      58. | | 5.2.8 GlaxoSmithKline (GB)
      59. | | | 5.2.8.1 Financial Overview
      60. | | | 5.2.8.2 Products Offered
      61. | | | 5.2.8.3 Key Developments
      62. | | | 5.2.8.4 SWOT Analysis
      63. | | | 5.2.8.5 Key Strategies
      64. | | 5.2.9 Merck & Co. (US)
      65. | | | 5.2.9.1 Financial Overview
      66. | | | 5.2.9.2 Products Offered
      67. | | | 5.2.9.3 Key Developments
      68. | | | 5.2.9.4 SWOT Analysis
      69. | | | 5.2.9.5 Key Strategies
      70. | 5.3 Appendix
      71. | | 5.3.1 References
      72. | | 5.3.2 Related Reports
    6. LIST OF FIGURES
      1. | 6.1 MARKET SYNOPSIS
      2. | 6.2 NORTH AMERICA MARKET ANALYSIS
      3. | 6.3 US MARKET ANALYSIS BY TYPE
      4. | 6.4 US MARKET ANALYSIS BY DIAGNOSIS
      5. | 6.5 US MARKET ANALYSIS BY TREATMENT
      6. | 6.6 US MARKET ANALYSIS BY END-USER
      7. | 6.7 CANADA MARKET ANALYSIS BY TYPE
      8. | 6.8 CANADA MARKET ANALYSIS BY DIAGNOSIS
      9. | 6.9 CANADA MARKET ANALYSIS BY TREATMENT
      10. | 6.10 CANADA MARKET ANALYSIS BY END-USER
      11. | 6.11 EUROPE MARKET ANALYSIS
      12. | 6.12 GERMANY MARKET ANALYSIS BY TYPE
      13. | 6.13 GERMANY MARKET ANALYSIS BY DIAGNOSIS
      14. | 6.14 GERMANY MARKET ANALYSIS BY TREATMENT
      15. | 6.15 GERMANY MARKET ANALYSIS BY END-USER
      16. | 6.16 UK MARKET ANALYSIS BY TYPE
      17. | 6.17 UK MARKET ANALYSIS BY DIAGNOSIS
      18. | 6.18 UK MARKET ANALYSIS BY TREATMENT
      19. | 6.19 UK MARKET ANALYSIS BY END-USER
      20. | 6.20 FRANCE MARKET ANALYSIS BY TYPE
      21. | 6.21 FRANCE MARKET ANALYSIS BY DIAGNOSIS
      22. | 6.22 FRANCE MARKET ANALYSIS BY TREATMENT
      23. | 6.23 FRANCE MARKET ANALYSIS BY END-USER
      24. | 6.24 RUSSIA MARKET ANALYSIS BY TYPE
      25. | 6.25 RUSSIA MARKET ANALYSIS BY DIAGNOSIS
      26. | 6.26 RUSSIA MARKET ANALYSIS BY TREATMENT
      27. | 6.27 RUSSIA MARKET ANALYSIS BY END-USER
      28. | 6.28 ITALY MARKET ANALYSIS BY TYPE
      29. | 6.29 ITALY MARKET ANALYSIS BY DIAGNOSIS
      30. | 6.30 ITALY MARKET ANALYSIS BY TREATMENT
      31. | 6.31 ITALY MARKET ANALYSIS BY END-USER
      32. | 6.32 SPAIN MARKET ANALYSIS BY TYPE
      33. | 6.33 SPAIN MARKET ANALYSIS BY DIAGNOSIS
      34. | 6.34 SPAIN MARKET ANALYSIS BY TREATMENT
      35. | 6.35 SPAIN MARKET ANALYSIS BY END-USER
      36. | 6.36 REST OF EUROPE MARKET ANALYSIS BY TYPE
      37. | 6.37 REST OF EUROPE MARKET ANALYSIS BY DIAGNOSIS
      38. | 6.38 REST OF EUROPE MARKET ANALYSIS BY TREATMENT
      39. | 6.39 REST OF EUROPE MARKET ANALYSIS BY END-USER
      40. | 6.40 APAC MARKET ANALYSIS
      41. | 6.41 CHINA MARKET ANALYSIS BY TYPE
      42. | 6.42 CHINA MARKET ANALYSIS BY DIAGNOSIS
      43. | 6.43 CHINA MARKET ANALYSIS BY TREATMENT
      44. | 6.44 CHINA MARKET ANALYSIS BY END-USER
      45. | 6.45 INDIA MARKET ANALYSIS BY TYPE
      46. | 6.46 INDIA MARKET ANALYSIS BY DIAGNOSIS
      47. | 6.47 INDIA MARKET ANALYSIS BY TREATMENT
      48. | 6.48 INDIA MARKET ANALYSIS BY END-USER
      49. | 6.49 JAPAN MARKET ANALYSIS BY TYPE
      50. | 6.50 JAPAN MARKET ANALYSIS BY DIAGNOSIS
      51. | 6.51 JAPAN MARKET ANALYSIS BY TREATMENT
      52. | 6.52 JAPAN MARKET ANALYSIS BY END-USER
      53. | 6.53 SOUTH KOREA MARKET ANALYSIS BY TYPE
      54. | 6.54 SOUTH KOREA MARKET ANALYSIS BY DIAGNOSIS
      55. | 6.55 SOUTH KOREA MARKET ANALYSIS BY TREATMENT
      56. | 6.56 SOUTH KOREA MARKET ANALYSIS BY END-USER
      57. | 6.57 MALAYSIA MARKET ANALYSIS BY TYPE
      58. | 6.58 MALAYSIA MARKET ANALYSIS BY DIAGNOSIS
      59. | 6.59 MALAYSIA MARKET ANALYSIS BY TREATMENT
      60. | 6.60 MALAYSIA MARKET ANALYSIS BY END-USER
      61. | 6.61 THAILAND MARKET ANALYSIS BY TYPE
      62. | 6.62 THAILAND MARKET ANALYSIS BY DIAGNOSIS
      63. | 6.63 THAILAND MARKET ANALYSIS BY TREATMENT
      64. | 6.64 THAILAND MARKET ANALYSIS BY END-USER
      65. | 6.65 INDONESIA MARKET ANALYSIS BY TYPE
      66. | 6.66 INDONESIA MARKET ANALYSIS BY DIAGNOSIS
      67. | 6.67 INDONESIA MARKET ANALYSIS BY TREATMENT
      68. | 6.68 INDONESIA MARKET ANALYSIS BY END-USER
      69. | 6.69 REST OF APAC MARKET ANALYSIS BY TYPE
      70. | 6.70 REST OF APAC MARKET ANALYSIS BY DIAGNOSIS
      71. | 6.71 REST OF APAC MARKET ANALYSIS BY TREATMENT
      72. | 6.72 REST OF APAC MARKET ANALYSIS BY END-USER
      73. | 6.73 SOUTH AMERICA MARKET ANALYSIS
      74. | 6.74 BRAZIL MARKET ANALYSIS BY TYPE
      75. | 6.75 BRAZIL MARKET ANALYSIS BY DIAGNOSIS
      76. | 6.76 BRAZIL MARKET ANALYSIS BY TREATMENT
      77. | 6.77 BRAZIL MARKET ANALYSIS BY END-USER
      78. | 6.78 MEXICO MARKET ANALYSIS BY TYPE
      79. | 6.79 MEXICO MARKET ANALYSIS BY DIAGNOSIS
      80. | 6.80 MEXICO MARKET ANALYSIS BY TREATMENT
      81. | 6.81 MEXICO MARKET ANALYSIS BY END-USER
      82. | 6.82 ARGENTINA MARKET ANALYSIS BY TYPE
      83. | 6.83 ARGENTINA MARKET ANALYSIS BY DIAGNOSIS
      84. | 6.84 ARGENTINA MARKET ANALYSIS BY TREATMENT
      85. | 6.85 ARGENTINA MARKET ANALYSIS BY END-USER
      86. | 6.86 REST OF SOUTH AMERICA MARKET ANALYSIS BY TYPE
      87. | 6.87 REST OF SOUTH AMERICA MARKET ANALYSIS BY DIAGNOSIS
      88. | 6.88 REST OF SOUTH AMERICA MARKET ANALYSIS BY TREATMENT
      89. | 6.89 REST OF SOUTH AMERICA MARKET ANALYSIS BY END-USER
      90. | 6.90 MEA MARKET ANALYSIS
      91. | 6.91 GCC COUNTRIES MARKET ANALYSIS BY TYPE
      92. | 6.92 GCC COUNTRIES MARKET ANALYSIS BY DIAGNOSIS
      93. | 6.93 GCC COUNTRIES MARKET ANALYSIS BY TREATMENT
      94. | 6.94 GCC COUNTRIES MARKET ANALYSIS BY END-USER
      95. | 6.95 SOUTH AFRICA MARKET ANALYSIS BY TYPE
      96. | 6.96 SOUTH AFRICA MARKET ANALYSIS BY DIAGNOSIS
      97. | 6.97 SOUTH AFRICA MARKET ANALYSIS BY TREATMENT
      98. | 6.98 SOUTH AFRICA MARKET ANALYSIS BY END-USER
      99. | 6.99 REST OF MEA MARKET ANALYSIS BY TYPE
      100. | 6.100 REST OF MEA MARKET ANALYSIS BY DIAGNOSIS
      101. | 6.101 REST OF MEA MARKET ANALYSIS BY TREATMENT
      102. | 6.102 REST OF MEA MARKET ANALYSIS BY END-USER
      103. | 6.103 KEY BUYING CRITERIA OF HEALTHCARE
      104. | 6.104 RESEARCH PROCESS OF MRFR
      105. | 6.105 DRO ANALYSIS OF HEALTHCARE
      106. | 6.106 DRIVERS IMPACT ANALYSIS: HEALTHCARE
      107. | 6.107 RESTRAINTS IMPACT ANALYSIS: HEALTHCARE
      108. | 6.108 SUPPLY / VALUE CHAIN: HEALTHCARE
      109. | 6.109 HEALTHCARE, BY TYPE, 2024 (% SHARE)
      110. | 6.110 HEALTHCARE, BY TYPE, 2024 TO 2035 (USD Billion)
      111. | 6.111 HEALTHCARE, BY DIAGNOSIS, 2024 (% SHARE)
      112. | 6.112 HEALTHCARE, BY DIAGNOSIS, 2024 TO 2035 (USD Billion)
      113. | 6.113 HEALTHCARE, BY TREATMENT, 2024 (% SHARE)
      114. | 6.114 HEALTHCARE, BY TREATMENT, 2024 TO 2035 (USD Billion)
      115. | 6.115 HEALTHCARE, BY END-USER, 2024 (% SHARE)
      116. | 6.116 HEALTHCARE, BY END-USER, 2024 TO 2035 (USD Billion)
      117. | 6.117 BENCHMARKING OF MAJOR COMPETITORS
    7. LIST OF TABLES
      1. | 7.1 LIST OF ASSUMPTIONS
      2. | | 7.1.1
      3. | 7.2 North America MARKET SIZE ESTIMATES; FORECAST
      4. | | 7.2.1 BY TYPE, 2025-2035 (USD Billion)
      5. | | 7.2.2 BY DIAGNOSIS, 2025-2035 (USD Billion)
      6. | | 7.2.3 BY TREATMENT, 2025-2035 (USD Billion)
      7. | | 7.2.4 BY END-USER, 2025-2035 (USD Billion)
      8. | 7.3 US MARKET SIZE ESTIMATES; FORECAST
      9. | | 7.3.1 BY TYPE, 2025-2035 (USD Billion)
      10. | | 7.3.2 BY DIAGNOSIS, 2025-2035 (USD Billion)
      11. | | 7.3.3 BY TREATMENT, 2025-2035 (USD Billion)
      12. | | 7.3.4 BY END-USER, 2025-2035 (USD Billion)
      13. | 7.4 Canada MARKET SIZE ESTIMATES; FORECAST
      14. | | 7.4.1 BY TYPE, 2025-2035 (USD Billion)
      15. | | 7.4.2 BY DIAGNOSIS, 2025-2035 (USD Billion)
      16. | | 7.4.3 BY TREATMENT, 2025-2035 (USD Billion)
      17. | | 7.4.4 BY END-USER, 2025-2035 (USD Billion)
      18. | 7.5 Europe MARKET SIZE ESTIMATES; FORECAST
      19. | | 7.5.1 BY TYPE, 2025-2035 (USD Billion)
      20. | | 7.5.2 BY DIAGNOSIS, 2025-2035 (USD Billion)
      21. | | 7.5.3 BY TREATMENT, 2025-2035 (USD Billion)
      22. | | 7.5.4 BY END-USER, 2025-2035 (USD Billion)
      23. | 7.6 Germany MARKET SIZE ESTIMATES; FORECAST
      24. | | 7.6.1 BY TYPE, 2025-2035 (USD Billion)
      25. | | 7.6.2 BY DIAGNOSIS, 2025-2035 (USD Billion)
      26. | | 7.6.3 BY TREATMENT, 2025-2035 (USD Billion)
      27. | | 7.6.4 BY END-USER, 2025-2035 (USD Billion)
      28. | 7.7 UK MARKET SIZE ESTIMATES; FORECAST
      29. | | 7.7.1 BY TYPE, 2025-2035 (USD Billion)
      30. | | 7.7.2 BY DIAGNOSIS, 2025-2035 (USD Billion)
      31. | | 7.7.3 BY TREATMENT, 2025-2035 (USD Billion)
      32. | | 7.7.4 BY END-USER, 2025-2035 (USD Billion)
      33. | 7.8 France MARKET SIZE ESTIMATES; FORECAST
      34. | | 7.8.1 BY TYPE, 2025-2035 (USD Billion)
      35. | | 7.8.2 BY DIAGNOSIS, 2025-2035 (USD Billion)
      36. | | 7.8.3 BY TREATMENT, 2025-2035 (USD Billion)
      37. | | 7.8.4 BY END-USER, 2025-2035 (USD Billion)
      38. | 7.9 Russia MARKET SIZE ESTIMATES; FORECAST
      39. | | 7.9.1 BY TYPE, 2025-2035 (USD Billion)
      40. | | 7.9.2 BY DIAGNOSIS, 2025-2035 (USD Billion)
      41. | | 7.9.3 BY TREATMENT, 2025-2035 (USD Billion)
      42. | | 7.9.4 BY END-USER, 2025-2035 (USD Billion)
      43. | 7.10 Italy MARKET SIZE ESTIMATES; FORECAST
      44. | | 7.10.1 BY TYPE, 2025-2035 (USD Billion)
      45. | | 7.10.2 BY DIAGNOSIS, 2025-2035 (USD Billion)
      46. | | 7.10.3 BY TREATMENT, 2025-2035 (USD Billion)
      47. | | 7.10.4 BY END-USER, 2025-2035 (USD Billion)
      48. | 7.11 Spain MARKET SIZE ESTIMATES; FORECAST
      49. | | 7.11.1 BY TYPE, 2025-2035 (USD Billion)
      50. | | 7.11.2 BY DIAGNOSIS, 2025-2035 (USD Billion)
      51. | | 7.11.3 BY TREATMENT, 2025-2035 (USD Billion)
      52. | | 7.11.4 BY END-USER, 2025-2035 (USD Billion)
      53. | 7.12 Rest of Europe MARKET SIZE ESTIMATES; FORECAST
      54. | | 7.12.1 BY TYPE, 2025-2035 (USD Billion)
      55. | | 7.12.2 BY DIAGNOSIS, 2025-2035 (USD Billion)
      56. | | 7.12.3 BY TREATMENT, 2025-2035 (USD Billion)
      57. | | 7.12.4 BY END-USER, 2025-2035 (USD Billion)
      58. | 7.13 APAC MARKET SIZE ESTIMATES; FORECAST
      59. | | 7.13.1 BY TYPE, 2025-2035 (USD Billion)
      60. | | 7.13.2 BY DIAGNOSIS, 2025-2035 (USD Billion)
      61. | | 7.13.3 BY TREATMENT, 2025-2035 (USD Billion)
      62. | | 7.13.4 BY END-USER, 2025-2035 (USD Billion)
      63. | 7.14 China MARKET SIZE ESTIMATES; FORECAST
      64. | | 7.14.1 BY TYPE, 2025-2035 (USD Billion)
      65. | | 7.14.2 BY DIAGNOSIS, 2025-2035 (USD Billion)
      66. | | 7.14.3 BY TREATMENT, 2025-2035 (USD Billion)
      67. | | 7.14.4 BY END-USER, 2025-2035 (USD Billion)
      68. | 7.15 India MARKET SIZE ESTIMATES; FORECAST
      69. | | 7.15.1 BY TYPE, 2025-2035 (USD Billion)
      70. | | 7.15.2 BY DIAGNOSIS, 2025-2035 (USD Billion)
      71. | | 7.15.3 BY TREATMENT, 2025-2035 (USD Billion)
      72. | | 7.15.4 BY END-USER, 2025-2035 (USD Billion)
      73. | 7.16 Japan MARKET SIZE ESTIMATES; FORECAST
      74. | | 7.16.1 BY TYPE, 2025-2035 (USD Billion)
      75. | | 7.16.2 BY DIAGNOSIS, 2025-2035 (USD Billion)
      76. | | 7.16.3 BY TREATMENT, 2025-2035 (USD Billion)
      77. | | 7.16.4 BY END-USER, 2025-2035 (USD Billion)
      78. | 7.17 South Korea MARKET SIZE ESTIMATES; FORECAST
      79. | | 7.17.1 BY TYPE, 2025-2035 (USD Billion)
      80. | | 7.17.2 BY DIAGNOSIS, 2025-2035 (USD Billion)
      81. | | 7.17.3 BY TREATMENT, 2025-2035 (USD Billion)
      82. | | 7.17.4 BY END-USER, 2025-2035 (USD Billion)
      83. | 7.18 Malaysia MARKET SIZE ESTIMATES; FORECAST
      84. | | 7.18.1 BY TYPE, 2025-2035 (USD Billion)
      85. | | 7.18.2 BY DIAGNOSIS, 2025-2035 (USD Billion)
      86. | | 7.18.3 BY TREATMENT, 2025-2035 (USD Billion)
      87. | | 7.18.4 BY END-USER, 2025-2035 (USD Billion)
      88. | 7.19 Thailand MARKET SIZE ESTIMATES; FORECAST
      89. | | 7.19.1 BY TYPE, 2025-2035 (USD Billion)
      90. | | 7.19.2 BY DIAGNOSIS, 2025-2035 (USD Billion)
      91. | | 7.19.3 BY TREATMENT, 2025-2035 (USD Billion)
      92. | | 7.19.4 BY END-USER, 2025-2035 (USD Billion)
      93. | 7.20 Indonesia MARKET SIZE ESTIMATES; FORECAST
      94. | | 7.20.1 BY TYPE, 2025-2035 (USD Billion)
      95. | | 7.20.2 BY DIAGNOSIS, 2025-2035 (USD Billion)
      96. | | 7.20.3 BY TREATMENT, 2025-2035 (USD Billion)
      97. | | 7.20.4 BY END-USER, 2025-2035 (USD Billion)
      98. | 7.21 Rest of APAC MARKET SIZE ESTIMATES; FORECAST
      99. | | 7.21.1 BY TYPE, 2025-2035 (USD Billion)
      100. | | 7.21.2 BY DIAGNOSIS, 2025-2035 (USD Billion)
      101. | | 7.21.3 BY TREATMENT, 2025-2035 (USD Billion)
      102. | | 7.21.4 BY END-USER, 2025-2035 (USD Billion)
      103. | 7.22 South America MARKET SIZE ESTIMATES; FORECAST
      104. | | 7.22.1 BY TYPE, 2025-2035 (USD Billion)
      105. | | 7.22.2 BY DIAGNOSIS, 2025-2035 (USD Billion)
      106. | | 7.22.3 BY TREATMENT, 2025-2035 (USD Billion)
      107. | | 7.22.4 BY END-USER, 2025-2035 (USD Billion)
      108. | 7.23 Brazil MARKET SIZE ESTIMATES; FORECAST
      109. | | 7.23.1 BY TYPE, 2025-2035 (USD Billion)
      110. | | 7.23.2 BY DIAGNOSIS, 2025-2035 (USD Billion)
      111. | | 7.23.3 BY TREATMENT, 2025-2035 (USD Billion)
      112. | | 7.23.4 BY END-USER, 2025-2035 (USD Billion)
      113. | 7.24 Mexico MARKET SIZE ESTIMATES; FORECAST
      114. | | 7.24.1 BY TYPE, 2025-2035 (USD Billion)
      115. | | 7.24.2 BY DIAGNOSIS, 2025-2035 (USD Billion)
      116. | | 7.24.3 BY TREATMENT, 2025-2035 (USD Billion)
      117. | | 7.24.4 BY END-USER, 2025-2035 (USD Billion)
      118. | 7.25 Argentina MARKET SIZE ESTIMATES; FORECAST
      119. | | 7.25.1 BY TYPE, 2025-2035 (USD Billion)
      120. | | 7.25.2 BY DIAGNOSIS, 2025-2035 (USD Billion)
      121. | | 7.25.3 BY TREATMENT, 2025-2035 (USD Billion)
      122. | | 7.25.4 BY END-USER, 2025-2035 (USD Billion)
      123. | 7.26 Rest of South America MARKET SIZE ESTIMATES; FORECAST
      124. | | 7.26.1 BY TYPE, 2025-2035 (USD Billion)
      125. | | 7.26.2 BY DIAGNOSIS, 2025-2035 (USD Billion)
      126. | | 7.26.3 BY TREATMENT, 2025-2035 (USD Billion)
      127. | | 7.26.4 BY END-USER, 2025-2035 (USD Billion)
      128. | 7.27 MEA MARKET SIZE ESTIMATES; FORECAST
      129. | | 7.27.1 BY TYPE, 2025-2035 (USD Billion)
      130. | | 7.27.2 BY DIAGNOSIS, 2025-2035 (USD Billion)
      131. | | 7.27.3 BY TREATMENT, 2025-2035 (USD Billion)
      132. | | 7.27.4 BY END-USER, 2025-2035 (USD Billion)
      133. | 7.28 GCC Countries MARKET SIZE ESTIMATES; FORECAST
      134. | | 7.28.1 BY TYPE, 2025-2035 (USD Billion)
      135. | | 7.28.2 BY DIAGNOSIS, 2025-2035 (USD Billion)
      136. | | 7.28.3 BY TREATMENT, 2025-2035 (USD Billion)
      137. | | 7.28.4 BY END-USER, 2025-2035 (USD Billion)
      138. | 7.29 South Africa MARKET SIZE ESTIMATES; FORECAST
      139. | | 7.29.1 BY TYPE, 2025-2035 (USD Billion)
      140. | | 7.29.2 BY DIAGNOSIS, 2025-2035 (USD Billion)
      141. | | 7.29.3 BY TREATMENT, 2025-2035 (USD Billion)
      142. | | 7.29.4 BY END-USER, 2025-2035 (USD Billion)
      143. | 7.30 Rest of MEA MARKET SIZE ESTIMATES; FORECAST
      144. | | 7.30.1 BY TYPE, 2025-2035 (USD Billion)
      145. | | 7.30.2 BY DIAGNOSIS, 2025-2035 (USD Billion)
      146. | | 7.30.3 BY TREATMENT, 2025-2035 (USD Billion)
      147. | | 7.30.4 BY END-USER, 2025-2035 (USD Billion)
      148. | 7.31 PRODUCT LAUNCH/PRODUCT DEVELOPMENT/APPROVAL
      149. | | 7.31.1
      150. | 7.32 ACQUISITION/PARTNERSHIP
      151. | | 7.32.1

    Primary Osteoarthritis Market Segmentation

    Market Segmentation Overview

    • Detailed segmentation data will be available in the full report
    • Comprehensive analysis by multiple parameters
    • Regional and country-level breakdowns
    • Market size forecasts by segment
    Infographic

    Free Sample Request

    Kindly complete the form below to receive a free sample of this Report

    Get Free Sample

    Customer Strories

    “I am very pleased with how market segments have been defined in a relevant way for my purposes (such as "Portable Freezers & refrigerators" and "last-mile"). In general the report is well structured. Thanks very much for your efforts.”

    Victoria Milne

    Founder
    Case Study
    Chemicals and Materials

    Compare Licence

    ×
    Features License Type
    Single User Multiuser License Enterprise User
    Price $4,950 $5,950 $7,250
    Maximum User Access Limit 1 User Upto 10 Users Unrestricted Access Throughout the Organization
    Free Customization
    Direct Access to Analyst
    Deliverable Format
    Platform Access
    Discount on Next Purchase 10% 15% 15%
    Printable Versions