


Pressure Sensitive Adhesives Size
Market Size Snapshot
| Year | Value |
|---|---|
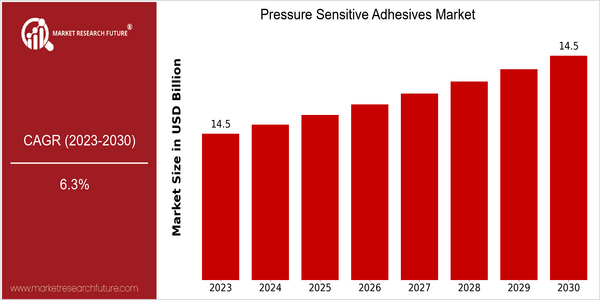
| 2023 | USD 14.5 Billion |
| 2030 | USD 14.5 Billion |
| CAGR (2022-2030) | 6.3 % |
Note – Market size depicts the revenue generated over the financial year
The world market for pressure-sensitive adhesives is expected to be worth $ 14.5 billion in 2023, and is projected to remain steady at $ 14.5 billion in 2023. The CAGR from 2022 to 2030 is 6.3%. The market is growing because of the increasing use of these adhesives in the automobile, electrical and packaging industries, where their versatility and effectiveness are paramount. Also contributing to this growth are improvements in the formulation of these products and the rising demand for eco-friendly products. Also, technological advances such as the development of high-performance adhesives that offer greater adhesion and resistance to the elements, are contributing to this growth. Strategic initiatives undertaken by industry leaders such as 3M, Henkel and Avery Dennison, to increase their product offerings and maintain a competitive advantage are also contributing to this growth. The recent launch of products that offer sustainable and eco-friendly solutions is a reflection of the industry’s shift towards sustainable and eco-friendly practices.
Regional Market Size
Regional Deep Dive
Its applications are diverse in the automotive, packaging and electronics industries. Its markets are characterized by their own dynamics, which are determined by the different manufacturing capabilities, regulatory frameworks and the preferences of the consumers. The market is growing due to the increasing demand for lightweight materials and sustainable solutions, especially in the automotive and construction industries. The development of adhesive formulations and the emergence of eco-friendly products are also shaping the market. Adaptation to changing market conditions is therefore necessary for the industry.
Europe
- The PSA market in Europe is largely influenced by the strict safety and environmental regulations of the European Union, which have prompted manufacturers to invest in research and development and to comply with REACH regulations. In particular, there has been a growing development of bio-based PSAs.
- The automotive sector in Europe is increasingly adopting PSAs for lightweight applications, with companies like BASF and Sika investing in R&D to create high-performance adhesive solutions that meet the industry's evolving needs.
Asia Pacific
- During the past few years, the Asia-Pacific region has been rapidly industrializing and urbanizing, and has a great need for PSA in the packaging and construction industries. China and India are the two main contributors, with local manufacturers increasing their production capacity.
- Innovations in smart adhesive technologies are emerging in this region, with companies like Nitto Denko and Toyobo developing advanced PSAs that offer enhanced functionality, such as temperature sensitivity and moisture resistance.
Latin America
- Latin America's PSA market is characterized by a growing demand for packaging solutions, particularly in the food and beverage sector. The region's economic recovery post-pandemic is driving investments in manufacturing and distribution.
- Local companies are increasingly focusing on developing region-specific adhesive solutions that cater to cultural preferences and local regulations, with firms like Axiom Materials expanding their product offerings to meet these needs.
North America
- The North American market for pressure-sensitive adhesives is being swept along by the demand for a growing share of eco-friendly products. This is being driven by stricter regulations and the growing demand for sustainable products. These are the reasons why 3M and Henkel are now at the forefront of the market, introducing new products that are more friendly to the environment.
- The newer developments, like the high-performance adhesives developed for the car, have improved the performance and the life of the PSAs. These trends are encouraged by the American Chemistry Council, which encourages the use of advanced materials in the manufacturing industry.
Middle East And Africa
- In the Middle East and Africa, the PSA market is driven by the growing construction sector and increasing demand for packaging solutions. The region's economic diversification efforts are also fostering investments in manufacturing capabilities.
- Regulatory changes aimed at improving product safety and environmental standards are prompting local manufacturers to adopt more sustainable practices, with companies like AFT Industries leading initiatives to develop eco-friendly adhesive solutions.
Did You Know?
“Did you know that pressure-sensitive adhesives can bond to surfaces without the need for heat or solvents, making them a versatile choice for various applications?” — Adhesives and Sealants Industry Magazine
Segmental Market Size
The pressure-sensitive adhesives segment is a major player in various industries, including the packaging, automobile, and electrical industries, and is currently growing steadily. The increasing demand for lightweight materials in the automobile industry and the growing trend towards sustainable packaging are the main drivers of the market. Also, as a result of the government’s focus on eco-friendly materials, pressure-sensitive adhesives are becoming more and more popular with manufacturers who are looking to meet the increasingly stricter environmental regulations. Currently, the application of pressure-sensitive adhesives is at a mature stage, with 3M and Henkel as the main innovators in this field. North America and Europe are the regions where pressure-sensitive adhesives are most widely used, especially in the automobile and consumer goods industries. The most important application areas include labels, tapes, and medical devices, where the reliability and performance of the product are essential. The e-commerce trend and the growing demand for sustainable products are the main drivers of the market. The development of new adhesives, such as bio-based and smart adhesives, is shaping the future of this market.
Future Outlook
The market for pressure-sensitive adhesives will grow at a CAGR of 6.3% from 2023 to 2030. This will raise the market to about $ 14.5 billion in revenue by 2030. The demand for pressure-sensitive adhesives is increasing in many end-use industries, including the automobile, the packaging and the electrical and electronics industries. The penetration of pressure-sensitive adhesives is expected to increase. The packaging application will account for more than 30% of the market by 2030, reflecting the shift towards sustainable and efficient bonding solutions. The development of bio-based and environment-friendly pressure-sensitive adhesives will also have a significant impact on the market. Regulations that promote sustainable development and the reduction of the negative impact on the environment will also promote the use of these new products. The growth of e-commerce and the need for efficient packaging solutions will also boost the demand for pressure-sensitive adhesives, especially in the flexible packaging sector. The development of new applications will be facilitated by the efforts of manufacturers to improve the performance and functionality of pressure-sensitive adhesives. The pressure-sensitive adhesives will be used in many of the products of modern industry and in the production of many end-use products.


Leave a Comment