• Cat-intel
  • MedIntelliX
  • Resources
  • About Us
  • Hero Background
    English
    Chinese
    French
    Japanese
    Korean
    German
    Spanish

    Polyolefin Elastomers Market Size

    ID: MRFR/CnM/4935-HCR
    100 Pages
    Anshula Mandaokar
    October 2025

    Polyolefin Elastomers Market Research Report Information by Type (Polyethylene, Polypropylene), Manufacturing Method (Injection Molding, Extrusion Molding), Application (Adhesives, Films), End-Use Industry (Automotive, Consumer Goods) and Region - Forecast till 2035

    Share:
    Download PDF ×

    We do not share your information with anyone. However, we may send you emails based on your report interest from time to time. You may contact us at any time to opt-out.

    Polyolefin Elastomers Market Infographic
    Purchase Options

    Polyolefin Elastomers Size

    Polyolefin Elastomers Market Growth Projections and Opportunities

    Numerous variables interact to shape the dynamics of the Polyolefin Elastomers (POE) market. It is imperative for industry players seeking to navigate and leverage chances in the Polyolefin Elastomers sector to comprehend these market variables. Here is a brief synopsis presented in the style of a paragraph with a pointer structure: Availability of Raw Materials: The price and availability of raw materials have a big impact on the market for polyolefin elastomers. Since POE is a derivative of polyethylene, its entire cost structure is impacted by changes in the production and pricing patterns of ethylene and other important feedstocks. Industries of End Users: POE is widely used in a variety of end-user sectors, including packaging, footwear, and automobiles. shifts in these industries' demand brought about by the state of the economy and customer preferences, and industry-specific trends, directly impact the overall consumption of Polyolefin Elastomers. Technological developments: Continuous developments in formulation and polymer processing techniques have a major influence on the POE industry. The market for polyolefin elastomers is expanding as a result of new applications being developed, product performance enhancements, and production process innovations. Environmental regulations: Tight environmental regulations and a rising awareness of sustainability are driving the demand for environmentally friendly products. Due to their flexibility and reusability, polyolefin elastomers stand to benefit from increased focus on environmentally friendly alternatives in a number of industries. Global Economic Conditions: The overall status of the world economy has a major impact on the demand for polyolefin elastomers. Economic fluctuations, including recessions and booms, can affect consumer spending and industry production in the long run.
    Polyolefin Elastomers Market Size Graph
    Author
    Anshula Mandaokar
    Team Lead - Research

    Anshula Mandaokar holds an academic degree in Chemical Engineering and has been contributing to the field for more than 5 years. She has expertise in Market Research and Business Consulting and serves as a Team Lead for a reputed Market Research firm under the Chemicals and Materials domain spectrum. She has worked on multiple projects, generating explicit results in a quick turnaround time. Her understanding of data interpretation justifies her role as a leader.

    Leave a Comment

    FAQs

    At what CAGR is the Polyolefin Elastomers Market predicted to grow during the forecast period?

    Polyolefin Elastomers Market is predicted to grow at a compound annual growth rate of 7.70% from 2024-2035.

    What is the forecast period of Polyolefin Elastomers Market research report?

    The forecast period for Polyolefin Elastomers Market research report is 2025-2035.

    Which region will lead the global Polyolefin Elastomers Market?

    Global Polyolefin Elastomers Market is dominated by APAC region.

    What are the key factors driving the Polyolefin Elastomers Market?

    Increase the demand for Industrial cleaning sector

    Who are the key players in the Polyolefin Elastomers Market?

    The prominent players operating in the Polyolefin Elastomers Market include

    At what CAGR is the Polyolefin Elastomers Market predicted to grow during the forecast period?

    Polyolefin Elastomers Market is predicted to grow at Significant through forecast period of 2024-2035.

    Market Summary

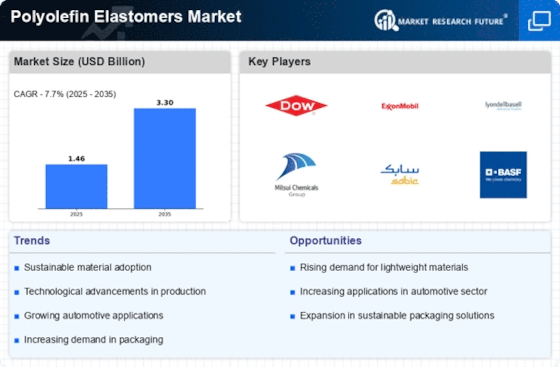
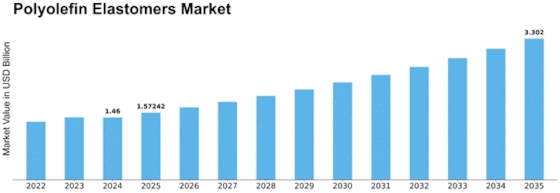
    As per Market Research Future Analysis, the Polyolefin Elastomers Market was valued at USD 1.46 billion in 2024 and is projected to grow to USD 3.30 billion by 2035, with a CAGR of 7.70% from 2025 to 2035. The market is driven by increasing applications in various sectors such as automotive, packaging, and medical equipment. The Asia-Pacific region holds the largest market share, fueled by high demand for molded products. North America is expected to see significant growth due to the automotive industry's demand for polyolefin elastomers. However, fluctuations in crude oil prices and high raw material costs may hinder market growth.

    Key Market Trends & Highlights

    Key trends influencing the Polyolefin Elastomers Market include technological advancements and rising demand across various applications.

    • Market Size in 2024: USD 1.46 billion
    • Projected Market Size by 2035: USD 3.30 billion
    • CAGR during 2024-2032: 7.70%
    • Asia-Pacific holds the largest market share due to rising demand in molded products.

    Market Size & Forecast

    2024 Market Size USD 1.46 billion
    2035 Market Size USD 3.30 billion
    CAGR 7.70%

    Major Players

    Key players include DowDuPont (US), Exxon Mobil Corporation (US), Mitsui Chemicals, Inc. (Japan), LG Chem (South Korea), and SABIC (Saudi Arabia).

    Market Trends

    The ongoing evolution in the automotive and packaging sectors appears to drive a notable increase in demand for polyolefin elastomers, reflecting a broader trend towards lightweight and flexible materials.

    U.S. Department of Commerce

    Polyolefin Elastomers Market Market Drivers

    Market Growth Projections

    The Global Polyolefin Elastomers Market Industry is poised for substantial growth, with projections indicating a market value of 1.46 USD Billion in 2024, expected to reach 3.3 USD Billion by 2035. This growth trajectory suggests a compound annual growth rate (CAGR) of 7.69% from 2025 to 2035, reflecting the increasing adoption of polyolefin elastomers across various sectors. The expanding applications, coupled with technological advancements and sustainability trends, are likely to drive this growth, positioning the market favorably for future developments.

    Rising Demand from Automotive Sector

    The automotive industry is a crucial driver for the Global Polyolefin Elastomers Market Industry, as manufacturers increasingly seek lightweight materials to enhance fuel efficiency and reduce emissions. Polyolefin elastomers, known for their flexibility and durability, are being utilized in various automotive applications, including interior components and exterior trims. As the automotive sector continues to evolve, the demand for polyolefin elastomers is projected to rise significantly, contributing to the market's growth. In 2024, the market is valued at 1.46 USD Billion, with expectations to reach 3.3 USD Billion by 2035, indicating a robust CAGR of 7.69% from 2025 to 2035.

    Growth in Consumer Goods Applications

    The Global Polyolefin Elastomers Market Industry is experiencing substantial growth due to the increasing utilization of these materials in consumer goods. Products such as flexible packaging, household items, and personal care products benefit from the unique properties of polyolefin elastomers, including their softness and resilience. As consumer preferences shift towards high-performance materials that offer both functionality and aesthetic appeal, manufacturers are increasingly incorporating polyolefin elastomers into their product lines. This trend is expected to drive market expansion, as the demand for innovative and sustainable consumer goods continues to rise.

    Technological Advancements in Production

    Technological advancements in the production of polyolefin elastomers are significantly influencing the Global Polyolefin Elastomers Market Industry. Innovations in polymerization techniques and processing methods have enhanced the efficiency and quality of elastomer production. These advancements enable manufacturers to produce materials with tailored properties, catering to specific applications across various industries. As production processes become more efficient, the cost of polyolefin elastomers may decrease, further driving their adoption in diverse applications. This trend suggests a positive outlook for the market, as companies leverage technology to meet growing demand.

    Expanding Applications in Medical Devices

    The Global Polyolefin Elastomers Market Industry is witnessing growth due to the expanding applications of these materials in the medical sector. Polyolefin elastomers are increasingly used in medical devices, such as tubing, seals, and gaskets, owing to their biocompatibility and flexibility. As the healthcare industry continues to innovate and develop new medical technologies, the demand for high-performance materials like polyolefin elastomers is expected to rise. This trend indicates a promising future for the market, as healthcare providers seek reliable and safe materials for medical applications.

    Sustainability Trends in Material Selection

    Sustainability trends are increasingly shaping the Global Polyolefin Elastomers Market Industry, as consumers and manufacturers alike prioritize eco-friendly materials. Polyolefin elastomers, being recyclable and less harmful to the environment compared to traditional materials, are gaining traction in various applications. Companies are actively seeking sustainable alternatives to meet regulatory requirements and consumer expectations for environmentally responsible products. This shift towards sustainability is likely to bolster the market, as more industries adopt polyolefin elastomers to align with green initiatives and reduce their carbon footprint.

    Market Segment Insights

    Regional Insights

    Key Companies in the Polyolefin Elastomers Market market include

    Industry Developments

    Dec 2021 Roscom Inc., an ISO 9001:2015–certified PVC compounding factory in Croydon, Pennsylvania, was acquired by Geon Performance Solutions yesterday. This is a significant step forward in their plan. Customers throughout the Northeastern United States and parts of Canada will benefit from the Croydon facility and tenured workforce. The firm also plans to take benefit of the Roscom team's excellent knowledge and look forward to expanding its product line for consumers. Geon, based in the Cleveland suburb of Westlake, OH, has built a portfolio of vinyl and polyolefin polymers and full-service production that caters to a variety of markets.

    Aug 2021 Yamaha Rightwaters has recovered 10,000 pounds of waste polyolefin film that can be transformed back into virgin circular polymers via reverse logistics. It will act as a proof-of-concept for a countrywide program to reduce plastic trash in the country's waterways. The program uses sophisticated recycler Nexus Fuels' technology and the labor of Marietta, GA-based Tommy Nobis Enterprises, which provides vocational support and employment training for people with impairments.

    Target Audience

      • Polyolefin elastomer manufacturers
      • Traders and distributors of polyolefin elastomers
      • Production process industries
      • Potential investors
      • Raw material suppliers
      • Nationalized laboratories

    Future Outlook

    Polyolefin Elastomers Market Future Outlook

    The Polyolefin Elastomers Market is projected to grow at a 7.70% CAGR from 2025 to 2035, driven by increasing demand in automotive, packaging, and consumer goods sectors.

    New opportunities lie in:

    • Invest in bio-based polyolefin elastomers to capture eco-conscious consumer segments.
    • Develop advanced manufacturing techniques to enhance product performance and reduce costs.
    • Expand applications in medical devices to leverage growing healthcare market demands.

    By 2035, the Polyolefin Elastomers Market is expected to achieve substantial growth, reflecting evolving industry needs and innovations.

    Market Segmentation

    Report Scope

    Report Attribute/Metric Details
      Market Size 2024 USD 1.46 Billion
    Market Size 2035 3.30
      Compound Annual Growth Rate (CAGR) 7.70% (2025 - 2035)
      Base Year 2024
      Market Forecast Period 2025 - 2035
      Historical Data   2018-2022
      Forecast Units   Value (USD Million)
      Report Coverage    Revenue Forecast, Competitive Landscape, Growth Factors, and Trends
      Segments Covered   By Type, Manufacturing Method, Application, End-Use Industry and Region
      Geographies Covered   North America, Europe, Asia-Pacific, and Rest of the World (RoW)
      Key Vendors   DowDuPont (US), the Dow Chemical Company (US), Exxon Mobil Corporation (US), Mitsui Chemicals, Inc. (Japan), LG Chem (South Korea), Mitsubishi Chemical Holding Corporation (Japan), Polmann India Ltd (India), SABIC (Saudi Arabia), LyondellBasell Industries Holdings BV (Netherlands), RTP Company (US), and PolyOne Corporation (United States).
      Key Market Opportunities   Increasing demand in the automotive industry is expected to propel the growth
      Key Market Drivers   Growing applications in adhesives, footwear foams, molded rubber goods, pipes, packaging, wires and cables are expected to drive the growth
    Market Size 2025 1.57

    FAQs

    At what CAGR is the Polyolefin Elastomers Market predicted to grow during the forecast period?

    Polyolefin Elastomers Market is predicted to grow at a compound annual growth rate of 7.70% from 2024-2035.

    What is the forecast period of Polyolefin Elastomers Market research report?

    The forecast period for Polyolefin Elastomers Market research report is 2025-2035.

    Which region will lead the global Polyolefin Elastomers Market?

    Global Polyolefin Elastomers Market is dominated by APAC region.

    What are the key factors driving the Polyolefin Elastomers Market?

    Increase the demand for Industrial cleaning sector

    Who are the key players in the Polyolefin Elastomers Market?

    The prominent players operating in the Polyolefin Elastomers Market include

    At what CAGR is the Polyolefin Elastomers Market predicted to grow during the forecast period?

    Polyolefin Elastomers Market is predicted to grow at Significant through forecast period of 2024-2035.

    1. SECTION I: EXECUTIVE SUMMARY AND KEY HIGHLIGHTS
      1. | 1.1 EXECUTIVE SUMMARY
      2. | | 1.1.1 Market Overview
      3. | | 1.1.2 Key Findings
      4. | | 1.1.3 Market Segmentation
      5. | | 1.1.4 Competitive Landscape
      6. | | 1.1.5 Challenges and Opportunities
      7. | | 1.1.6 Future Outlook
    2. SECTION II: SCOPING, METHODOLOGY AND MARKET STRUCTURE
      1. | 2.1 MARKET INTRODUCTION
      2. | | 2.1.1 Definition
      3. | | 2.1.2 Scope of the study
      4. | | | 2.1.2.1 Research Objective
      5. | | | 2.1.2.2 Assumption
      6. | | | 2.1.2.3 Limitations
      7. | 2.2 RESEARCH METHODOLOGY
      8. | | 2.2.1 Overview
      9. | | 2.2.2 Data Mining
      10. | | 2.2.3 Secondary Research
      11. | | 2.2.4 Primary Research
      12. | | | 2.2.4.1 Primary Interviews and Information Gathering Process
      13. | | | 2.2.4.2 Breakdown of Primary Respondents
      14. | | 2.2.5 Forecasting Model
      15. | | 2.2.6 Market Size Estimation
      16. | | | 2.2.6.1 Bottom-Up Approach
      17. | | | 2.2.6.2 Top-Down Approach
      18. | | 2.2.7 Data Triangulation
      19. | | 2.2.8 Validation
    3. SECTION III: QUALITATIVE ANALYSIS
      1. | 3.1 MARKET DYNAMICS
      2. | | 3.1.1 Overview
      3. | | 3.1.2 Drivers
      4. | | 3.1.3 Restraints
      5. | | 3.1.4 Opportunities
      6. | 3.2 MARKET FACTOR ANALYSIS
      7. | | 3.2.1 Value chain Analysis
      8. | | 3.2.2 Porter's Five Forces Analysis
      9. | | | 3.2.2.1 Bargaining Power of Suppliers
      10. | | | 3.2.2.2 Bargaining Power of Buyers
      11. | | | 3.2.2.3 Threat of New Entrants
      12. | | | 3.2.2.4 Threat of Substitutes
      13. | | | 3.2.2.5 Intensity of Rivalry
      14. | | 3.2.3 COVID-19 Impact Analysis
      15. | | | 3.2.3.1 Market Impact Analysis
      16. | | | 3.2.3.2 Regional Impact
      17. | | | 3.2.3.3 Opportunity and Threat Analysis
    4. SECTION IV: QUANTITATIVE ANALYSIS
      1. | 4.1 Chemicals and Materials, BY Type (USD Billion)
      2. | | 4.1.1 polyethylene
      3. | | 4.1.2 polypropylene
      4. | | 4.1.3 ethylene propylene diene monomer
      5. | 4.2 Chemicals and Materials, BY Manufacturing Method (USD Billion)
      6. | | 4.2.1 injection molding
      7. | | 4.2.2 extrusion molding
      8. | | 4.2.3 blow molding
      9. | | 4.2.4 cast and blown film extrusion
      10. | | 4.2.5 foam and calendaring
      11. | 4.3 Chemicals and Materials, BY Application (USD Billion)
      12. | | 4.3.1 adhesives
      13. | | 4.3.2 molded rubber goods
      14. | | 4.3.3 wires & cables
      15. | | 4.3.4 automotive interiors
      16. | | 4.3.5 films
      17. | | 4.3.6 medical equipment
      18. | | 4.3.7 others
      19. | 4.4 Chemicals and Materials, BY End-Use Industry (USD Billion)
      20. | | 4.4.1 automotive
      21. | | 4.4.2 consumer goods
      22. | | 4.4.3 packaging
      23. | | 4.4.4 electrical and electronics
      24. | | 4.4.5 others
      25. | 4.5 Chemicals and Materials, BY Region (USD Billion)
      26. | | 4.5.1 North America
      27. | | | 4.5.1.1 US
      28. | | | 4.5.1.2 Canada
      29. | | 4.5.2 Europe
      30. | | | 4.5.2.1 Germany
      31. | | | 4.5.2.2 UK
      32. | | | 4.5.2.3 France
      33. | | | 4.5.2.4 Russia
      34. | | | 4.5.2.5 Italy
      35. | | | 4.5.2.6 Spain
      36. | | | 4.5.2.7 Rest of Europe
      37. | | 4.5.3 APAC
      38. | | | 4.5.3.1 China
      39. | | | 4.5.3.2 India
      40. | | | 4.5.3.3 Japan
      41. | | | 4.5.3.4 South Korea
      42. | | | 4.5.3.5 Malaysia
      43. | | | 4.5.3.6 Thailand
      44. | | | 4.5.3.7 Indonesia
      45. | | | 4.5.3.8 Rest of APAC
      46. | | 4.5.4 South America
      47. | | | 4.5.4.1 Brazil
      48. | | | 4.5.4.2 Mexico
      49. | | | 4.5.4.3 Argentina
      50. | | | 4.5.4.4 Rest of South America
      51. | | 4.5.5 MEA
      52. | | | 4.5.5.1 GCC Countries
      53. | | | 4.5.5.2 South Africa
      54. | | | 4.5.5.3 Rest of MEA
    5. SECTION V: COMPETITIVE ANALYSIS
      1. | 5.1 Competitive Landscape
      2. | | 5.1.1 Overview
      3. | | 5.1.2 Competitive Analysis
      4. | | 5.1.3 Market share Analysis
      5. | | 5.1.4 Major Growth Strategy in the Chemicals and Materials
      6. | | 5.1.5 Competitive Benchmarking
      7. | | 5.1.6 Leading Players in Terms of Number of Developments in the Chemicals and Materials
      8. | | 5.1.7 Key developments and growth strategies
      9. | | | 5.1.7.1 New Product Launch/Service Deployment
      10. | | | 5.1.7.2 Merger & Acquisitions
      11. | | | 5.1.7.3 Joint Ventures
      12. | | 5.1.8 Major Players Financial Matrix
      13. | | | 5.1.8.1 Sales and Operating Income
      14. | | | 5.1.8.2 Major Players R&D Expenditure. 2023
      15. | 5.2 Company Profiles
      16. | | 5.2.1 Dow (US)
      17. | | | 5.2.1.1 Financial Overview
      18. | | | 5.2.1.2 Products Offered
      19. | | | 5.2.1.3 Key Developments
      20. | | | 5.2.1.4 SWOT Analysis
      21. | | | 5.2.1.5 Key Strategies
      22. | | 5.2.2 ExxonMobil (US)
      23. | | | 5.2.2.1 Financial Overview
      24. | | | 5.2.2.2 Products Offered
      25. | | | 5.2.2.3 Key Developments
      26. | | | 5.2.2.4 SWOT Analysis
      27. | | | 5.2.2.5 Key Strategies
      28. | | 5.2.3 LyondellBasell (US)
      29. | | | 5.2.3.1 Financial Overview
      30. | | | 5.2.3.2 Products Offered
      31. | | | 5.2.3.3 Key Developments
      32. | | | 5.2.3.4 SWOT Analysis
      33. | | | 5.2.3.5 Key Strategies
      34. | | 5.2.4 Mitsui Chemicals (JP)
      35. | | | 5.2.4.1 Financial Overview
      36. | | | 5.2.4.2 Products Offered
      37. | | | 5.2.4.3 Key Developments
      38. | | | 5.2.4.4 SWOT Analysis
      39. | | | 5.2.4.5 Key Strategies
      40. | | 5.2.5 SABIC (SA)
      41. | | | 5.2.5.1 Financial Overview
      42. | | | 5.2.5.2 Products Offered
      43. | | | 5.2.5.3 Key Developments
      44. | | | 5.2.5.4 SWOT Analysis
      45. | | | 5.2.5.5 Key Strategies
      46. | | 5.2.6 BASF (DE)
      47. | | | 5.2.6.1 Financial Overview
      48. | | | 5.2.6.2 Products Offered
      49. | | | 5.2.6.3 Key Developments
      50. | | | 5.2.6.4 SWOT Analysis
      51. | | | 5.2.6.5 Key Strategies
      52. | | 5.2.7 Kraton Corporation (US)
      53. | | | 5.2.7.1 Financial Overview
      54. | | | 5.2.7.2 Products Offered
      55. | | | 5.2.7.3 Key Developments
      56. | | | 5.2.7.4 SWOT Analysis
      57. | | | 5.2.7.5 Key Strategies
      58. | | 5.2.8 LG Chem (KR)
      59. | | | 5.2.8.1 Financial Overview
      60. | | | 5.2.8.2 Products Offered
      61. | | | 5.2.8.3 Key Developments
      62. | | | 5.2.8.4 SWOT Analysis
      63. | | | 5.2.8.5 Key Strategies
      64. | | 5.2.9 TotalEnergies (FR)
      65. | | | 5.2.9.1 Financial Overview
      66. | | | 5.2.9.2 Products Offered
      67. | | | 5.2.9.3 Key Developments
      68. | | | 5.2.9.4 SWOT Analysis
      69. | | | 5.2.9.5 Key Strategies
      70. | 5.3 Appendix
      71. | | 5.3.1 References
      72. | | 5.3.2 Related Reports
    6. LIST OF FIGURES
      1. | 6.1 MARKET SYNOPSIS
      2. | 6.2 NORTH AMERICA MARKET ANALYSIS
      3. | 6.3 US MARKET ANALYSIS BY TYPE
      4. | 6.4 US MARKET ANALYSIS BY MANUFACTURING METHOD
      5. | 6.5 US MARKET ANALYSIS BY APPLICATION
      6. | 6.6 US MARKET ANALYSIS BY END-USE INDUSTRY
      7. | 6.7 CANADA MARKET ANALYSIS BY TYPE
      8. | 6.8 CANADA MARKET ANALYSIS BY MANUFACTURING METHOD
      9. | 6.9 CANADA MARKET ANALYSIS BY APPLICATION
      10. | 6.10 CANADA MARKET ANALYSIS BY END-USE INDUSTRY
      11. | 6.11 EUROPE MARKET ANALYSIS
      12. | 6.12 GERMANY MARKET ANALYSIS BY TYPE
      13. | 6.13 GERMANY MARKET ANALYSIS BY MANUFACTURING METHOD
      14. | 6.14 GERMANY MARKET ANALYSIS BY APPLICATION
      15. | 6.15 GERMANY MARKET ANALYSIS BY END-USE INDUSTRY
      16. | 6.16 UK MARKET ANALYSIS BY TYPE
      17. | 6.17 UK MARKET ANALYSIS BY MANUFACTURING METHOD
      18. | 6.18 UK MARKET ANALYSIS BY APPLICATION
      19. | 6.19 UK MARKET ANALYSIS BY END-USE INDUSTRY
      20. | 6.20 FRANCE MARKET ANALYSIS BY TYPE
      21. | 6.21 FRANCE MARKET ANALYSIS BY MANUFACTURING METHOD
      22. | 6.22 FRANCE MARKET ANALYSIS BY APPLICATION
      23. | 6.23 FRANCE MARKET ANALYSIS BY END-USE INDUSTRY
      24. | 6.24 RUSSIA MARKET ANALYSIS BY TYPE
      25. | 6.25 RUSSIA MARKET ANALYSIS BY MANUFACTURING METHOD
      26. | 6.26 RUSSIA MARKET ANALYSIS BY APPLICATION
      27. | 6.27 RUSSIA MARKET ANALYSIS BY END-USE INDUSTRY
      28. | 6.28 ITALY MARKET ANALYSIS BY TYPE
      29. | 6.29 ITALY MARKET ANALYSIS BY MANUFACTURING METHOD
      30. | 6.30 ITALY MARKET ANALYSIS BY APPLICATION
      31. | 6.31 ITALY MARKET ANALYSIS BY END-USE INDUSTRY
      32. | 6.32 SPAIN MARKET ANALYSIS BY TYPE
      33. | 6.33 SPAIN MARKET ANALYSIS BY MANUFACTURING METHOD
      34. | 6.34 SPAIN MARKET ANALYSIS BY APPLICATION
      35. | 6.35 SPAIN MARKET ANALYSIS BY END-USE INDUSTRY
      36. | 6.36 REST OF EUROPE MARKET ANALYSIS BY TYPE
      37. | 6.37 REST OF EUROPE MARKET ANALYSIS BY MANUFACTURING METHOD
      38. | 6.38 REST OF EUROPE MARKET ANALYSIS BY APPLICATION
      39. | 6.39 REST OF EUROPE MARKET ANALYSIS BY END-USE INDUSTRY
      40. | 6.40 APAC MARKET ANALYSIS
      41. | 6.41 CHINA MARKET ANALYSIS BY TYPE
      42. | 6.42 CHINA MARKET ANALYSIS BY MANUFACTURING METHOD
      43. | 6.43 CHINA MARKET ANALYSIS BY APPLICATION
      44. | 6.44 CHINA MARKET ANALYSIS BY END-USE INDUSTRY
      45. | 6.45 INDIA MARKET ANALYSIS BY TYPE
      46. | 6.46 INDIA MARKET ANALYSIS BY MANUFACTURING METHOD
      47. | 6.47 INDIA MARKET ANALYSIS BY APPLICATION
      48. | 6.48 INDIA MARKET ANALYSIS BY END-USE INDUSTRY
      49. | 6.49 JAPAN MARKET ANALYSIS BY TYPE
      50. | 6.50 JAPAN MARKET ANALYSIS BY MANUFACTURING METHOD
      51. | 6.51 JAPAN MARKET ANALYSIS BY APPLICATION
      52. | 6.52 JAPAN MARKET ANALYSIS BY END-USE INDUSTRY
      53. | 6.53 SOUTH KOREA MARKET ANALYSIS BY TYPE
      54. | 6.54 SOUTH KOREA MARKET ANALYSIS BY MANUFACTURING METHOD
      55. | 6.55 SOUTH KOREA MARKET ANALYSIS BY APPLICATION
      56. | 6.56 SOUTH KOREA MARKET ANALYSIS BY END-USE INDUSTRY
      57. | 6.57 MALAYSIA MARKET ANALYSIS BY TYPE
      58. | 6.58 MALAYSIA MARKET ANALYSIS BY MANUFACTURING METHOD
      59. | 6.59 MALAYSIA MARKET ANALYSIS BY APPLICATION
      60. | 6.60 MALAYSIA MARKET ANALYSIS BY END-USE INDUSTRY
      61. | 6.61 THAILAND MARKET ANALYSIS BY TYPE
      62. | 6.62 THAILAND MARKET ANALYSIS BY MANUFACTURING METHOD
      63. | 6.63 THAILAND MARKET ANALYSIS BY APPLICATION
      64. | 6.64 THAILAND MARKET ANALYSIS BY END-USE INDUSTRY
      65. | 6.65 INDONESIA MARKET ANALYSIS BY TYPE
      66. | 6.66 INDONESIA MARKET ANALYSIS BY MANUFACTURING METHOD
      67. | 6.67 INDONESIA MARKET ANALYSIS BY APPLICATION
      68. | 6.68 INDONESIA MARKET ANALYSIS BY END-USE INDUSTRY
      69. | 6.69 REST OF APAC MARKET ANALYSIS BY TYPE
      70. | 6.70 REST OF APAC MARKET ANALYSIS BY MANUFACTURING METHOD
      71. | 6.71 REST OF APAC MARKET ANALYSIS BY APPLICATION
      72. | 6.72 REST OF APAC MARKET ANALYSIS BY END-USE INDUSTRY
      73. | 6.73 SOUTH AMERICA MARKET ANALYSIS
      74. | 6.74 BRAZIL MARKET ANALYSIS BY TYPE
      75. | 6.75 BRAZIL MARKET ANALYSIS BY MANUFACTURING METHOD
      76. | 6.76 BRAZIL MARKET ANALYSIS BY APPLICATION
      77. | 6.77 BRAZIL MARKET ANALYSIS BY END-USE INDUSTRY
      78. | 6.78 MEXICO MARKET ANALYSIS BY TYPE
      79. | 6.79 MEXICO MARKET ANALYSIS BY MANUFACTURING METHOD
      80. | 6.80 MEXICO MARKET ANALYSIS BY APPLICATION
      81. | 6.81 MEXICO MARKET ANALYSIS BY END-USE INDUSTRY
      82. | 6.82 ARGENTINA MARKET ANALYSIS BY TYPE
      83. | 6.83 ARGENTINA MARKET ANALYSIS BY MANUFACTURING METHOD
      84. | 6.84 ARGENTINA MARKET ANALYSIS BY APPLICATION
      85. | 6.85 ARGENTINA MARKET ANALYSIS BY END-USE INDUSTRY
      86. | 6.86 REST OF SOUTH AMERICA MARKET ANALYSIS BY TYPE
      87. | 6.87 REST OF SOUTH AMERICA MARKET ANALYSIS BY MANUFACTURING METHOD
      88. | 6.88 REST OF SOUTH AMERICA MARKET ANALYSIS BY APPLICATION
      89. | 6.89 REST OF SOUTH AMERICA MARKET ANALYSIS BY END-USE INDUSTRY
      90. | 6.90 MEA MARKET ANALYSIS
      91. | 6.91 GCC COUNTRIES MARKET ANALYSIS BY TYPE
      92. | 6.92 GCC COUNTRIES MARKET ANALYSIS BY MANUFACTURING METHOD
      93. | 6.93 GCC COUNTRIES MARKET ANALYSIS BY APPLICATION
      94. | 6.94 GCC COUNTRIES MARKET ANALYSIS BY END-USE INDUSTRY
      95. | 6.95 SOUTH AFRICA MARKET ANALYSIS BY TYPE
      96. | 6.96 SOUTH AFRICA MARKET ANALYSIS BY MANUFACTURING METHOD
      97. | 6.97 SOUTH AFRICA MARKET ANALYSIS BY APPLICATION
      98. | 6.98 SOUTH AFRICA MARKET ANALYSIS BY END-USE INDUSTRY
      99. | 6.99 REST OF MEA MARKET ANALYSIS BY TYPE
      100. | 6.100 REST OF MEA MARKET ANALYSIS BY MANUFACTURING METHOD
      101. | 6.101 REST OF MEA MARKET ANALYSIS BY APPLICATION
      102. | 6.102 REST OF MEA MARKET ANALYSIS BY END-USE INDUSTRY
      103. | 6.103 KEY BUYING CRITERIA OF CHEMICALS AND MATERIALS
      104. | 6.104 RESEARCH PROCESS OF MRFR
      105. | 6.105 DRO ANALYSIS OF CHEMICALS AND MATERIALS
      106. | 6.106 DRIVERS IMPACT ANALYSIS: CHEMICALS AND MATERIALS
      107. | 6.107 RESTRAINTS IMPACT ANALYSIS: CHEMICALS AND MATERIALS
      108. | 6.108 SUPPLY / VALUE CHAIN: CHEMICALS AND MATERIALS
      109. | 6.109 CHEMICALS AND MATERIALS, BY TYPE, 2024 (% SHARE)
      110. | 6.110 CHEMICALS AND MATERIALS, BY TYPE, 2024 TO 2035 (USD Billion)
      111. | 6.111 CHEMICALS AND MATERIALS, BY MANUFACTURING METHOD, 2024 (% SHARE)
      112. | 6.112 CHEMICALS AND MATERIALS, BY MANUFACTURING METHOD, 2024 TO 2035 (USD Billion)
      113. | 6.113 CHEMICALS AND MATERIALS, BY APPLICATION, 2024 (% SHARE)
      114. | 6.114 CHEMICALS AND MATERIALS, BY APPLICATION, 2024 TO 2035 (USD Billion)
      115. | 6.115 CHEMICALS AND MATERIALS, BY END-USE INDUSTRY, 2024 (% SHARE)
      116. | 6.116 CHEMICALS AND MATERIALS, BY END-USE INDUSTRY, 2024 TO 2035 (USD Billion)
      117. | 6.117 BENCHMARKING OF MAJOR COMPETITORS
    7. LIST OF TABLES
      1. | 7.1 LIST OF ASSUMPTIONS
      2. | | 7.1.1
      3. | 7.2 North America MARKET SIZE ESTIMATES; FORECAST
      4. | | 7.2.1 BY TYPE, 2025-2035 (USD Billion)
      5. | | 7.2.2 BY MANUFACTURING METHOD, 2025-2035 (USD Billion)
      6. | | 7.2.3 BY APPLICATION, 2025-2035 (USD Billion)
      7. | | 7.2.4 BY END-USE INDUSTRY, 2025-2035 (USD Billion)
      8. | 7.3 US MARKET SIZE ESTIMATES; FORECAST
      9. | | 7.3.1 BY TYPE, 2025-2035 (USD Billion)
      10. | | 7.3.2 BY MANUFACTURING METHOD, 2025-2035 (USD Billion)
      11. | | 7.3.3 BY APPLICATION, 2025-2035 (USD Billion)
      12. | | 7.3.4 BY END-USE INDUSTRY, 2025-2035 (USD Billion)
      13. | 7.4 Canada MARKET SIZE ESTIMATES; FORECAST
      14. | | 7.4.1 BY TYPE, 2025-2035 (USD Billion)
      15. | | 7.4.2 BY MANUFACTURING METHOD, 2025-2035 (USD Billion)
      16. | | 7.4.3 BY APPLICATION, 2025-2035 (USD Billion)
      17. | | 7.4.4 BY END-USE INDUSTRY, 2025-2035 (USD Billion)
      18. | 7.5 Europe MARKET SIZE ESTIMATES; FORECAST
      19. | | 7.5.1 BY TYPE, 2025-2035 (USD Billion)
      20. | | 7.5.2 BY MANUFACTURING METHOD, 2025-2035 (USD Billion)
      21. | | 7.5.3 BY APPLICATION, 2025-2035 (USD Billion)
      22. | | 7.5.4 BY END-USE INDUSTRY, 2025-2035 (USD Billion)
      23. | 7.6 Germany MARKET SIZE ESTIMATES; FORECAST
      24. | | 7.6.1 BY TYPE, 2025-2035 (USD Billion)
      25. | | 7.6.2 BY MANUFACTURING METHOD, 2025-2035 (USD Billion)
      26. | | 7.6.3 BY APPLICATION, 2025-2035 (USD Billion)
      27. | | 7.6.4 BY END-USE INDUSTRY, 2025-2035 (USD Billion)
      28. | 7.7 UK MARKET SIZE ESTIMATES; FORECAST
      29. | | 7.7.1 BY TYPE, 2025-2035 (USD Billion)
      30. | | 7.7.2 BY MANUFACTURING METHOD, 2025-2035 (USD Billion)
      31. | | 7.7.3 BY APPLICATION, 2025-2035 (USD Billion)
      32. | | 7.7.4 BY END-USE INDUSTRY, 2025-2035 (USD Billion)
      33. | 7.8 France MARKET SIZE ESTIMATES; FORECAST
      34. | | 7.8.1 BY TYPE, 2025-2035 (USD Billion)
      35. | | 7.8.2 BY MANUFACTURING METHOD, 2025-2035 (USD Billion)
      36. | | 7.8.3 BY APPLICATION, 2025-2035 (USD Billion)
      37. | | 7.8.4 BY END-USE INDUSTRY, 2025-2035 (USD Billion)
      38. | 7.9 Russia MARKET SIZE ESTIMATES; FORECAST
      39. | | 7.9.1 BY TYPE, 2025-2035 (USD Billion)
      40. | | 7.9.2 BY MANUFACTURING METHOD, 2025-2035 (USD Billion)
      41. | | 7.9.3 BY APPLICATION, 2025-2035 (USD Billion)
      42. | | 7.9.4 BY END-USE INDUSTRY, 2025-2035 (USD Billion)
      43. | 7.10 Italy MARKET SIZE ESTIMATES; FORECAST
      44. | | 7.10.1 BY TYPE, 2025-2035 (USD Billion)
      45. | | 7.10.2 BY MANUFACTURING METHOD, 2025-2035 (USD Billion)
      46. | | 7.10.3 BY APPLICATION, 2025-2035 (USD Billion)
      47. | | 7.10.4 BY END-USE INDUSTRY, 2025-2035 (USD Billion)
      48. | 7.11 Spain MARKET SIZE ESTIMATES; FORECAST
      49. | | 7.11.1 BY TYPE, 2025-2035 (USD Billion)
      50. | | 7.11.2 BY MANUFACTURING METHOD, 2025-2035 (USD Billion)
      51. | | 7.11.3 BY APPLICATION, 2025-2035 (USD Billion)
      52. | | 7.11.4 BY END-USE INDUSTRY, 2025-2035 (USD Billion)
      53. | 7.12 Rest of Europe MARKET SIZE ESTIMATES; FORECAST
      54. | | 7.12.1 BY TYPE, 2025-2035 (USD Billion)
      55. | | 7.12.2 BY MANUFACTURING METHOD, 2025-2035 (USD Billion)
      56. | | 7.12.3 BY APPLICATION, 2025-2035 (USD Billion)
      57. | | 7.12.4 BY END-USE INDUSTRY, 2025-2035 (USD Billion)
      58. | 7.13 APAC MARKET SIZE ESTIMATES; FORECAST
      59. | | 7.13.1 BY TYPE, 2025-2035 (USD Billion)
      60. | | 7.13.2 BY MANUFACTURING METHOD, 2025-2035 (USD Billion)
      61. | | 7.13.3 BY APPLICATION, 2025-2035 (USD Billion)
      62. | | 7.13.4 BY END-USE INDUSTRY, 2025-2035 (USD Billion)
      63. | 7.14 China MARKET SIZE ESTIMATES; FORECAST
      64. | | 7.14.1 BY TYPE, 2025-2035 (USD Billion)
      65. | | 7.14.2 BY MANUFACTURING METHOD, 2025-2035 (USD Billion)
      66. | | 7.14.3 BY APPLICATION, 2025-2035 (USD Billion)
      67. | | 7.14.4 BY END-USE INDUSTRY, 2025-2035 (USD Billion)
      68. | 7.15 India MARKET SIZE ESTIMATES; FORECAST
      69. | | 7.15.1 BY TYPE, 2025-2035 (USD Billion)
      70. | | 7.15.2 BY MANUFACTURING METHOD, 2025-2035 (USD Billion)
      71. | | 7.15.3 BY APPLICATION, 2025-2035 (USD Billion)
      72. | | 7.15.4 BY END-USE INDUSTRY, 2025-2035 (USD Billion)
      73. | 7.16 Japan MARKET SIZE ESTIMATES; FORECAST
      74. | | 7.16.1 BY TYPE, 2025-2035 (USD Billion)
      75. | | 7.16.2 BY MANUFACTURING METHOD, 2025-2035 (USD Billion)
      76. | | 7.16.3 BY APPLICATION, 2025-2035 (USD Billion)
      77. | | 7.16.4 BY END-USE INDUSTRY, 2025-2035 (USD Billion)
      78. | 7.17 South Korea MARKET SIZE ESTIMATES; FORECAST
      79. | | 7.17.1 BY TYPE, 2025-2035 (USD Billion)
      80. | | 7.17.2 BY MANUFACTURING METHOD, 2025-2035 (USD Billion)
      81. | | 7.17.3 BY APPLICATION, 2025-2035 (USD Billion)
      82. | | 7.17.4 BY END-USE INDUSTRY, 2025-2035 (USD Billion)
      83. | 7.18 Malaysia MARKET SIZE ESTIMATES; FORECAST
      84. | | 7.18.1 BY TYPE, 2025-2035 (USD Billion)
      85. | | 7.18.2 BY MANUFACTURING METHOD, 2025-2035 (USD Billion)
      86. | | 7.18.3 BY APPLICATION, 2025-2035 (USD Billion)
      87. | | 7.18.4 BY END-USE INDUSTRY, 2025-2035 (USD Billion)
      88. | 7.19 Thailand MARKET SIZE ESTIMATES; FORECAST
      89. | | 7.19.1 BY TYPE, 2025-2035 (USD Billion)
      90. | | 7.19.2 BY MANUFACTURING METHOD, 2025-2035 (USD Billion)
      91. | | 7.19.3 BY APPLICATION, 2025-2035 (USD Billion)
      92. | | 7.19.4 BY END-USE INDUSTRY, 2025-2035 (USD Billion)
      93. | 7.20 Indonesia MARKET SIZE ESTIMATES; FORECAST
      94. | | 7.20.1 BY TYPE, 2025-2035 (USD Billion)
      95. | | 7.20.2 BY MANUFACTURING METHOD, 2025-2035 (USD Billion)
      96. | | 7.20.3 BY APPLICATION, 2025-2035 (USD Billion)
      97. | | 7.20.4 BY END-USE INDUSTRY, 2025-2035 (USD Billion)
      98. | 7.21 Rest of APAC MARKET SIZE ESTIMATES; FORECAST
      99. | | 7.21.1 BY TYPE, 2025-2035 (USD Billion)
      100. | | 7.21.2 BY MANUFACTURING METHOD, 2025-2035 (USD Billion)
      101. | | 7.21.3 BY APPLICATION, 2025-2035 (USD Billion)
      102. | | 7.21.4 BY END-USE INDUSTRY, 2025-2035 (USD Billion)
      103. | 7.22 South America MARKET SIZE ESTIMATES; FORECAST
      104. | | 7.22.1 BY TYPE, 2025-2035 (USD Billion)
      105. | | 7.22.2 BY MANUFACTURING METHOD, 2025-2035 (USD Billion)
      106. | | 7.22.3 BY APPLICATION, 2025-2035 (USD Billion)
      107. | | 7.22.4 BY END-USE INDUSTRY, 2025-2035 (USD Billion)
      108. | 7.23 Brazil MARKET SIZE ESTIMATES; FORECAST
      109. | | 7.23.1 BY TYPE, 2025-2035 (USD Billion)
      110. | | 7.23.2 BY MANUFACTURING METHOD, 2025-2035 (USD Billion)
      111. | | 7.23.3 BY APPLICATION, 2025-2035 (USD Billion)
      112. | | 7.23.4 BY END-USE INDUSTRY, 2025-2035 (USD Billion)
      113. | 7.24 Mexico MARKET SIZE ESTIMATES; FORECAST
      114. | | 7.24.1 BY TYPE, 2025-2035 (USD Billion)
      115. | | 7.24.2 BY MANUFACTURING METHOD, 2025-2035 (USD Billion)
      116. | | 7.24.3 BY APPLICATION, 2025-2035 (USD Billion)
      117. | | 7.24.4 BY END-USE INDUSTRY, 2025-2035 (USD Billion)
      118. | 7.25 Argentina MARKET SIZE ESTIMATES; FORECAST
      119. | | 7.25.1 BY TYPE, 2025-2035 (USD Billion)
      120. | | 7.25.2 BY MANUFACTURING METHOD, 2025-2035 (USD Billion)
      121. | | 7.25.3 BY APPLICATION, 2025-2035 (USD Billion)
      122. | | 7.25.4 BY END-USE INDUSTRY, 2025-2035 (USD Billion)
      123. | 7.26 Rest of South America MARKET SIZE ESTIMATES; FORECAST
      124. | | 7.26.1 BY TYPE, 2025-2035 (USD Billion)
      125. | | 7.26.2 BY MANUFACTURING METHOD, 2025-2035 (USD Billion)
      126. | | 7.26.3 BY APPLICATION, 2025-2035 (USD Billion)
      127. | | 7.26.4 BY END-USE INDUSTRY, 2025-2035 (USD Billion)
      128. | 7.27 MEA MARKET SIZE ESTIMATES; FORECAST
      129. | | 7.27.1 BY TYPE, 2025-2035 (USD Billion)
      130. | | 7.27.2 BY MANUFACTURING METHOD, 2025-2035 (USD Billion)
      131. | | 7.27.3 BY APPLICATION, 2025-2035 (USD Billion)
      132. | | 7.27.4 BY END-USE INDUSTRY, 2025-2035 (USD Billion)
      133. | 7.28 GCC Countries MARKET SIZE ESTIMATES; FORECAST
      134. | | 7.28.1 BY TYPE, 2025-2035 (USD Billion)
      135. | | 7.28.2 BY MANUFACTURING METHOD, 2025-2035 (USD Billion)
      136. | | 7.28.3 BY APPLICATION, 2025-2035 (USD Billion)
      137. | | 7.28.4 BY END-USE INDUSTRY, 2025-2035 (USD Billion)
      138. | 7.29 South Africa MARKET SIZE ESTIMATES; FORECAST
      139. | | 7.29.1 BY TYPE, 2025-2035 (USD Billion)
      140. | | 7.29.2 BY MANUFACTURING METHOD, 2025-2035 (USD Billion)
      141. | | 7.29.3 BY APPLICATION, 2025-2035 (USD Billion)
      142. | | 7.29.4 BY END-USE INDUSTRY, 2025-2035 (USD Billion)
      143. | 7.30 Rest of MEA MARKET SIZE ESTIMATES; FORECAST
      144. | | 7.30.1 BY TYPE, 2025-2035 (USD Billion)
      145. | | 7.30.2 BY MANUFACTURING METHOD, 2025-2035 (USD Billion)
      146. | | 7.30.3 BY APPLICATION, 2025-2035 (USD Billion)
      147. | | 7.30.4 BY END-USE INDUSTRY, 2025-2035 (USD Billion)
      148. | 7.31 PRODUCT LAUNCH/PRODUCT DEVELOPMENT/APPROVAL
      149. | | 7.31.1
      150. | 7.32 ACQUISITION/PARTNERSHIP
      151. | | 7.32.1

    Polyolefin Elastomers Market Segmentation

    Market Segmentation Overview

    • Detailed segmentation data will be available in the full report
    • Comprehensive analysis by multiple parameters
    • Regional and country-level breakdowns
    • Market size forecasts by segment
    Infographic

    Free Sample Request

    Kindly complete the form below to receive a free sample of this Report

    Get Free Sample

    Customer Strories

    “I am very pleased with how market segments have been defined in a relevant way for my purposes (such as "Portable Freezers & refrigerators" and "last-mile"). In general the report is well structured. Thanks very much for your efforts.”

    Victoria Milne

    Founder
    Case Study
    Chemicals and Materials

    Compare Licence

    ×
    Features License Type
    Single User Multiuser License Enterprise User
    Price $4,950 $5,950 $7,250
    Maximum User Access Limit 1 User Upto 10 Users Unrestricted Access Throughout the Organization
    Free Customization
    Direct Access to Analyst
    Deliverable Format
    Platform Access
    Discount on Next Purchase 10% 15% 15%
    Printable Versions