• Cat-intel
  • MedIntelliX
  • Resources
  • About Us
  • Hero Background
    English
    Chinese
    French
    Japanese
    Korean
    German
    Spanish

    Photonic Crystals Market Size

    ID: MRFR/SEM/11082-HCR
    128 Pages
    Ankit Gupta
    October 2025

    Photonic Crystals Market Research Report Information By Type (1-D Photonic Crystals, 2-D Photonic Crystals, and 3-D Photonic Crystals), By Application (Optical Fiber, LED, Image Sensor, Solar & PV Cell, Laser, Discrete & Integrated Optical Component, Others), By End User (Industrial, Aerospace & Defense, Life Sciences & Healthcare, Others), And By Region (North America, Europe, ...

    Share:
    Download PDF ×

    We do not share your information with anyone. However, we may send you emails based on your report interest from time to time. You may contact us at any time to opt-out.

    Photonic Crystals Market Infographic
    Purchase Options

    Photonic Crystals Size

    Photonic Crystals Market Growth Projections and Opportunities

    The Photonic Crystals market is influenced by a myriad of market factors that play a pivotal role in shaping its dynamics. One of the key drivers propelling the growth of this market is the increasing demand for advanced technologies in various industries. Photonic crystals, with their unique optical properties, find applications in telecommunications, healthcare, and sensing technologies, driving the market forward. The relentless pursuit of faster and more efficient communication systems has also contributed to the market's expansion, as photonic crystals play a crucial role in the development of high-speed data transmission.

    Moreover, the growing awareness and emphasis on renewable energy sources have stimulated the demand for photonic crystals in the solar energy sector. These crystals are employed to enhance the efficiency of solar cells, making them a vital component in the renewable energy landscape. As governments worldwide push for sustainable practices, the Photonic Crystals market stands to benefit from increased investments in renewable energy projects.

    On the flip side, market growth is not immune to challenges, and one such factor is the high initial cost associated with the production of photonic crystals. The manufacturing process involves sophisticated technologies, leading to elevated production costs. However, as technology matures and economies of scale come into play, it is anticipated that the costs will gradually decrease, making photonic crystals more accessible and affordable.

    Global economic conditions also exert a significant influence on the Photonic Crystals market. Economic downturns can impact investments in research and development, potentially slowing down innovations in the field. Conversely, during periods of economic prosperity, there tends to be increased spending on technology and infrastructure, which can positively impact the market.

    Regulatory factors also shape the landscape of the Photonic Crystals market. Stringent regulations pertaining to environmental standards and safety can influence the adoption of photonic crystals in various industries. Compliance with these regulations is crucial for market players to ensure a smooth and sustainable business operation.

    Furthermore, the competitive landscape and technological advancements play a pivotal role in determining the trajectory of the Photonic Crystals market. Companies engaged in the production and development of photonic crystals constantly strive to stay ahead in the race by investing in research and innovation. The ability to bring cutting-edge products to the market gives companies a competitive edge, influencing their market position and growth.

    The global nature of the Photonic Crystals market means that geopolitical factors also contribute to its dynamics. Trade policies, international collaborations, and geopolitical tensions can impact the supply chain and market access for companies operating in this space. Adapting to these changes and fostering international partnerships becomes crucial for sustained growth in the Photonic Crystals market.
    Photonic Crystals Market Size Graph
    Author
    Ankit Gupta
    Senior Research Analyst

    Ankit Gupta is an analyst in market research industry in ICT and SEMI industry. With post-graduation in "Telecom and Marketing Management" and graduation in "Electronics and Telecommunication" vertical he is well versed with recent development in ICT industry as a whole. Having worked on more than 150+ reports including consultation for fortune 500 companies such as Microsoft and Rio Tinto in identifying solutions with respect to business problems his opinions are inclined towards mixture of technical and managerial aspects.

    Leave a Comment

    FAQs

    How much is the Photonic Crystals market?

    The Photonic Crystals Market size was valued at USD 69.11 billion in 2024.

    What is the growth rate of the Photonic Crystals market?

    The global market is projected to grow at a CAGR of 8.50% during the forecast period, 2025 to 2035.

    Which region held the largest market share in the Photonic Crystals market?

    North America had the largest share of the global market

    Who are the key players in the Photonic Crystals market?

    The key players in the market are OPALUX INC., IPG PHOTONICS CORPORATION, CORNING INCORPORATED, NEOPHOTONICS CORPORATION, FURUKAWA ELECTRIC CO. LTD., NKT PHOTONICS A/S, GLOPHOTONICS SAS, PHOTEON TECHNOLOGIES GMBH, PHOTONIC LATTICE INC., DK PHOTONICS.

    Which Type led the Photonic Crystals market?

    The 2-D Photonic Crystals category dominated the market in 2022.

    Which application had the largest market share in the Photonic Crystals market?

    The LED had the largest share in the global market.

    Market Summary

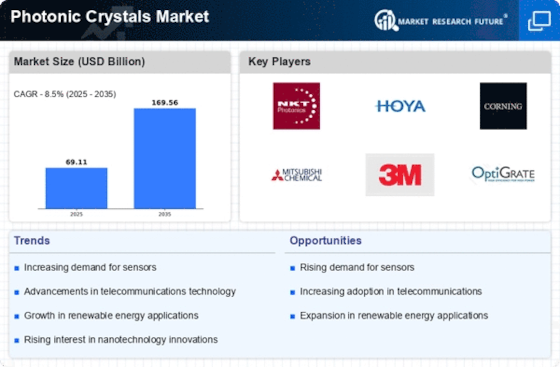
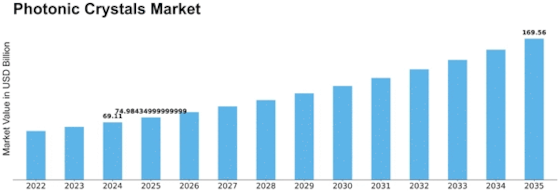
    The Global Photonic Crystals Market is projected to grow from 69.11 USD Billion in 2024 to 169.56 USD Billion by 2035, reflecting a robust growth trajectory.

    Key Market Trends & Highlights

    Photonic Crystals Key Trends and Highlights

    • The market is expected to achieve a compound annual growth rate (CAGR) of 8.5 percent from 2025 to 2035.
    • By 2035, the market valuation is anticipated to reach 169.6 USD Billion, indicating substantial growth opportunities.
    • in 2024, the market is valued at 69.11 USD Billion, highlighting its current economic significance.
    • Growing adoption of advanced optical technologies due to increasing demand for efficient light management is a major market driver.

    Market Size & Forecast

    2024 Market Size 69.11 (USD Billion)
    2035 Market Size 169.56 (USD Billion)
    CAGR (2025-2035) 8.50%
    Largest Regional Market Share in 2024 latin_america)

    Major Players

    OPALUX INC., IPG PHOTONICS CORPORATION, CORNING INCORPORATED, NEOPHOTONICS CORPORATION, FURUKAWA ELECTRIC CO. LTD., NKT PHOTONICS A/S, GLOPHOTONICS SAS, PHOTEON TECHNOLOGIES GMBH, PHOTONIC LATTICE INC., DK PHOTONICS

    Market Trends

    Rising penetration of optical telecommunications is anticipated for market growth

    Market CAGR for photonic crystals is growing due to its components such as highly efficient and compact optical components, such as waveguides, filters, and modulators. These components are crucial for the fast and reliable transmission of data in optical communication networks. The demand for high-speed data transfer is continually increasing with the proliferation of data-intensive applications and services.

    Supported by organizations such as the Optical Society (OSA), ongoing research and development in photonic crystals are enabling the design of advanced telecommunications equipment that can meet the growing demand for faster and more reliable data transmission, making photonic crystals an essential technology for the modern telecommunications industry. Thus, driving the photonic crystals market revenue.

    In addition, photonic crystals are their utilization in sensors across various sectors, including environmental monitoring, healthcare, and industrial process control. Photonic crystals enable the development of highly sensitive and selective sensors due to their ability to manipulate and control light. These sensors can be tailored to detect specific substances or environmental conditions with exceptional precision. Organizations like the International Society for Optical Engineering (SPIE) actively promote research and innovation in photonic sensors.

    As environmental concerns and healthcare requirements continue to evolve, photonic crystal-based sensors are poised to play a pivotal role in addressing these challenges and driving market growth in the sensor industry.

    Moreover, photovoltaic sector is also experiencing the positive influence of photonic crystals, which can enhance the efficiency of solar cells by improving light absorption and trapping mechanisms. As the world looks for sustainable energy solutions, photovoltaics have gained prominence. The use of photonic crystals to enhance the efficiency of solar cells is supported by organizations such as the Solar Energy Industries Association (SEIA). This support and ongoing research efforts make photonic crystals a promising technology in the renewable energy sector, contributing to the growth of the photovoltaics market.

    Photonic Crystals Market Segment Insights

    Photonic Crystals Type

    The Photonic Crystals Market segmentation, based on Type includes 1-D Photonic Crystals, 2-D Photonic Crystals, and 3-D Photonic Crystals. The 2-D Photonic Crystals segment dominated the market 2022, due to the rising penetration photonic crystals can be used to create compact and efficient optical components such as waveguides, filters, and modulators.

    Figure 1: Photonic Crystals Market, by Type, 2022 & 2032 (USD Billion)

    Photonic Crystals Application

    The Photonic Crystals Market segmentation, based on Application, includes Optical Fiber, LED, Image Sensor, Solar & PV Cell, Laser, Discrete & Integrated Optical Component, Others. The LED category generated the most revenue in 2022. Photonic crystals can be used in the development of highly sensitive and selective sensors for various applications, including environmental monitoring, healthcare, and industrial process control.

    Photonic Crystals End User

    The Photonic Crystals Market segmentation, based on End User includes, Aerospace & Defense, Life Sciences & Healthcare, Others. The Industrial segment dominated the market in 2022 due to its Potential to improve the efficiency of solar cells by enhancing light trapping and absorption.

    The ongoing advancements in photonic crystal technology are poised to revolutionize various sectors, enhancing efficiency and performance in applications ranging from telecommunications to energy harvesting.

    U.S. Department of Energy

    Photonic Crystals Market Market Drivers

    Market Growth Projections

    The Global Photonic Crystals Market Industry is poised for substantial growth, with projections indicating a rise from 69.1 USD Billion in 2024 to 169.6 USD Billion by 2035. This growth trajectory reflects a compound annual growth rate of 8.5% from 2025 to 2035, driven by various factors including technological advancements, increasing demand for optical devices, and expanding applications across multiple sectors. The market's expansion is indicative of the broader trends in photonics and optics, as industries increasingly recognize the potential of photonic crystals to revolutionize their operations and product offerings.

    Growing Demand for Advanced Optical Devices

    The Global Photonic Crystals Market Industry is experiencing a surge in demand for advanced optical devices, driven by the increasing need for high-performance components in telecommunications and data transmission. Photonic crystals, with their ability to manipulate light at the nanoscale, are integral to the development of efficient lasers, sensors, and optical filters. As the global data traffic continues to rise, the market is projected to reach 69.1 USD Billion in 2024, reflecting a robust growth trajectory. This demand is further fueled by the expansion of 5G networks and the Internet of Things, which require innovative optical solutions to enhance connectivity and performance.

    Technological Advancements in Manufacturing

    Technological advancements in the manufacturing processes of photonic crystals are significantly influencing the Global Photonic Crystals Market Industry. Innovations such as 3D printing and nanofabrication techniques enable the production of more complex and efficient photonic structures. These advancements not only reduce production costs but also enhance the scalability of photonic crystal applications across various sectors, including consumer electronics and biomedical devices. As a result, the market is expected to grow at a CAGR of 8.5% from 2025 to 2035, indicating a strong potential for new applications and improved product offerings in the coming years.

    Increasing Adoption in Healthcare Applications

    The increasing adoption of photonic crystals in healthcare applications is a notable driver for the Global Photonic Crystals Market Industry. Photonic crystal-based devices are being utilized for advanced imaging techniques, biosensing, and drug delivery systems, enhancing diagnostic capabilities and treatment efficacy. The ability of photonic crystals to improve the sensitivity and specificity of medical devices is particularly valuable in personalized medicine. As healthcare technology continues to evolve, the integration of photonic crystals is expected to grow, contributing to the overall market expansion and offering new opportunities for innovation in medical applications.

    Rising Investments in Research and Development

    Rising investments in research and development within the Global Photonic Crystals Market Industry are fostering innovation and expanding application areas. Governments and private entities are increasingly funding projects aimed at exploring the capabilities of photonic crystals in fields such as quantum computing, energy harvesting, and environmental monitoring. This influx of capital is likely to accelerate the pace of technological breakthroughs, leading to the introduction of novel products and solutions. As the market matures, the anticipated growth trajectory suggests that the industry could reach 169.6 USD Billion by 2035, driven by these advancements and the diversification of applications.

    Environmental Sustainability and Energy Efficiency

    Environmental sustainability and energy efficiency are becoming critical drivers in the Global Photonic Crystals Market Industry. Photonic crystals offer solutions that enhance the efficiency of solar cells and lighting systems, contributing to reduced energy consumption and lower carbon footprints. As global awareness of climate change and energy conservation increases, industries are seeking sustainable alternatives that photonic crystals can provide. This trend is likely to propel the market forward, as companies and governments alike prioritize green technologies and sustainable practices, thereby creating a favorable environment for the growth of photonic crystal applications.

    Market Segment Insights

    Regional Insights

    By region, the study provides the market insights into North America, Europe, Asia-Pacific and Rest of the World. The North American Photonic Crystals market area will dominate this market, due to the presence of many big market players including OPALUX INC., IPG PHOTONICS CORPORATION, CORNING INCORPORATED. In addition, photonic crystals can be used to create compact and efficient optical components such as waveguides, filters, and modulators. These components are essential for high-speed data transmission in optical communication networks.

    Further, the major countries studied in the market report are The US, Canada, Germany, France, the UK, Italy, Spain, China, Japan, India, Australia, South Korea, and Brazil.

    Figure 2: Photonic Crystals Market SHARE BY REGION 2022 (USD Billion)

    Photonic Crystals Market SHARE BY REGION 2022

    Source: Secondary Research, Primary Research, MRFR Database and Analyst Review

    Europe Photonic Crystals market accounts for the second-largest market share due to the rising demand for the development of highly sensitive and selective sensors for various applications, including environmental monitoring, healthcare, and industrial process control. Further, the Germany Photonic Crystals market held the largest market share, and the UK Photonic Crystals market was the fastest growing market in the European region.

    The Asia-Pacific Photonic Crystals market is expected to grow at the fastest CAGR from 2023 to 2032. This is due to the expansion of businesses into global markets. Research and development in photonic crystals continue to drive innovation in materials science and nanotechnology, creating new opportunities for applications. Moreover, China’s Photonic Crystals market held the largest market share, and the Indian Photonic Crystals market was the fastest growing market in the Asia-Pacific region.

    Key Players and Competitive Insights

    Leading market players are investing heavily in advanced technologies in order to expand their 1-D Photonic Crystals and 2-D Photonic Crystals, which will help the Photonic Crystals market, grow even more. Market participants are also undertaking a variety of strategic activities to expand their global footprint, with important market developments including new 1-D Photonic Crystals launches, contractual agreements, mergers and acquisitions, higher investments, and collaboration with other organizations. To expand and survive in a more competitive and rising market climate, photonic crystals industry must offer cost-effective 1-D Photonic Crystals.

    Developing product locally to minimize operational costs is one of the key business tactics used by key players in the global photonic crystals industry to benefit clients and increase the market sector. In recent years, the photonic crystals industry has offered some of the most significant advantages to enterprises. Major players in the Photonic Crystals market, including OPALUX INC., IPG PHOTONICS CORPORATION, CORNING INCORPORATED, NEOPHOTONICS CORPORATION, FURUKAWA ELECTRIC CO. LTD., NKT PHOTONICS A/S, GLOPHOTONICS SAS, PHOTEON TECHNOLOGIES GMBH, PHOTONIC LATTICE INC., DK PHOTONICS, and others, are attempting to increase market demand by investing in research and development operations.

    Opalux Inc. is a technology company known for its innovation in the field of photonic materials and devices. Founded with a vision to revolutionize light management, Opalux has developed a range of advanced materials and products that leverage the principles of photonic crystals and nanotechnology. Their solutions find applications in a wide array of industries, including architecture, automotive, and consumer electronics. Opalux's proprietary technology enables the dynamic control and manipulation of light, making it highly sought after for applications such as energy-efficient windows, privacy glass, and smart lighting.

    With a focus on sustainability and energy efficiency, Opalux is at the forefront of delivering cutting-edge solutions that enhance our interaction with light and improve the performance of various products and systems.

    IPG Photonics Corporation is a global leader in high-performance fiber lasers and amplifiers for diverse applications across multiple industries. Founded in 1990, the company has pioneered the development and commercialization of fiber laser technology, enabling precision, reliability, and efficiency in laser-based systems. IPG Photonics caters to a broad customer base, including manufacturers, medical device producers, and research institutions. Their lasers and amplifiers are integral components in applications such as materials processing, medical devices, and telecommunications infrastructure.

    With a strong commitment to research and development, IPG Photonics continues to innovate in photonics technology, pushing the boundaries of what laser systems can achieve while maintaining a reputation for quality and reliability in the laser industry.

    Key Companies in the Photonic Crystals Market market include

    Industry Developments

    July 2023: Hamamatsu Photonics announced its intention to acquire NKT Photonics, a leading supplier of high-performance fiber lasers and photonic crystal fibers. The acquisition is expected to strengthen Hamamatsu's Material Processing business by adding complementary know-how and products to its portfolio.

    May 2023: The Danish Business Authority blocked Hamamatsu's planned acquisition of NKT Photonics, citing national security concerns. Hamamatsu is considering further actions in response to this decision.

    Photonic Crystals Market Segmentation:

    Photonic Crystals Type

      • 1-D Photonic Crystals
      • 2-D Photonic Crystals
      • 3-D Photonic Crystals

    Photonic Crystals Application

      • Optical Fiber
      • LED
      • Image Sensor
      • Solar & PV Cell
      • Laser
      • Discrete & Integrated Optical Component
      • Others

    Photonic Crystals End User

      • Industrial
      • Aerospace & Defense
      • Life Sciences & Healthcare
      • Others

    Photonic Crystals Regional Outlook

      • North America
        • US
        • Canada
      • Europe
        • Germany
        • France
        • UK
        • Italy
        • Spain
        • Rest of Europe
      • Asia-Pacific
        • China
        • Japan
        • India
        • Australia
        • South Korea
        • Australia
        • Rest of Asia-Pacific
      • Rest of the World
        • Middle East
        • Africa
        • Latin America

    Future Outlook

    Photonic Crystals Market Future Outlook

    The Global Photonic Crystals Market is projected to grow at an 8.50% CAGR from 2025 to 2035, driven by advancements in telecommunications, energy efficiency, and biomedical applications.

    New opportunities lie in:

    • Develop innovative photonic crystal applications in telecommunications to enhance data transmission speeds.
    • Invest in energy-efficient lighting solutions utilizing photonic crystals for sustainable urban development.
    • Explore biomedical imaging technologies leveraging photonic crystals for improved diagnostic capabilities.

    By 2035, the Photonic Crystals Market is expected to exhibit robust growth, reflecting its critical role in technological advancements.

    Market Segmentation

    Photonic Crystals Regional Outlook

    North America
    • US
    • Canada

    Report Scope

    Report Attribute/Metric Details
    Market Size 2024 USD 69.10 Billion
    Market Size 2025 USD 74.98 Billion
    Market Size 2035 169.56 (Value (USD Billion))
    Compound Annual Growth Rate (CAGR) 8.50% (2025 - 2035)
    Base Year 2024
    Market Forecast Period 2025 - 2035
    Historical Data 2020- 2023
    Market Forecast Units Value (USD Billion)
    Report Coverage Revenue Forecast, Market Competitive Landscape, Growth Factors, and Trends
    Segments Covered Type, Application, End User, and Region
    Geographies Covered North America, Europe, Asia Pacific, and the Rest of the World
    Countries Covered The US, Canada, German, France, UK, Italy, Spain, China, Japan, India, Australia, South Korea, and Brazil
    Key Companies Profiled OPALUX INC., IPG PHOTONICS CORPORATION, CORNING INCORPORATED, NEOPHOTONICS CORPORATION, FURUKAWA ELECTRIC CO. LTD., NKT PHOTONICS A/S, GLOPHOTONICS SAS, PHOTEON TECHNOLOGIES GMBH, PHOTONIC LATTICE INC., DK PHOTONICS
    Key Market Opportunities ·       Rising demand for high-speed data communication
    Key Market Dynamics ·       Increasing investment in renewable energy

    FAQs

    How much is the Photonic Crystals market?

    The Photonic Crystals Market size was valued at USD 69.11 billion in 2024.

    What is the growth rate of the Photonic Crystals market?

    The global market is projected to grow at a CAGR of 8.50% during the forecast period, 2025 to 2035.

    Which region held the largest market share in the Photonic Crystals market?

    North America had the largest share of the global market

    Who are the key players in the Photonic Crystals market?

    The key players in the market are OPALUX INC., IPG PHOTONICS CORPORATION, CORNING INCORPORATED, NEOPHOTONICS CORPORATION, FURUKAWA ELECTRIC CO. LTD., NKT PHOTONICS A/S, GLOPHOTONICS SAS, PHOTEON TECHNOLOGIES GMBH, PHOTONIC LATTICE INC., DK PHOTONICS.

    Which Type led the Photonic Crystals market?

    The 2-D Photonic Crystals category dominated the market in 2022.

    Which application had the largest market share in the Photonic Crystals market?

    The LED had the largest share in the global market.

    1. SECTION I: EXECUTIVE SUMMARY AND KEY HIGHLIGHTS
      1. | 1.1 EXECUTIVE SUMMARY
      2. | | 1.1.1 Market Overview
      3. | | 1.1.2 Key Findings
      4. | | 1.1.3 Market Segmentation
      5. | | 1.1.4 Competitive Landscape
      6. | | 1.1.5 Challenges and Opportunities
      7. | | 1.1.6 Future Outlook
    2. SECTION II: SCOPING, METHODOLOGY AND MARKET STRUCTURE
      1. | 2.1 MARKET INTRODUCTION
      2. | | 2.1.1 Definition
      3. | | 2.1.2 Scope of the study
      4. | | | 2.1.2.1 Research Objective
      5. | | | 2.1.2.2 Assumption
      6. | | | 2.1.2.3 Limitations
      7. | 2.2 RESEARCH METHODOLOGY
      8. | | 2.2.1 Overview
      9. | | 2.2.2 Data Mining
      10. | | 2.2.3 Secondary Research
      11. | | 2.2.4 Primary Research
      12. | | | 2.2.4.1 Primary Interviews and Information Gathering Process
      13. | | | 2.2.4.2 Breakdown of Primary Respondents
      14. | | 2.2.5 Forecasting Model
      15. | | 2.2.6 Market Size Estimation
      16. | | | 2.2.6.1 Bottom-Up Approach
      17. | | | 2.2.6.2 Top-Down Approach
      18. | | 2.2.7 Data Triangulation
      19. | | 2.2.8 Validation
    3. SECTION III: QUALITATIVE ANALYSIS
      1. | 3.1 MARKET DYNAMICS
      2. | | 3.1.1 Overview
      3. | | 3.1.2 Drivers
      4. | | 3.1.3 Restraints
      5. | | 3.1.4 Opportunities
      6. | 3.2 MARKET FACTOR ANALYSIS
      7. | | 3.2.1 Value chain Analysis
      8. | | 3.2.2 Porter's Five Forces Analysis
      9. | | | 3.2.2.1 Bargaining Power of Suppliers
      10. | | | 3.2.2.2 Bargaining Power of Buyers
      11. | | | 3.2.2.3 Threat of New Entrants
      12. | | | 3.2.2.4 Threat of Substitutes
      13. | | | 3.2.2.5 Intensity of Rivalry
      14. | | 3.2.3 COVID-19 Impact Analysis
      15. | | | 3.2.3.1 Market Impact Analysis
      16. | | | 3.2.3.2 Regional Impact
      17. | | | 3.2.3.3 Opportunity and Threat Analysis
    4. SECTION IV: QUANTITATIVE ANALYSIS
      1. | 4.1 Semiconductor & Electronics, BY Type (USD Billion)
      2. | | 4.1.1 1-D Photonic Crystals
      3. | | 4.1.2 2-D Photonic Crystals
      4. | | 4.1.3 3-D Photonic Crystals
      5. | 4.2 Semiconductor & Electronics, BY Application (USD Billion)
      6. | | 4.2.1 Optical Fiber
      7. | | 4.2.2 LED
      8. | | 4.2.3 Image Sensor
      9. | | 4.2.4 Solar & PV Cell
      10. | | 4.2.5 Laser
      11. | | 4.2.6 Discrete & Integrated Optical Component
      12. | | 4.2.7 Others
      13. | 4.3 Semiconductor & Electronics, BY End User (USD Billion)
      14. | | 4.3.1 Industrial
      15. | | 4.3.2 Aerospace & Defense
      16. | | 4.3.3 Life Sciences & Healthcare
      17. | | 4.3.4 Others
      18. | 4.4 Semiconductor & Electronics, BY Region (USD Billion)
      19. | | 4.4.1 North America
      20. | | | 4.4.1.1 US
      21. | | | 4.4.1.2 Canada
      22. | | 4.4.2 Europe
      23. | | | 4.4.2.1 Germany
      24. | | | 4.4.2.2 UK
      25. | | | 4.4.2.3 France
      26. | | | 4.4.2.4 Russia
      27. | | | 4.4.2.5 Italy
      28. | | | 4.4.2.6 Spain
      29. | | | 4.4.2.7 Rest of Europe
      30. | | 4.4.3 APAC
      31. | | | 4.4.3.1 China
      32. | | | 4.4.3.2 India
      33. | | | 4.4.3.3 Japan
      34. | | | 4.4.3.4 South Korea
      35. | | | 4.4.3.5 Malaysia
      36. | | | 4.4.3.6 Thailand
      37. | | | 4.4.3.7 Indonesia
      38. | | | 4.4.3.8 Rest of APAC
      39. | | 4.4.4 South America
      40. | | | 4.4.4.1 Brazil
      41. | | | 4.4.4.2 Mexico
      42. | | | 4.4.4.3 Argentina
      43. | | | 4.4.4.4 Rest of South America
      44. | | 4.4.5 MEA
      45. | | | 4.4.5.1 GCC Countries
      46. | | | 4.4.5.2 South Africa
      47. | | | 4.4.5.3 Rest of MEA
    5. SECTION V: COMPETITIVE ANALYSIS
      1. | 5.1 Competitive Landscape
      2. | | 5.1.1 Overview
      3. | | 5.1.2 Competitive Analysis
      4. | | 5.1.3 Market share Analysis
      5. | | 5.1.4 Major Growth Strategy in the Semiconductor & Electronics
      6. | | 5.1.5 Competitive Benchmarking
      7. | | 5.1.6 Leading Players in Terms of Number of Developments in the Semiconductor & Electronics
      8. | | 5.1.7 Key developments and growth strategies
      9. | | | 5.1.7.1 New Product Launch/Service Deployment
      10. | | | 5.1.7.2 Merger & Acquisitions
      11. | | | 5.1.7.3 Joint Ventures
      12. | | 5.1.8 Major Players Financial Matrix
      13. | | | 5.1.8.1 Sales and Operating Income
      14. | | | 5.1.8.2 Major Players R&D Expenditure. 2023
      15. | 5.2 Company Profiles
      16. | | 5.2.1 NKT Photonics (DK)
      17. | | | 5.2.1.1 Financial Overview
      18. | | | 5.2.1.2 Products Offered
      19. | | | 5.2.1.3 Key Developments
      20. | | | 5.2.1.4 SWOT Analysis
      21. | | | 5.2.1.5 Key Strategies
      22. | | 5.2.2 Hoya Corporation (JP)
      23. | | | 5.2.2.1 Financial Overview
      24. | | | 5.2.2.2 Products Offered
      25. | | | 5.2.2.3 Key Developments
      26. | | | 5.2.2.4 SWOT Analysis
      27. | | | 5.2.2.5 Key Strategies
      28. | | 5.2.3 Corning Incorporated (US)
      29. | | | 5.2.3.1 Financial Overview
      30. | | | 5.2.3.2 Products Offered
      31. | | | 5.2.3.3 Key Developments
      32. | | | 5.2.3.4 SWOT Analysis
      33. | | | 5.2.3.5 Key Strategies
      34. | | 5.2.4 Mitsubishi Chemical Corporation (JP)
      35. | | | 5.2.4.1 Financial Overview
      36. | | | 5.2.4.2 Products Offered
      37. | | | 5.2.4.3 Key Developments
      38. | | | 5.2.4.4 SWOT Analysis
      39. | | | 5.2.4.5 Key Strategies
      40. | | 5.2.5 3M Company (US)
      41. | | | 5.2.5.1 Financial Overview
      42. | | | 5.2.5.2 Products Offered
      43. | | | 5.2.5.3 Key Developments
      44. | | | 5.2.5.4 SWOT Analysis
      45. | | | 5.2.5.5 Key Strategies
      46. | | 5.2.6 OptiGrate Corporation (US)
      47. | | | 5.2.6.1 Financial Overview
      48. | | | 5.2.6.2 Products Offered
      49. | | | 5.2.6.3 Key Developments
      50. | | | 5.2.6.4 SWOT Analysis
      51. | | | 5.2.6.5 Key Strategies
      52. | | 5.2.7 Lightwave Logic (US)
      53. | | | 5.2.7.1 Financial Overview
      54. | | | 5.2.7.2 Products Offered
      55. | | | 5.2.7.3 Key Developments
      56. | | | 5.2.7.4 SWOT Analysis
      57. | | | 5.2.7.5 Key Strategies
      58. | | 5.2.8 Aixtron SE (DE)
      59. | | | 5.2.8.1 Financial Overview
      60. | | | 5.2.8.2 Products Offered
      61. | | | 5.2.8.3 Key Developments
      62. | | | 5.2.8.4 SWOT Analysis
      63. | | | 5.2.8.5 Key Strategies
      64. | | 5.2.9 Soraa Inc. (US)
      65. | | | 5.2.9.1 Financial Overview
      66. | | | 5.2.9.2 Products Offered
      67. | | | 5.2.9.3 Key Developments
      68. | | | 5.2.9.4 SWOT Analysis
      69. | | | 5.2.9.5 Key Strategies
      70. | 5.3 Appendix
      71. | | 5.3.1 References
      72. | | 5.3.2 Related Reports
    6. LIST OF FIGURES
      1. | 6.1 MARKET SYNOPSIS
      2. | 6.2 NORTH AMERICA MARKET ANALYSIS
      3. | 6.3 US MARKET ANALYSIS BY TYPE
      4. | 6.4 US MARKET ANALYSIS BY APPLICATION
      5. | 6.5 US MARKET ANALYSIS BY END USER
      6. | 6.6 CANADA MARKET ANALYSIS BY TYPE
      7. | 6.7 CANADA MARKET ANALYSIS BY APPLICATION
      8. | 6.8 CANADA MARKET ANALYSIS BY END USER
      9. | 6.9 EUROPE MARKET ANALYSIS
      10. | 6.10 GERMANY MARKET ANALYSIS BY TYPE
      11. | 6.11 GERMANY MARKET ANALYSIS BY APPLICATION
      12. | 6.12 GERMANY MARKET ANALYSIS BY END USER
      13. | 6.13 UK MARKET ANALYSIS BY TYPE
      14. | 6.14 UK MARKET ANALYSIS BY APPLICATION
      15. | 6.15 UK MARKET ANALYSIS BY END USER
      16. | 6.16 FRANCE MARKET ANALYSIS BY TYPE
      17. | 6.17 FRANCE MARKET ANALYSIS BY APPLICATION
      18. | 6.18 FRANCE MARKET ANALYSIS BY END USER
      19. | 6.19 RUSSIA MARKET ANALYSIS BY TYPE
      20. | 6.20 RUSSIA MARKET ANALYSIS BY APPLICATION
      21. | 6.21 RUSSIA MARKET ANALYSIS BY END USER
      22. | 6.22 ITALY MARKET ANALYSIS BY TYPE
      23. | 6.23 ITALY MARKET ANALYSIS BY APPLICATION
      24. | 6.24 ITALY MARKET ANALYSIS BY END USER
      25. | 6.25 SPAIN MARKET ANALYSIS BY TYPE
      26. | 6.26 SPAIN MARKET ANALYSIS BY APPLICATION
      27. | 6.27 SPAIN MARKET ANALYSIS BY END USER
      28. | 6.28 REST OF EUROPE MARKET ANALYSIS BY TYPE
      29. | 6.29 REST OF EUROPE MARKET ANALYSIS BY APPLICATION
      30. | 6.30 REST OF EUROPE MARKET ANALYSIS BY END USER
      31. | 6.31 APAC MARKET ANALYSIS
      32. | 6.32 CHINA MARKET ANALYSIS BY TYPE
      33. | 6.33 CHINA MARKET ANALYSIS BY APPLICATION
      34. | 6.34 CHINA MARKET ANALYSIS BY END USER
      35. | 6.35 INDIA MARKET ANALYSIS BY TYPE
      36. | 6.36 INDIA MARKET ANALYSIS BY APPLICATION
      37. | 6.37 INDIA MARKET ANALYSIS BY END USER
      38. | 6.38 JAPAN MARKET ANALYSIS BY TYPE
      39. | 6.39 JAPAN MARKET ANALYSIS BY APPLICATION
      40. | 6.40 JAPAN MARKET ANALYSIS BY END USER
      41. | 6.41 SOUTH KOREA MARKET ANALYSIS BY TYPE
      42. | 6.42 SOUTH KOREA MARKET ANALYSIS BY APPLICATION
      43. | 6.43 SOUTH KOREA MARKET ANALYSIS BY END USER
      44. | 6.44 MALAYSIA MARKET ANALYSIS BY TYPE
      45. | 6.45 MALAYSIA MARKET ANALYSIS BY APPLICATION
      46. | 6.46 MALAYSIA MARKET ANALYSIS BY END USER
      47. | 6.47 THAILAND MARKET ANALYSIS BY TYPE
      48. | 6.48 THAILAND MARKET ANALYSIS BY APPLICATION
      49. | 6.49 THAILAND MARKET ANALYSIS BY END USER
      50. | 6.50 INDONESIA MARKET ANALYSIS BY TYPE
      51. | 6.51 INDONESIA MARKET ANALYSIS BY APPLICATION
      52. | 6.52 INDONESIA MARKET ANALYSIS BY END USER
      53. | 6.53 REST OF APAC MARKET ANALYSIS BY TYPE
      54. | 6.54 REST OF APAC MARKET ANALYSIS BY APPLICATION
      55. | 6.55 REST OF APAC MARKET ANALYSIS BY END USER
      56. | 6.56 SOUTH AMERICA MARKET ANALYSIS
      57. | 6.57 BRAZIL MARKET ANALYSIS BY TYPE
      58. | 6.58 BRAZIL MARKET ANALYSIS BY APPLICATION
      59. | 6.59 BRAZIL MARKET ANALYSIS BY END USER
      60. | 6.60 MEXICO MARKET ANALYSIS BY TYPE
      61. | 6.61 MEXICO MARKET ANALYSIS BY APPLICATION
      62. | 6.62 MEXICO MARKET ANALYSIS BY END USER
      63. | 6.63 ARGENTINA MARKET ANALYSIS BY TYPE
      64. | 6.64 ARGENTINA MARKET ANALYSIS BY APPLICATION
      65. | 6.65 ARGENTINA MARKET ANALYSIS BY END USER
      66. | 6.66 REST OF SOUTH AMERICA MARKET ANALYSIS BY TYPE
      67. | 6.67 REST OF SOUTH AMERICA MARKET ANALYSIS BY APPLICATION
      68. | 6.68 REST OF SOUTH AMERICA MARKET ANALYSIS BY END USER
      69. | 6.69 MEA MARKET ANALYSIS
      70. | 6.70 GCC COUNTRIES MARKET ANALYSIS BY TYPE
      71. | 6.71 GCC COUNTRIES MARKET ANALYSIS BY APPLICATION
      72. | 6.72 GCC COUNTRIES MARKET ANALYSIS BY END USER
      73. | 6.73 SOUTH AFRICA MARKET ANALYSIS BY TYPE
      74. | 6.74 SOUTH AFRICA MARKET ANALYSIS BY APPLICATION
      75. | 6.75 SOUTH AFRICA MARKET ANALYSIS BY END USER
      76. | 6.76 REST OF MEA MARKET ANALYSIS BY TYPE
      77. | 6.77 REST OF MEA MARKET ANALYSIS BY APPLICATION
      78. | 6.78 REST OF MEA MARKET ANALYSIS BY END USER
      79. | 6.79 KEY BUYING CRITERIA OF SEMICONDUCTOR & ELECTRONICS
      80. | 6.80 RESEARCH PROCESS OF MRFR
      81. | 6.81 DRO ANALYSIS OF SEMICONDUCTOR & ELECTRONICS
      82. | 6.82 DRIVERS IMPACT ANALYSIS: SEMICONDUCTOR & ELECTRONICS
      83. | 6.83 RESTRAINTS IMPACT ANALYSIS: SEMICONDUCTOR & ELECTRONICS
      84. | 6.84 SUPPLY / VALUE CHAIN: SEMICONDUCTOR & ELECTRONICS
      85. | 6.85 SEMICONDUCTOR & ELECTRONICS, BY TYPE, 2024 (% SHARE)
      86. | 6.86 SEMICONDUCTOR & ELECTRONICS, BY TYPE, 2024 TO 2035 (USD Billion)
      87. | 6.87 SEMICONDUCTOR & ELECTRONICS, BY APPLICATION, 2024 (% SHARE)
      88. | 6.88 SEMICONDUCTOR & ELECTRONICS, BY APPLICATION, 2024 TO 2035 (USD Billion)
      89. | 6.89 SEMICONDUCTOR & ELECTRONICS, BY END USER, 2024 (% SHARE)
      90. | 6.90 SEMICONDUCTOR & ELECTRONICS, BY END USER, 2024 TO 2035 (USD Billion)
      91. | 6.91 BENCHMARKING OF MAJOR COMPETITORS
    7. LIST OF TABLES
      1. | 7.1 LIST OF ASSUMPTIONS
      2. | | 7.1.1
      3. | 7.2 North America MARKET SIZE ESTIMATES; FORECAST
      4. | | 7.2.1 BY TYPE, 2025-2035 (USD Billion)
      5. | | 7.2.2 BY APPLICATION, 2025-2035 (USD Billion)
      6. | | 7.2.3 BY END USER, 2025-2035 (USD Billion)
      7. | 7.3 US MARKET SIZE ESTIMATES; FORECAST
      8. | | 7.3.1 BY TYPE, 2025-2035 (USD Billion)
      9. | | 7.3.2 BY APPLICATION, 2025-2035 (USD Billion)
      10. | | 7.3.3 BY END USER, 2025-2035 (USD Billion)
      11. | 7.4 Canada MARKET SIZE ESTIMATES; FORECAST
      12. | | 7.4.1 BY TYPE, 2025-2035 (USD Billion)
      13. | | 7.4.2 BY APPLICATION, 2025-2035 (USD Billion)
      14. | | 7.4.3 BY END USER, 2025-2035 (USD Billion)
      15. | 7.5 Europe MARKET SIZE ESTIMATES; FORECAST
      16. | | 7.5.1 BY TYPE, 2025-2035 (USD Billion)
      17. | | 7.5.2 BY APPLICATION, 2025-2035 (USD Billion)
      18. | | 7.5.3 BY END USER, 2025-2035 (USD Billion)
      19. | 7.6 Germany MARKET SIZE ESTIMATES; FORECAST
      20. | | 7.6.1 BY TYPE, 2025-2035 (USD Billion)
      21. | | 7.6.2 BY APPLICATION, 2025-2035 (USD Billion)
      22. | | 7.6.3 BY END USER, 2025-2035 (USD Billion)
      23. | 7.7 UK MARKET SIZE ESTIMATES; FORECAST
      24. | | 7.7.1 BY TYPE, 2025-2035 (USD Billion)
      25. | | 7.7.2 BY APPLICATION, 2025-2035 (USD Billion)
      26. | | 7.7.3 BY END USER, 2025-2035 (USD Billion)
      27. | 7.8 France MARKET SIZE ESTIMATES; FORECAST
      28. | | 7.8.1 BY TYPE, 2025-2035 (USD Billion)
      29. | | 7.8.2 BY APPLICATION, 2025-2035 (USD Billion)
      30. | | 7.8.3 BY END USER, 2025-2035 (USD Billion)
      31. | 7.9 Russia MARKET SIZE ESTIMATES; FORECAST
      32. | | 7.9.1 BY TYPE, 2025-2035 (USD Billion)
      33. | | 7.9.2 BY APPLICATION, 2025-2035 (USD Billion)
      34. | | 7.9.3 BY END USER, 2025-2035 (USD Billion)
      35. | 7.10 Italy MARKET SIZE ESTIMATES; FORECAST
      36. | | 7.10.1 BY TYPE, 2025-2035 (USD Billion)
      37. | | 7.10.2 BY APPLICATION, 2025-2035 (USD Billion)
      38. | | 7.10.3 BY END USER, 2025-2035 (USD Billion)
      39. | 7.11 Spain MARKET SIZE ESTIMATES; FORECAST
      40. | | 7.11.1 BY TYPE, 2025-2035 (USD Billion)
      41. | | 7.11.2 BY APPLICATION, 2025-2035 (USD Billion)
      42. | | 7.11.3 BY END USER, 2025-2035 (USD Billion)
      43. | 7.12 Rest of Europe MARKET SIZE ESTIMATES; FORECAST
      44. | | 7.12.1 BY TYPE, 2025-2035 (USD Billion)
      45. | | 7.12.2 BY APPLICATION, 2025-2035 (USD Billion)
      46. | | 7.12.3 BY END USER, 2025-2035 (USD Billion)
      47. | 7.13 APAC MARKET SIZE ESTIMATES; FORECAST
      48. | | 7.13.1 BY TYPE, 2025-2035 (USD Billion)
      49. | | 7.13.2 BY APPLICATION, 2025-2035 (USD Billion)
      50. | | 7.13.3 BY END USER, 2025-2035 (USD Billion)
      51. | 7.14 China MARKET SIZE ESTIMATES; FORECAST
      52. | | 7.14.1 BY TYPE, 2025-2035 (USD Billion)
      53. | | 7.14.2 BY APPLICATION, 2025-2035 (USD Billion)
      54. | | 7.14.3 BY END USER, 2025-2035 (USD Billion)
      55. | 7.15 India MARKET SIZE ESTIMATES; FORECAST
      56. | | 7.15.1 BY TYPE, 2025-2035 (USD Billion)
      57. | | 7.15.2 BY APPLICATION, 2025-2035 (USD Billion)
      58. | | 7.15.3 BY END USER, 2025-2035 (USD Billion)
      59. | 7.16 Japan MARKET SIZE ESTIMATES; FORECAST
      60. | | 7.16.1 BY TYPE, 2025-2035 (USD Billion)
      61. | | 7.16.2 BY APPLICATION, 2025-2035 (USD Billion)
      62. | | 7.16.3 BY END USER, 2025-2035 (USD Billion)
      63. | 7.17 South Korea MARKET SIZE ESTIMATES; FORECAST
      64. | | 7.17.1 BY TYPE, 2025-2035 (USD Billion)
      65. | | 7.17.2 BY APPLICATION, 2025-2035 (USD Billion)
      66. | | 7.17.3 BY END USER, 2025-2035 (USD Billion)
      67. | 7.18 Malaysia MARKET SIZE ESTIMATES; FORECAST
      68. | | 7.18.1 BY TYPE, 2025-2035 (USD Billion)
      69. | | 7.18.2 BY APPLICATION, 2025-2035 (USD Billion)
      70. | | 7.18.3 BY END USER, 2025-2035 (USD Billion)
      71. | 7.19 Thailand MARKET SIZE ESTIMATES; FORECAST
      72. | | 7.19.1 BY TYPE, 2025-2035 (USD Billion)
      73. | | 7.19.2 BY APPLICATION, 2025-2035 (USD Billion)
      74. | | 7.19.3 BY END USER, 2025-2035 (USD Billion)
      75. | 7.20 Indonesia MARKET SIZE ESTIMATES; FORECAST
      76. | | 7.20.1 BY TYPE, 2025-2035 (USD Billion)
      77. | | 7.20.2 BY APPLICATION, 2025-2035 (USD Billion)
      78. | | 7.20.3 BY END USER, 2025-2035 (USD Billion)
      79. | 7.21 Rest of APAC MARKET SIZE ESTIMATES; FORECAST
      80. | | 7.21.1 BY TYPE, 2025-2035 (USD Billion)
      81. | | 7.21.2 BY APPLICATION, 2025-2035 (USD Billion)
      82. | | 7.21.3 BY END USER, 2025-2035 (USD Billion)
      83. | 7.22 South America MARKET SIZE ESTIMATES; FORECAST
      84. | | 7.22.1 BY TYPE, 2025-2035 (USD Billion)
      85. | | 7.22.2 BY APPLICATION, 2025-2035 (USD Billion)
      86. | | 7.22.3 BY END USER, 2025-2035 (USD Billion)
      87. | 7.23 Brazil MARKET SIZE ESTIMATES; FORECAST
      88. | | 7.23.1 BY TYPE, 2025-2035 (USD Billion)
      89. | | 7.23.2 BY APPLICATION, 2025-2035 (USD Billion)
      90. | | 7.23.3 BY END USER, 2025-2035 (USD Billion)
      91. | 7.24 Mexico MARKET SIZE ESTIMATES; FORECAST
      92. | | 7.24.1 BY TYPE, 2025-2035 (USD Billion)
      93. | | 7.24.2 BY APPLICATION, 2025-2035 (USD Billion)
      94. | | 7.24.3 BY END USER, 2025-2035 (USD Billion)
      95. | 7.25 Argentina MARKET SIZE ESTIMATES; FORECAST
      96. | | 7.25.1 BY TYPE, 2025-2035 (USD Billion)
      97. | | 7.25.2 BY APPLICATION, 2025-2035 (USD Billion)
      98. | | 7.25.3 BY END USER, 2025-2035 (USD Billion)
      99. | 7.26 Rest of South America MARKET SIZE ESTIMATES; FORECAST
      100. | | 7.26.1 BY TYPE, 2025-2035 (USD Billion)
      101. | | 7.26.2 BY APPLICATION, 2025-2035 (USD Billion)
      102. | | 7.26.3 BY END USER, 2025-2035 (USD Billion)
      103. | 7.27 MEA MARKET SIZE ESTIMATES; FORECAST
      104. | | 7.27.1 BY TYPE, 2025-2035 (USD Billion)
      105. | | 7.27.2 BY APPLICATION, 2025-2035 (USD Billion)
      106. | | 7.27.3 BY END USER, 2025-2035 (USD Billion)
      107. | 7.28 GCC Countries MARKET SIZE ESTIMATES; FORECAST
      108. | | 7.28.1 BY TYPE, 2025-2035 (USD Billion)
      109. | | 7.28.2 BY APPLICATION, 2025-2035 (USD Billion)
      110. | | 7.28.3 BY END USER, 2025-2035 (USD Billion)
      111. | 7.29 South Africa MARKET SIZE ESTIMATES; FORECAST
      112. | | 7.29.1 BY TYPE, 2025-2035 (USD Billion)
      113. | | 7.29.2 BY APPLICATION, 2025-2035 (USD Billion)
      114. | | 7.29.3 BY END USER, 2025-2035 (USD Billion)
      115. | 7.30 Rest of MEA MARKET SIZE ESTIMATES; FORECAST
      116. | | 7.30.1 BY TYPE, 2025-2035 (USD Billion)
      117. | | 7.30.2 BY APPLICATION, 2025-2035 (USD Billion)
      118. | | 7.30.3 BY END USER, 2025-2035 (USD Billion)
      119. | 7.31 PRODUCT LAUNCH/PRODUCT DEVELOPMENT/APPROVAL
      120. | | 7.31.1
      121. | 7.32 ACQUISITION/PARTNERSHIP
      122. | | 7.32.1

    Photonic Crystals Market Segmentation

    Photonic Crystals Type Outlook (USD Billion, 2020-2034)

    • 1-D Photonic Crystals
    • 2-D Photonic Crystals
    • 3-D Photonic Crystals

    Photonic Crystals Application Outlook (USD Billion, 2020-2034)

    • Optical Fiber
    • LED
    • Image Sensor
    • Solar & PV Cell
    • Laser
    • Discrete & Integrated Optical Component
    • Others

    Photonic Crystals End User Outlook (USD Billion, 2020-2034)

    • Industrial
    • Aerospace & Defense
    • Life Sciences & Healthcare
    • Others

    Photonic Crystals Regional Outlook (USD Billion, 2020-2034)

    • North America Outlook (USD Billion, 2020-2034)
      • North America Photonic Crystals by Type
        • 1-D Photonic Crystals
        • 2-D Photonic Crystals
        • 3-D Photonic Crystals
      • North America Photonic Crystals by Application
        • Optical Fiber
        • LED
        • Image Sensor
        • Solar & PV Cell
        • Laser
        • Discrete & Integrated Optical Component
        • Others
      • North America Photonic Crystals by End User
        • Industrial
        • Aerospace & Defense
        • Life Sciences & Healthcare
        • Others
      • US Outlook (USD Billion, 2020-2034)
      • US Photonic Crystals by Type
        • 1-D Photonic Crystals
        • 2-D Photonic Crystals
        • 3-D Photonic Crystals
      • US Photonic Crystals by Application
        • Optical Fiber
        • LED
        • Image Sensor
        • Solar & PV Cell
        • Laser
        • Discrete & Integrated Optical Component
        • Others
      • US Photonic Crystals by End User
        • Industrial
        • Aerospace & Defense
        • Life Sciences & Healthcare
        • Others
      • CANADA Outlook (USD Billion, 2020-2034)
      • Canada Photonic Crystals by Type
        • 1-D Photonic Crystals
        • 2-D Photonic Crystals
        • 3-D Photonic Crystals
      • Canada Photonic Crystals by Application
        • Optical Fiber
        • LED
        • Image Sensor
        • Solar & PV Cell
        • Laser
        • Discrete & Integrated Optical Component
        • Others
      • Canada Photonic Crystals by End User
        • Industrial
        • Aerospace & Defense
        • Life Sciences & Healthcare
        • Others
      • Europe Outlook (USD Billion, 2020-2034)
        • Europe Photonic Crystals by Type
          • 1-D Photonic Crystals
          • 2-D Photonic Crystals
          • 3-D Photonic Crystals
        • Europe Photonic Crystals by Application
          • Optical Fiber
          • LED
          • Image Sensor
          • Solar & PV Cell
          • Laser
          • Discrete & Integrated Optical Component
          • Others
        • Europe Photonic Crystals by End User
          • Industrial
          • Aerospace & Defense
          • Life Sciences & Healthcare
          • Others
        • Germany Outlook (USD Billion, 2020-2034)
        • Germany Photonic Crystals by Type
          • 1-D Photonic Crystals
          • 2-D Photonic Crystals
          • 3-D Photonic Crystals
        • Germany Photonic Crystals by Application
          • Optical Fiber
          • LED
          • Image Sensor
          • Solar & PV Cell
          • Laser
          • Discrete & Integrated Optical Component
          • Others
        • Germany Photonic Crystals by End User
          • Industrial
          • Aerospace & Defense
          • Life Sciences & Healthcare
          • Others
        • France Outlook (USD Billion, 2020-2034)
        • France Photonic Crystals by Type
          • 1-D Photonic Crystals
          • 2-D Photonic Crystals
          • 3-D Photonic Crystals
        • France Photonic Crystals by Application
          • Optical Fiber
          • LED
          • Image Sensor
          • Solar & PV Cell
          • Laser
          • Discrete & Integrated Optical Component
          • Others
        • France Photonic Crystals by End User
          • Industrial
          • Aerospace & Defense
          • Life Sciences & Healthcare
          • Others
        • UK Outlook (USD Billion, 2020-2034)
        • UK Photonic Crystals by Type
          • 1-D Photonic Crystals
          • 2-D Photonic Crystals
          • 3-D Photonic Crystals
        • UK Photonic Crystals by Application
          • Optical Fiber
          • LED
          • Image Sensor
          • Solar & PV Cell
          • Laser
          • Discrete & Integrated Optical Component
          • Others
        • UK Photonic Crystals by End User
          • Industrial
          • Aerospace & Defense
          • Life Sciences & Healthcare
          • Others
        • ITALY Outlook (USD Billion, 2020-2034)
        • Italy Photonic Crystals by Type
          • 1-D Photonic Crystals
          • 2-D Photonic Crystals
          • 3-D Photonic Crystals
        • Italy Photonic Crystals by Application
          • Optical Fiber
          • LED
          • Image Sensor
          • Solar & PV Cell
          • Laser
          • Discrete & Integrated Optical Component
          • Others
        • Italy Photonic Crystals by End User
          • Industrial
          • Aerospace & Defense
          • Life Sciences & Healthcare
          • Others
        • SPAIN Outlook (USD Billion, 2020-2034)
        • Spain Photonic Crystals by Type
          • 1-D Photonic Crystals
          • 2-D Photonic Crystals
          • 3-D Photonic Crystals
        • Spain Photonic Crystals by Application
          • Optical Fiber
          • LED
          • Image Sensor
          • Solar & PV Cell
          • Laser
          • Discrete & Integrated Optical Component
          • Others
        • Spain Photonic Crystals by End User
          • Industrial
          • Aerospace & Defense
          • Life Sciences & Healthcare
          • Others
        • Rest Of Europe Outlook (USD Billion, 2020-2034)
        • Rest of Europe Photonic Crystals by Type
          • 1-D Photonic Crystals
          • 2-D Photonic Crystals
          • 3-D Photonic Crystals
        • Rest of Europe Photonic Crystals by Application
          • Optical Fiber
          • LED
          • Image Sensor
          • Solar & PV Cell
          • Laser
          • Discrete & Integrated Optical Component
          • Others
        • Rest of Europe Photonic Crystals by End User
          • Industrial
          • Aerospace & Defense
          • Life Sciences & Healthcare
          • Others
        • Asia-Pacific Outlook (USD Billion, 2020-2034)
          • Asia-Pacific Photonic Crystals by Type
            • 1-D Photonic Crystals
            • 2-D Photonic Crystals
            • 3-D Photonic Crystals
          • Asia-Pacific Photonic Crystals by Application
            • Optical Fiber
            • LED
            • Image Sensor
            • Solar & PV Cell
            • Laser
            • Discrete & Integrated Optical Component
            • Others
          • Asia-Pacific Photonic Crystals by End User
            • Industrial
            • Aerospace & Defense
            • Life Sciences & Healthcare
            • Others
          • China Outlook (USD Billion, 2020-2034)
          • China Photonic Crystals by Type
            • 1-D Photonic Crystals
            • 2-D Photonic Crystals
            • 3-D Photonic Crystals
          • China Photonic Crystals by Application
            • Optical Fiber
            • LED
            • Image Sensor
            • Solar & PV Cell
            • Laser
            • Discrete & Integrated Optical Component
            • Others
          • China Photonic Crystals by End User
            • Industrial
            • Aerospace & Defense
            • Life Sciences & Healthcare
            • Others
          • Japan Outlook (USD Billion, 2020-2034)
          • Japan Photonic Crystals by Type
            • 1-D Photonic Crystals
            • 2-D Photonic Crystals
            • 3-D Photonic Crystals
          • Japan Photonic Crystals by Application
            • Optical Fiber
            • LED
            • Image Sensor
            • Solar & PV Cell
            • Laser
            • Discrete & Integrated Optical Component
            • Others
          • Japan Photonic Crystals by End User
            • Industrial
            • Aerospace & Defense
            • Life Sciences & Healthcare
            • Others
          • India Outlook (USD Billion, 2020-2034)
          • India Photonic Crystals by Type
            • 1-D Photonic Crystals
            • 2-D Photonic Crystals
            • 3-D Photonic Crystals
          • India Photonic Crystals by Application
            • Optical Fiber
            • LED
            • Image Sensor
            • Solar & PV Cell
            • Laser
            • Discrete & Integrated Optical Component
            • Others
          • India Photonic Crystals by End User
            • Industrial
            • Aerospace & Defense
            • Life Sciences & Healthcare
            • Others
          • Australia Outlook (USD Billion, 2020-2034)
          • Australia Photonic Crystals by Type
            • 1-D Photonic Crystals
            • 2-D Photonic Crystals
            • 3-D Photonic Crystals
          • Australia Photonic Crystals by Application
            • Optical Fiber
            • LED
            • Image Sensor
            • Solar & PV Cell
            • Laser
            • Discrete & Integrated Optical Component
            • Others
          • Australia Photonic Crystals by End User
            • Industrial
            • Aerospace & Defense
            • Life Sciences & Healthcare
            • Others
          • Rest of Asia-Pacific Outlook (USD Billion, 2020-2034)
          • Rest of Asia-Pacific Photonic Crystals by Type
            • 1-D Photonic Crystals
            • 2-D Photonic Crystals
            • 3-D Photonic Crystals
          • Rest of Asia-Pacific Photonic Crystals by Application
            • Optical Fiber
            • LED
            • Image Sensor
            • Solar & PV Cell
            • Laser
            • Discrete & Integrated Optical Component
            • Others
          • Rest of Asia-Pacific Photonic Crystals by End User
            • Industrial
            • Aerospace & Defense
            • Life Sciences & Healthcare
            • Others
          • Rest of the World Outlook (USD Billion, 2020-2034)
            • Rest of the World Photonic Crystals by Type
              • 1-D Photonic Crystals
              • 2-D Photonic Crystals
              • 3-D Photonic Crystals
            • Rest of the World Photonic Crystals by Application
              • Optical Fiber
              • LED
              • Image Sensor
              • Solar & PV Cell
              • Laser
              • Discrete & Integrated Optical Component
              • Others
            • Rest of the World Photonic Crystals by End User
              • Industrial
              • Aerospace & Defense
              • Life Sciences & Healthcare
              • Others
            • Middle East Outlook (USD Billion, 2020-2034)
            • Middle East Photonic Crystals by Type
              • 1-D Photonic Crystals
              • 2-D Photonic Crystals
              • 3-D Photonic Crystals
            • Middle East Photonic Crystals by Application
              • Optical Fiber
              • LED
              • Image Sensor
              • Solar & PV Cell
              • Laser
              • Discrete & Integrated Optical Component
              • Others
            • Middle East Photonic Crystals by End User
              • Industrial
              • Aerospace & Defense
              • Life Sciences & Healthcare
              • Others
            • Africa Outlook (USD Billion, 2020-2034)
            • Africa Photonic Crystals by Type
              • 1-D Photonic Crystals
              • 2-D Photonic Crystals
              • 3-D Photonic Crystals
            • Africa Photonic Crystals by Application
              • Optical Fiber
              • LED
              • Image Sensor
              • Solar & PV Cell
              • Laser
              • Discrete & Integrated Optical Component
              • Others
            • Africa Photonic Crystals by End User
              • Industrial
              • Aerospace & Defense
              • Life Sciences & Healthcare
              • Others
            • Latin America Outlook (USD Billion, 2020-2034)
            • Latin America Photonic Crystals by Type
              • 1-D Photonic Crystals
              • 2-D Photonic Crystals
              • 3-D Photonic Crystals
            • Latin America Photonic Crystals by Application
              • Optical Fiber
              • LED
              • Image Sensor
              • Solar & PV Cell
              • Laser
              • Discrete & Integrated Optical Component
              • Others
            • Latin America Photonic Crystals by End User
              • Industrial
              • Aerospace & Defense
              • Life Sciences & Healthcare
              • Others


    Infographic

    Free Sample Request

    Kindly complete the form below to receive a free sample of this Report

    Get Free Sample

    Customer Strories

    “I am very pleased with how market segments have been defined in a relevant way for my purposes (such as "Portable Freezers & refrigerators" and "last-mile"). In general the report is well structured. Thanks very much for your efforts.”

    Victoria Milne

    Founder
    Case Study
    Chemicals and Materials

    Compare Licence

    ×
    Features License Type
    Single User Multiuser License Enterprise User
    Price $4,950 $5,950 $7,250
    Maximum User Access Limit 1 User Upto 10 Users Unrestricted Access Throughout the Organization
    Free Customization
    Direct Access to Analyst
    Deliverable Format
    Platform Access
    Discount on Next Purchase 10% 15% 15%
    Printable Versions