• Cat-intel
  • MedIntelliX
  • Resources
  • About Us
  • Hero Background
    English
    Chinese
    French
    Japanese
    Korean
    German
    Spanish

    PEGylated Drugs Market Analysis

    ID: MRFR/Pharma/6964-CR
    173 Pages
    Rahul Gotadki
    July 2025

    Pegylated Drugs Market Research Report Information by Molecule (Macromolecular Drugs (Protein and Peptide, Enzyme, Aptamer), Small Molecular Drugs, Lipid Nanoparticles (LNP) and Liposomes), by Application (Oncology, Neurology, Autoimmune Diseases, Haematology, Others), by Distribution Channel (Hospital Pharmacy, Online Pharmacy, Retail Pharmacy) and Region (North America, Europe, Asia-Pacific, ...

    Share:
    Download PDF ×

    We do not share your information with anyone. However, we may send you emails based on your report interest from time to time. You may contact us at any time to opt-out.

    PEGylated Drugs Market Infographic
    Purchase Options

    Market Analysis

    In-depth Analysis of PEGylated Drugs Market Industry Landscape

    The expansion of research and development efforts in the pharmaceutical and biotechnology sector, aimed at addressing the increasing requirements for treating various chronic diseases, is fueling the growth of the PEGylated drugs market. A survey conducted among members of the Pharmaceutical Research and Manufacturers of America (PhRMA) revealed substantial investments in research and development. In 2017, PhRMA member companies collectively invested a noteworthy USD 71.4 billion in R&D. Notably, the majority of this R&D spending, estimated at USD 90 billion, came from the United States.

    Highlighting the global scope of these efforts, the Association of the British Pharmaceutical Industry (ABPI) invested over USD 418 million in the UK alone for research and development. Their focus was on seeking breakthroughs for conditions like cancer, dementia, and rare genetic diseases. Similarly, the Australian government allocated over USD 174.8 million in 2017 for cancer research and development, as reported by the National Health and Medical Research Council. This significant increase in research and development activities within the healthcare sector is contributing to the upward trajectory of PEGylation technology.

    The advancements in research and development within the pharmaceutical industry play a pivotal role in propelling the growth of the PEGylated drugs market. These efforts are a response to the growing demand for effective treatments for chronic diseases, and they signify a commitment to discovering innovative solutions to address the complexities of various health conditions.

    The investment figures provided by PhRMA underscore the substantial financial commitment made by pharmaceutical companies towards advancing healthcare solutions. The focus on research and development is not limited to a single region, as evidenced by the global investments reported by ABPI and the Australian government. This concerted effort reflects the recognition of the challenges posed by chronic diseases and the determination to find solutions that can make a positive impact on patients' lives.

    As the pharmaceutical and biotechnology industry continues to channel significant resources into research and development, the resulting innovations are driving the growth of the PEGylated drugs market. PEGylation technology, in particular, is gaining prominence due to its ability to enhance drug delivery and improve the efficacy of treatments. The market's upward trajectory is a testament to the transformative impact of ongoing research and development initiatives in the field of healthcare.

    In conclusion, the surge in research and development activities within the pharmaceutical and biotechnology industry is a key driver behind the growth of the PEGylated drugs market. The substantial investments made by organizations globally underscore a commitment to addressing the challenges posed by chronic diseases. As advancements in healthcare solutions continue to emerge, propelled by dedicated research and development efforts, PEGylation technology is positioned for increased adoption, offering promising outcomes for the treatment of various health conditions. The ongoing commitment to innovation signals a positive trajectory for the PEGylated drugs market, driven by the collective efforts to enhance the quality of healthcare worldwide.

    Author
    Rahul Gotadki
    Assistant Manager

    He holds an experience of about 7+ years in Market Research and Business Consulting, working under the spectrum of Life Sciences and Healthcare domains. Rahul conceptualizes and implements a scalable business strategy and provides strategic leadership to the clients. His expertise lies in market estimation, competitive intelligence, pipeline analysis, customer assessment, etc. In addition to the above, his other responsibility includes strategic tracking of high growth markets & advising clients on the potential areas of focus they could direct their business initiatives

    Leave a Comment

    FAQs

    How much is the Pegylated Drugs Market?

    USD 15.18 Billion is the Pegylated Drugs Market in 2024

    Which Molecule holds the largest market share?

    The Macromolecular Drugs segment by Molecule holds the largest market share and grows at a CAGR of 5.94 % during the forecast period.

    Which region holds the largest market share in the Pegylated Drugs Market?

    North America holds the largest market share in the Pegylated Drugs Market.

    Who are the prominent players in the Pegylated Drugs Market?

    Amgen Inc., Pfizer Inc., Biogen, Bayer AG, Takeda Pharmaceutical Company Limited, Novo Nordisk A/S, Sandoz Group Ag, AstraZeneca, Coherus BioSciences, Inc., F. Hoffmann-La Roche Ltd, Johnson & Johnson Inc., Alnylam Pharmaceuticals, Inc., LES Laboratoires Servier are prominent players in the Pegylated Drugs Market.

    Which Application segment led the Pegylated Drugs Market?

    The Protein and Peptide segment dominated the market in 2024.

    Market Summary

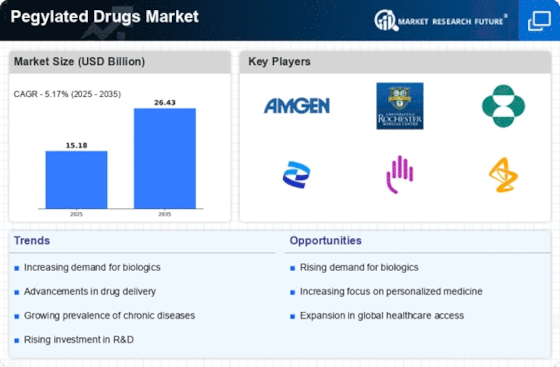
    As per MRFR analysis, the Pegylated Drugs Market Size was estimated at 15.18 USD Billion in 2024. The Pegylated Drugs industry is projected to grow from 15.96 USD Billion in 2025 to 26.43 USD Billion by 2035, exhibiting a compound annual growth rate (CAGR) of 5.17 during the forecast period 2025 - 2035.

    Key Market Trends & Highlights

    The Pegylated Drugs Market is experiencing robust growth driven by advancements in targeted therapies and increasing investment in biotechnology.

    • The market is witnessing a rising demand for targeted therapies, particularly in oncology, which remains the largest segment.
    • Expansion in therapeutic applications is evident, with macromolecular drugs leading the market in terms of size.
    • Increased investment in research and development is propelling growth, especially in the Asia-Pacific region, which is the fastest-growing market.
    • Key drivers include the growing prevalence of chronic diseases and advancements in drug delivery systems, fostering a favorable environment for pegylated drugs.

    Market Size & Forecast

    2024 Market Size 15.18 (USD Billion)
    2035 Market Size 26.43 (USD Billion)
    CAGR (2025 - 2035) 5.17%
    Largest Regional Market Share in 2024 North America

    Major Players

    <p>Amgen (US), Roche (CH), Merck & Co. (US), Pfizer (US), Bristol-Myers Squibb (US), AstraZeneca (GB), Novartis (CH), Eli Lilly and Company (US), Teva Pharmaceutical Industries (IL)</p>

    Market Trends

    The Pegylated Drugs Market is currently experiencing a dynamic evolution, driven by advancements in biotechnology and a growing understanding of the therapeutic benefits of pegylation. This innovative process enhances the pharmacokinetic properties of drugs, leading to improved efficacy and reduced side effects. As a result, there is an increasing demand for pegylated formulations across various therapeutic areas, including oncology, infectious diseases, and autoimmune disorders. The market landscape is characterized by a surge in research and development activities, with numerous pharmaceutical companies investing in the creation of novel pegylated drugs. This trend suggests a robust pipeline of products that may soon enter the market, potentially transforming treatment paradigms. Moreover, the Pegylated Drugs Market is witnessing a shift towards personalized medicine, where tailored therapies are becoming more prevalent. This approach aligns with the growing emphasis on patient-centric care, as healthcare providers seek to optimize treatment outcomes based on individual patient profiles. Additionally, regulatory agencies are increasingly supportive of innovative drug delivery systems, which may further facilitate the approval and adoption of pegylated therapies. Overall, the market appears poised for substantial growth, driven by technological advancements and a commitment to enhancing patient care.

    Rising Demand for Targeted Therapies

    The Pegylated Drugs Market is seeing a notable increase in the demand for targeted therapies. This trend is largely attributed to the growing recognition of the benefits of precision medicine, which aims to tailor treatments to individual patient needs. Pegylated drugs, with their enhanced delivery mechanisms, are particularly well-suited for this approach, as they can improve drug stability and reduce systemic toxicity.

    Expansion in Therapeutic Applications

    There is a discernible expansion in the therapeutic applications of pegylated drugs. Initially prominent in oncology, these formulations are now being explored for a wider range of conditions, including chronic diseases and rare disorders. This diversification indicates a broader acceptance of pegylation technology across various medical fields, potentially leading to new treatment options for patients.

    Increased Investment in Research and Development

    Investment in research and development within the Pegylated Drugs Market is on the rise. Pharmaceutical companies are allocating significant resources to explore innovative pegylation techniques and develop new formulations. This trend reflects a commitment to advancing drug efficacy and safety, as well as a response to the competitive landscape that demands continuous innovation.

    <p>The ongoing evolution of pegylated drugs appears to enhance therapeutic efficacy and patient compliance, indicating a promising trajectory for the pharmaceutical landscape.</p>

    U.S. Food and Drug Administration (FDA)

    PEGylated Drugs Market Market Drivers

    Rising Investment in Biotechnology

    The surge investment within the biotechnology sector is propelling the Pegylated Drugs Market forward. Venture capital and private equity funding are increasingly directed towards companies developing pegylated therapies, recognizing their potential to address unmet medical needs. This influx of capital enables research and development efforts to accelerate, leading to the introduction of novel pegylated drugs. The biotechnology sector is projected to grow at a CAGR of 10% through 2027, with pegylated drugs playing a pivotal role in this expansion. The financial backing not only supports innovation but also enhances competition within the market, ultimately benefiting patients through improved treatment options.

    Advancements in Drug Delivery Systems

    Innovations in drug delivery systems are significantly influencing the Pegylated Drugs Market. The incorporation of pegylation technology enhances the pharmacokinetics of drugs, allowing for more efficient delivery and improved therapeutic efficacy. This advancement is particularly relevant in oncology, where pegylated formulations can target tumors more effectively while minimizing side effects. The market is witnessing a shift towards personalized medicine, where pegylated drugs are tailored to individual patient profiles, further driving demand. As a result, the pegylated drugs segment is expected to grow at a compound annual growth rate (CAGR) of 8% over the next five years, indicating a robust market trajectory fueled by these technological advancements.

    Growing Prevalence of Chronic Diseases

    The rising incidence of chronic diseases such as cancer, diabetes, and autoimmune disorders is a primary driver for the Pegylated Drugs Market. As these conditions become more prevalent, the demand for effective treatment options increases. Pegylated drugs, known for their extended half-life and reduced immunogenicity, are increasingly utilized in therapeutic regimens. For instance, pegylated interferon is widely used in the treatment of hepatitis C, contributing to a substantial market share. The market for pegylated drugs is projected to reach USD 30 billion by 2026, reflecting the urgent need for innovative therapies that can improve patient outcomes. This trend underscores the importance of pegylated formulations in addressing the healthcare challenges posed by chronic diseases.

    Regulatory Support for Biopharmaceuticals

    Regulatory bodies are increasingly supportive of biopharmaceutical innovations, which is a crucial factor for the Pegylated Drugs Market. Streamlined approval processes and incentives for the development of pegylated drugs encourage pharmaceutical companies to invest in this area. For example, the FDA has established guidelines that facilitate the approval of pegylated formulations, recognizing their potential to improve therapeutic outcomes. This regulatory environment not only fosters innovation but also enhances market access for new pegylated drugs. As a result, the market is expected to expand, with an estimated increase in the number of approved pegylated drugs by 20% over the next few years, reflecting the positive impact of regulatory support.

    Increasing Awareness and Acceptance of Biologics

    There is a growing awareness and acceptance of biologics among healthcare professionals and patients, which is positively impacting the Pegylated Drugs Market. As more stakeholders recognize the benefits of biologic therapies, including pegylated drugs, the demand for these treatments is likely to rise. Educational initiatives and marketing efforts by pharmaceutical companies are contributing to this trend, highlighting the efficacy and safety profiles of pegylated formulations. The market for biologics is expected to reach USD 400 billion by 2025, with pegylated drugs constituting a significant portion of this growth. This increasing acceptance is crucial for the sustained expansion of the pegylated drugs market.

    Market Segment Insights

    By Molecule: Macromolecular Drugs (Largest) vs. Lipid Nanoparticles (Fastest-Growing)

    <p>In the Pegylated Drugs Market, the segment distribution reveals that Macromolecular Drugs hold a prominent share due to their extensive applications in chronic and rare disease treatments. These drugs are characterized by their large molecular size, which often translates to enhanced efficacy and better therapeutic outcomes. In contrast, Lipid Nanoparticles (LNP) are quickly gaining traction, especially in the context of mRNA therapies and vaccines, thus marking them as an emerging powerhouse in the segment.</p>

    <p>Macromolecular Drugs (Dominant) vs. Liposomes (Emerging)</p>

    <p>Macromolecular Drugs, with their high molecular weight and targeted delivery mechanisms, dominate the Pegylated Drugs Market, primarily used in oncology and autoimmune diseases. They offer prolonged circulation times and reduced immunogenicity through pegylation, making them a preferred choice among healthcare providers. On the other hand, Liposomes are emerging as a valuable delivery system for both macromolecules and small molecules, improving bioavailability and reducing toxicity. Their unique ability to encapsulate hydrophilic and hydrophobic drugs allows them to play a critical role in enhancing drug efficacy while minimizing side effects. This adaptability positions Liposomes as a promising segment within the industry.</p>

    By Application: Oncology (Largest) vs. Neurology (Fastest-Growing)

    <p>The Pegylated Drugs Market is predominantly driven by the oncology application, which commands the largest share in the market, owing to the increasing incidence of various cancers and advancements in targeted therapies. Oncology therapies utilizing pegylated drugs enhance the therapeutic efficacy and reduce side effects, making them preferred choices among healthcare providers. Neurology follows as the fastest-growing segment, driven by an increase in neurological disorders and the demand for innovative treatments.</p>

    <p>Oncology (Dominant) vs. Neurology (Emerging)</p>

    <p>Oncology remains the dominant application within the Pegylated Drugs Market, characterized by a robust pipeline of drugs designed to treat multiple cancer types effectively. The use of pegylated formulations not only prolongs drug circulation time but also enhances patient compliance due to reduced dosing frequency. In contrast, neurology is an emerging application driven by the increasing prevalence of neurological conditions such as Alzheimer’s and multiple sclerosis. This segment is witnessing rapid innovation, with newer pegylated drugs being developed to improve efficacy and minimize adverse effects, reflecting a strong trend towards personalized medicine in neurological care.</p>

    By Distribution Channel: Hospital Pharmacy (Largest) vs. Online Pharmacy (Fastest-Growing)

    <p>In the Pegylated Drugs Market, the distribution channel landscape is characterized by three primary avenues: Hospital Pharmacy, Online Pharmacy, and Retail Pharmacy. Among these, Hospital Pharmacies hold the largest share, primarily due to the high volume of pegylated drugs utilized in in-patient treatments. Meanwhile, Retail Pharmacies have a steady presence, appealing to out-patients and those receiving drug treatments at home. Online Pharmacies, although currently smaller in market share, are rapidly gaining traction, meeting the growing demand for convenient access to medications.</p>

    <p>Hospital Pharmacy (Dominant) vs. Online Pharmacy (Emerging)</p>

    <p>Hospital Pharmacies play a crucial role in the Pegylated Drugs Market as they provide the essential drugs needed for complex treatments, particularly in oncology and chronic disease management. The dominance of these pharmacies stems from their ability to offer specialized services and sincere patient care. On the other hand, Online Pharmacies represent an emerging segment, leveraging e-commerce trends to reach patients directly. This growth can be attributed to a demand for convenience, especially among tech-savvy patients. The rise of telemedicine and increased accessibility of online services are further enhancing the appeal of online pharmacies, making them a formidable competitor in the distribution of pegylated drugs.</p>

    Get more detailed insights about Pegylated Drugs Market Research Report – Forecast Till 2035

    Regional Insights

    Based on the Region, the global Pegylated Drugs are segmented into North America, Europe, Asia-Pacific and Rest of the World. The North America dominated the global market in 2024, while the Asia-Pacific is projected to be the fastest–growing segment during the forecast period. Major demand factors driving the North America market are the increasing incidences of chronic diseases and advancements in biologics and recently approved Pegylated Drugs. 

    The North America Pegylated Drugs market, encompassing the US and Canada, is witnessing robust growth, fueled by advancements in drug delivery systems and the rising demand for improved therapeutic outcomes. PEGylation, the process of attaching polyethylene glycol (PEG) to drugs, enhances their stability, reduces immunogenicity, and prolongs their half-life in the bloodstream. This technology has revolutionized the treatment of chronic diseases such as cancer, hepatitis, and autoimmune disorders, driving its adoption across the region.

    FIGURE 3: PEGYLATED DRUGS MARKET VALUE BY REGION 2024 AND 2035 (USD BILLION)

    PEGYLATED DRUGS MARKET VALUE BY REGION 2024 AND 2035

    Source: Secondary Research, Primary Research, MRFR Database, and Analyst Review

    Further, the countries considered in the scope of the Application Tracking System Market are the US, Canada, Germany, France, UK, Italy, Spain, China, India, Japan, Australia, South Korea, Middle East and Africa, South America and others.

    Key Players and Competitive Insights

    Many global, regional, and local vendors characterize the Pegylated Drugs Market. The market is highly competitive, with all the players competing to gain market share. Intense competition, rapid advances in technology, frequent changes in government policies, and environmental regulations are key factors that confront market growth. The vendors compete based on cost, product quality, reliability, and government regulations. Vendors must provide cost-efficient, high-quality products to survive and succeed in an intensely competitive market.

    The major competitors in the market are Amgen Inc., Pfizer Inc., Biogen, Bayer AG, Takeda Pharmaceutical Company Limited, Novo Nordisk A/S, Sandoz Group Ag, AstraZeneca, Coherus BioSciences, Inc., F. Hoffmann-La Roche Ltd, Johnson & Johnson Inc., Alnylam Pharmaceuticals, Inc., LES Laboratoires Servier are among others. The Pegylated Drugs Market is a consolidated market due to increasing competition, acquisitions, mergers and other strategic market developments and decisions to improve operational effectiveness.

    Key Companies in the PEGylated Drugs Market market include

    Industry Developments

    November 2024: Amgen presented new data from its rare disease portfolio and pipeline at the American College of Rheumatology (ACR) Convergence 2024 conference in Washington, D.C. The AGILE trial evaluated the safety, tolerability, and efficacy of KRYSTEXXA administered with a shorter infusion duration in patients with uncontrolled gout who received methotrexate as co-administration.

    December 2024: Coherus BioSciences, Inc. announced that it had entered into an asset purchase agreement (the Agreement) dated December 2, 2024, with Intas Pharmaceuticals Ltd. (Intas) for the divestiture of the UDENYCA (pegfilgrastim-cbqv) franchise for up to $558.4 million.

    October 2023: The FDA declined to approve Alnylam's Onpattro in ATTR-CM. The judgment has no bearing on Onpattro's current indication for another type of ATTR known as polyneuropathy, which affects peripheral nerves.

    February 2021: Biogen received FDA Approval of PLEGRIDY (peginterferon beta-1a) Intramuscular Administration for Multiple Sclerosis.

    Pegylated Drugs Market Segmentation

    Pegylated Drugs by Molecule Outlook

    • Macromolecular Drugs
      • Protein and Peptide
      • Enzyme
      • Aptamer
    • Small Molecular Drugs
    • Lipid Nanoparticles (LNP) and Liposomes

    Pegylated Drugs by Application Outlook

    • Oncology
    • Neurology
    • Autoimmune Diseases   
    • Haematology
    • Others

    Pegylated Drugs by Distribution Channel Outlook

    • Hospital Pharmacy     
    • Online Pharmacy   
    • Retail Pharmacy 

    Pegylated Drugs Regional Outlook 

    • North America
      • US
      • Canada
    • Europe
      • Germany
      • France
      • UK
      • Italy
      • Spain
      • Rest of Europe
    • Asia-Pacific
      • China
      • India
      • Japan
      • Australia
      • South Korea
      • Rest of Asia-Pacific
    • Rest of the World
      • Middle East and Africa
      • South America

    Future Outlook

    PEGylated Drugs Market Future Outlook

    <p>The Pegylated Drugs Market is projected to grow at a 5.17% CAGR from 2024 to 2035, driven by advancements in drug delivery systems and increasing chronic disease prevalence.</p>

    New opportunities lie in:

    • <p>Expansion of biosimilar pegylated drugs in emerging markets.</p>
    • <p>Development of personalized pegylated therapies for oncology.</p>
    • <p>Investment in automated manufacturing technologies for cost efficiency.</p>

    <p>By 2035, the Pegylated Drugs Market is expected to achieve substantial growth, reflecting evolving healthcare needs.</p>

    Market Segmentation

    PEGylated Drugs Market Molecule Outlook

    • Macromolecular Drugs
    • Small Molecular Drugs
    • Lipid Nanoparticles (LNP)
    • Liposomes

    PEGylated Drugs Market Application Outlook

    • Oncology
    • Neurology
    • Autoimmune Diseases
    • Rare Haematology
    • Others

    PEGylated Drugs Market Distribution Channel Outlook

    • Hospital Pharmacy
    • Online Pharmacy
    • Retail Pharmacy

    Report Scope

    MARKET SIZE 202415.18(USD Billion)
    MARKET SIZE 202515.96(USD Billion)
    MARKET SIZE 203526.43(USD Billion)
    COMPOUND ANNUAL GROWTH RATE (CAGR)5.17% (2024 - 2035)
    REPORT COVERAGERevenue Forecast, Competitive Landscape, Growth Factors, and Trends
    BASE YEAR2024
    Market Forecast Period2025 - 2035
    Historical Data2019 - 2024
    Market Forecast UnitsUSD Billion
    Key Companies ProfiledMarket analysis in progress
    Segments CoveredMarket segmentation analysis in progress
    Key Market OpportunitiesAdvancements in targeted therapies enhance growth potential in the Pegylated Drugs Market.
    Key Market DynamicsRising demand for targeted therapies drives innovation and competition in the pegylated drugs market.
    Countries CoveredNorth America, Europe, APAC, South America, MEA

    FAQs

    How much is the Pegylated Drugs Market?

    USD 15.18 Billion is the Pegylated Drugs Market in 2024

    Which Molecule holds the largest market share?

    The Macromolecular Drugs segment by Molecule holds the largest market share and grows at a CAGR of 5.94 % during the forecast period.

    Which region holds the largest market share in the Pegylated Drugs Market?

    North America holds the largest market share in the Pegylated Drugs Market.

    Who are the prominent players in the Pegylated Drugs Market?

    Amgen Inc., Pfizer Inc., Biogen, Bayer AG, Takeda Pharmaceutical Company Limited, Novo Nordisk A/S, Sandoz Group Ag, AstraZeneca, Coherus BioSciences, Inc., F. Hoffmann-La Roche Ltd, Johnson &amp; Johnson Inc., Alnylam Pharmaceuticals, Inc., LES Laboratoires Servier are prominent players in the Pegylated Drugs Market.

    Which Application segment led the Pegylated Drugs Market?

    The Protein and Peptide segment dominated the market in 2024.

    1. SECTION I: EXECUTIVE SUMMARY AND KEY HIGHLIGHTS
      1. | 1.1 EXECUTIVE SUMMARY
      2. | | 1.1.1 Market Overview
      3. | | 1.1.2 Key Findings
      4. | | 1.1.3 Market Segmentation
      5. | | 1.1.4 Competitive Landscape
      6. | | 1.1.5 Challenges and Opportunities
      7. | | 1.1.6 Future Outlook
    2. SECTION II: SCOPING, METHODOLOGY AND MARKET STRUCTURE
      1. | 2.1 MARKET INTRODUCTION
      2. | | 2.1.1 Definition
      3. | | 2.1.2 Scope of the study
      4. | | | 2.1.2.1 Research Objective
      5. | | | 2.1.2.2 Assumption
      6. | | | 2.1.2.3 Limitations
      7. | 2.2 RESEARCH METHODOLOGY
      8. | | 2.2.1 Overview
      9. | | 2.2.2 Data Mining
      10. | | 2.2.3 Secondary Research
      11. | | 2.2.4 Primary Research
      12. | | | 2.2.4.1 Primary Interviews and Information Gathering Process
      13. | | | 2.2.4.2 Breakdown of Primary Respondents
      14. | | 2.2.5 Forecasting Model
      15. | | 2.2.6 Market Size Estimation
      16. | | | 2.2.6.1 Bottom-Up Approach
      17. | | | 2.2.6.2 Top-Down Approach
      18. | | 2.2.7 Data Triangulation
      19. | | 2.2.8 Validation
    3. SECTION III: QUALITATIVE ANALYSIS
      1. | 3.1 MARKET DYNAMICS
      2. | | 3.1.1 Overview
      3. | | 3.1.2 Drivers
      4. | | 3.1.3 Restraints
      5. | | 3.1.4 Opportunities
      6. | 3.2 MARKET FACTOR ANALYSIS
      7. | | 3.2.1 Value chain Analysis
      8. | | 3.2.2 Porter's Five Forces Analysis
      9. | | | 3.2.2.1 Bargaining Power of Suppliers
      10. | | | 3.2.2.2 Bargaining Power of Buyers
      11. | | | 3.2.2.3 Threat of New Entrants
      12. | | | 3.2.2.4 Threat of Substitutes
      13. | | | 3.2.2.5 Intensity of Rivalry
      14. | | 3.2.3 COVID-19 Impact Analysis
      15. | | | 3.2.3.1 Market Impact Analysis
      16. | | | 3.2.3.2 Regional Impact
      17. | | | 3.2.3.3 Opportunity and Threat Analysis
    4. SECTION IV: QUANTITATIVE ANALYSIS
      1. | 4.1 Healthcare, BY Molecule (USD Billion)
      2. | | 4.1.1 Macromolecular Drugs
      3. | | 4.1.2 Small Molecular Drugs
      4. | | 4.1.3 Lipid Nanoparticles (LNP)
      5. | | 4.1.4 Liposomes
      6. | 4.2 Healthcare, BY Application (USD Billion)
      7. | | 4.2.1 Oncology
      8. | | 4.2.2 Neurology
      9. | | 4.2.3 Autoimmune Diseases
      10. | | 4.2.4 Rare Haematology
      11. | | 4.2.5 Others
      12. | 4.3 Healthcare, BY Distribution Channel (USD Billion)
      13. | | 4.3.1 Hospital Pharmacy
      14. | | 4.3.2 Online Pharmacy
      15. | | 4.3.3 Retail Pharmacy
      16. | 4.4 Healthcare, BY Region (USD Billion)
      17. | | 4.4.1 North America
      18. | | | 4.4.1.1 US
      19. | | | 4.4.1.2 Canada
      20. | | 4.4.2 Europe
      21. | | | 4.4.2.1 Germany
      22. | | | 4.4.2.2 UK
      23. | | | 4.4.2.3 France
      24. | | | 4.4.2.4 Russia
      25. | | | 4.4.2.5 Italy
      26. | | | 4.4.2.6 Spain
      27. | | | 4.4.2.7 Rest of Europe
      28. | | 4.4.3 APAC
      29. | | | 4.4.3.1 China
      30. | | | 4.4.3.2 India
      31. | | | 4.4.3.3 Japan
      32. | | | 4.4.3.4 South Korea
      33. | | | 4.4.3.5 Malaysia
      34. | | | 4.4.3.6 Thailand
      35. | | | 4.4.3.7 Indonesia
      36. | | | 4.4.3.8 Rest of APAC
      37. | | 4.4.4 South America
      38. | | | 4.4.4.1 Brazil
      39. | | | 4.4.4.2 Mexico
      40. | | | 4.4.4.3 Argentina
      41. | | | 4.4.4.4 Rest of South America
      42. | | 4.4.5 MEA
      43. | | | 4.4.5.1 GCC Countries
      44. | | | 4.4.5.2 South Africa
      45. | | | 4.4.5.3 Rest of MEA
    5. SECTION V: COMPETITIVE ANALYSIS
      1. | 5.1 Competitive Landscape
      2. | | 5.1.1 Overview
      3. | | 5.1.2 Competitive Analysis
      4. | | 5.1.3 Market share Analysis
      5. | | 5.1.4 Major Growth Strategy in the Healthcare
      6. | | 5.1.5 Competitive Benchmarking
      7. | | 5.1.6 Leading Players in Terms of Number of Developments in the Healthcare
      8. | | 5.1.7 Key developments and growth strategies
      9. | | | 5.1.7.1 New Product Launch/Service Deployment
      10. | | | 5.1.7.2 Merger & Acquisitions
      11. | | | 5.1.7.3 Joint Ventures
      12. | | 5.1.8 Major Players Financial Matrix
      13. | | | 5.1.8.1 Sales and Operating Income
      14. | | | 5.1.8.2 Major Players R&D Expenditure. 2023
      15. | 5.2 Company Profiles
      16. | | 5.2.1 Amgen (US)
      17. | | | 5.2.1.1 Financial Overview
      18. | | | 5.2.1.2 Products Offered
      19. | | | 5.2.1.3 Key Developments
      20. | | | 5.2.1.4 SWOT Analysis
      21. | | | 5.2.1.5 Key Strategies
      22. | | 5.2.2 Roche (CH)
      23. | | | 5.2.2.1 Financial Overview
      24. | | | 5.2.2.2 Products Offered
      25. | | | 5.2.2.3 Key Developments
      26. | | | 5.2.2.4 SWOT Analysis
      27. | | | 5.2.2.5 Key Strategies
      28. | | 5.2.3 Merck & Co. (US)
      29. | | | 5.2.3.1 Financial Overview
      30. | | | 5.2.3.2 Products Offered
      31. | | | 5.2.3.3 Key Developments
      32. | | | 5.2.3.4 SWOT Analysis
      33. | | | 5.2.3.5 Key Strategies
      34. | | 5.2.4 Pfizer (US)
      35. | | | 5.2.4.1 Financial Overview
      36. | | | 5.2.4.2 Products Offered
      37. | | | 5.2.4.3 Key Developments
      38. | | | 5.2.4.4 SWOT Analysis
      39. | | | 5.2.4.5 Key Strategies
      40. | | 5.2.5 Bristol-Myers Squibb (US)
      41. | | | 5.2.5.1 Financial Overview
      42. | | | 5.2.5.2 Products Offered
      43. | | | 5.2.5.3 Key Developments
      44. | | | 5.2.5.4 SWOT Analysis
      45. | | | 5.2.5.5 Key Strategies
      46. | | 5.2.6 AstraZeneca (GB)
      47. | | | 5.2.6.1 Financial Overview
      48. | | | 5.2.6.2 Products Offered
      49. | | | 5.2.6.3 Key Developments
      50. | | | 5.2.6.4 SWOT Analysis
      51. | | | 5.2.6.5 Key Strategies
      52. | | 5.2.7 Novartis (CH)
      53. | | | 5.2.7.1 Financial Overview
      54. | | | 5.2.7.2 Products Offered
      55. | | | 5.2.7.3 Key Developments
      56. | | | 5.2.7.4 SWOT Analysis
      57. | | | 5.2.7.5 Key Strategies
      58. | | 5.2.8 Eli Lilly and Company (US)
      59. | | | 5.2.8.1 Financial Overview
      60. | | | 5.2.8.2 Products Offered
      61. | | | 5.2.8.3 Key Developments
      62. | | | 5.2.8.4 SWOT Analysis
      63. | | | 5.2.8.5 Key Strategies
      64. | | 5.2.9 Teva Pharmaceutical Industries (IL)
      65. | | | 5.2.9.1 Financial Overview
      66. | | | 5.2.9.2 Products Offered
      67. | | | 5.2.9.3 Key Developments
      68. | | | 5.2.9.4 SWOT Analysis
      69. | | | 5.2.9.5 Key Strategies
      70. | 5.3 Appendix
      71. | | 5.3.1 References
      72. | | 5.3.2 Related Reports
    6. LIST OF FIGURES
      1. | 6.1 MARKET SYNOPSIS
      2. | 6.2 NORTH AMERICA MARKET ANALYSIS
      3. | 6.3 US MARKET ANALYSIS BY MOLECULE
      4. | 6.4 US MARKET ANALYSIS BY APPLICATION
      5. | 6.5 US MARKET ANALYSIS BY DISTRIBUTION CHANNEL
      6. | 6.6 CANADA MARKET ANALYSIS BY MOLECULE
      7. | 6.7 CANADA MARKET ANALYSIS BY APPLICATION
      8. | 6.8 CANADA MARKET ANALYSIS BY DISTRIBUTION CHANNEL
      9. | 6.9 EUROPE MARKET ANALYSIS
      10. | 6.10 GERMANY MARKET ANALYSIS BY MOLECULE
      11. | 6.11 GERMANY MARKET ANALYSIS BY APPLICATION
      12. | 6.12 GERMANY MARKET ANALYSIS BY DISTRIBUTION CHANNEL
      13. | 6.13 UK MARKET ANALYSIS BY MOLECULE
      14. | 6.14 UK MARKET ANALYSIS BY APPLICATION
      15. | 6.15 UK MARKET ANALYSIS BY DISTRIBUTION CHANNEL
      16. | 6.16 FRANCE MARKET ANALYSIS BY MOLECULE
      17. | 6.17 FRANCE MARKET ANALYSIS BY APPLICATION
      18. | 6.18 FRANCE MARKET ANALYSIS BY DISTRIBUTION CHANNEL
      19. | 6.19 RUSSIA MARKET ANALYSIS BY MOLECULE
      20. | 6.20 RUSSIA MARKET ANALYSIS BY APPLICATION
      21. | 6.21 RUSSIA MARKET ANALYSIS BY DISTRIBUTION CHANNEL
      22. | 6.22 ITALY MARKET ANALYSIS BY MOLECULE
      23. | 6.23 ITALY MARKET ANALYSIS BY APPLICATION
      24. | 6.24 ITALY MARKET ANALYSIS BY DISTRIBUTION CHANNEL
      25. | 6.25 SPAIN MARKET ANALYSIS BY MOLECULE
      26. | 6.26 SPAIN MARKET ANALYSIS BY APPLICATION
      27. | 6.27 SPAIN MARKET ANALYSIS BY DISTRIBUTION CHANNEL
      28. | 6.28 REST OF EUROPE MARKET ANALYSIS BY MOLECULE
      29. | 6.29 REST OF EUROPE MARKET ANALYSIS BY APPLICATION
      30. | 6.30 REST OF EUROPE MARKET ANALYSIS BY DISTRIBUTION CHANNEL
      31. | 6.31 APAC MARKET ANALYSIS
      32. | 6.32 CHINA MARKET ANALYSIS BY MOLECULE
      33. | 6.33 CHINA MARKET ANALYSIS BY APPLICATION
      34. | 6.34 CHINA MARKET ANALYSIS BY DISTRIBUTION CHANNEL
      35. | 6.35 INDIA MARKET ANALYSIS BY MOLECULE
      36. | 6.36 INDIA MARKET ANALYSIS BY APPLICATION
      37. | 6.37 INDIA MARKET ANALYSIS BY DISTRIBUTION CHANNEL
      38. | 6.38 JAPAN MARKET ANALYSIS BY MOLECULE
      39. | 6.39 JAPAN MARKET ANALYSIS BY APPLICATION
      40. | 6.40 JAPAN MARKET ANALYSIS BY DISTRIBUTION CHANNEL
      41. | 6.41 SOUTH KOREA MARKET ANALYSIS BY MOLECULE
      42. | 6.42 SOUTH KOREA MARKET ANALYSIS BY APPLICATION
      43. | 6.43 SOUTH KOREA MARKET ANALYSIS BY DISTRIBUTION CHANNEL
      44. | 6.44 MALAYSIA MARKET ANALYSIS BY MOLECULE
      45. | 6.45 MALAYSIA MARKET ANALYSIS BY APPLICATION
      46. | 6.46 MALAYSIA MARKET ANALYSIS BY DISTRIBUTION CHANNEL
      47. | 6.47 THAILAND MARKET ANALYSIS BY MOLECULE
      48. | 6.48 THAILAND MARKET ANALYSIS BY APPLICATION
      49. | 6.49 THAILAND MARKET ANALYSIS BY DISTRIBUTION CHANNEL
      50. | 6.50 INDONESIA MARKET ANALYSIS BY MOLECULE
      51. | 6.51 INDONESIA MARKET ANALYSIS BY APPLICATION
      52. | 6.52 INDONESIA MARKET ANALYSIS BY DISTRIBUTION CHANNEL
      53. | 6.53 REST OF APAC MARKET ANALYSIS BY MOLECULE
      54. | 6.54 REST OF APAC MARKET ANALYSIS BY APPLICATION
      55. | 6.55 REST OF APAC MARKET ANALYSIS BY DISTRIBUTION CHANNEL
      56. | 6.56 SOUTH AMERICA MARKET ANALYSIS
      57. | 6.57 BRAZIL MARKET ANALYSIS BY MOLECULE
      58. | 6.58 BRAZIL MARKET ANALYSIS BY APPLICATION
      59. | 6.59 BRAZIL MARKET ANALYSIS BY DISTRIBUTION CHANNEL
      60. | 6.60 MEXICO MARKET ANALYSIS BY MOLECULE
      61. | 6.61 MEXICO MARKET ANALYSIS BY APPLICATION
      62. | 6.62 MEXICO MARKET ANALYSIS BY DISTRIBUTION CHANNEL
      63. | 6.63 ARGENTINA MARKET ANALYSIS BY MOLECULE
      64. | 6.64 ARGENTINA MARKET ANALYSIS BY APPLICATION
      65. | 6.65 ARGENTINA MARKET ANALYSIS BY DISTRIBUTION CHANNEL
      66. | 6.66 REST OF SOUTH AMERICA MARKET ANALYSIS BY MOLECULE
      67. | 6.67 REST OF SOUTH AMERICA MARKET ANALYSIS BY APPLICATION
      68. | 6.68 REST OF SOUTH AMERICA MARKET ANALYSIS BY DISTRIBUTION CHANNEL
      69. | 6.69 MEA MARKET ANALYSIS
      70. | 6.70 GCC COUNTRIES MARKET ANALYSIS BY MOLECULE
      71. | 6.71 GCC COUNTRIES MARKET ANALYSIS BY APPLICATION
      72. | 6.72 GCC COUNTRIES MARKET ANALYSIS BY DISTRIBUTION CHANNEL
      73. | 6.73 SOUTH AFRICA MARKET ANALYSIS BY MOLECULE
      74. | 6.74 SOUTH AFRICA MARKET ANALYSIS BY APPLICATION
      75. | 6.75 SOUTH AFRICA MARKET ANALYSIS BY DISTRIBUTION CHANNEL
      76. | 6.76 REST OF MEA MARKET ANALYSIS BY MOLECULE
      77. | 6.77 REST OF MEA MARKET ANALYSIS BY APPLICATION
      78. | 6.78 REST OF MEA MARKET ANALYSIS BY DISTRIBUTION CHANNEL
      79. | 6.79 KEY BUYING CRITERIA OF HEALTHCARE
      80. | 6.80 RESEARCH PROCESS OF MRFR
      81. | 6.81 DRO ANALYSIS OF HEALTHCARE
      82. | 6.82 DRIVERS IMPACT ANALYSIS: HEALTHCARE
      83. | 6.83 RESTRAINTS IMPACT ANALYSIS: HEALTHCARE
      84. | 6.84 SUPPLY / VALUE CHAIN: HEALTHCARE
      85. | 6.85 HEALTHCARE, BY MOLECULE, 2024 (% SHARE)
      86. | 6.86 HEALTHCARE, BY MOLECULE, 2024 TO 2035 (USD Billion)
      87. | 6.87 HEALTHCARE, BY APPLICATION, 2024 (% SHARE)
      88. | 6.88 HEALTHCARE, BY APPLICATION, 2024 TO 2035 (USD Billion)
      89. | 6.89 HEALTHCARE, BY DISTRIBUTION CHANNEL, 2024 (% SHARE)
      90. | 6.90 HEALTHCARE, BY DISTRIBUTION CHANNEL, 2024 TO 2035 (USD Billion)
      91. | 6.91 BENCHMARKING OF MAJOR COMPETITORS
    7. LIST OF TABLES
      1. | 7.1 LIST OF ASSUMPTIONS
      2. | | 7.1.1
      3. | 7.2 North America MARKET SIZE ESTIMATES; FORECAST
      4. | | 7.2.1 BY MOLECULE, 2025-2035 (USD Billion)
      5. | | 7.2.2 BY APPLICATION, 2025-2035 (USD Billion)
      6. | | 7.2.3 BY DISTRIBUTION CHANNEL, 2025-2035 (USD Billion)
      7. | 7.3 US MARKET SIZE ESTIMATES; FORECAST
      8. | | 7.3.1 BY MOLECULE, 2025-2035 (USD Billion)
      9. | | 7.3.2 BY APPLICATION, 2025-2035 (USD Billion)
      10. | | 7.3.3 BY DISTRIBUTION CHANNEL, 2025-2035 (USD Billion)
      11. | 7.4 Canada MARKET SIZE ESTIMATES; FORECAST
      12. | | 7.4.1 BY MOLECULE, 2025-2035 (USD Billion)
      13. | | 7.4.2 BY APPLICATION, 2025-2035 (USD Billion)
      14. | | 7.4.3 BY DISTRIBUTION CHANNEL, 2025-2035 (USD Billion)
      15. | 7.5 Europe MARKET SIZE ESTIMATES; FORECAST
      16. | | 7.5.1 BY MOLECULE, 2025-2035 (USD Billion)
      17. | | 7.5.2 BY APPLICATION, 2025-2035 (USD Billion)
      18. | | 7.5.3 BY DISTRIBUTION CHANNEL, 2025-2035 (USD Billion)
      19. | 7.6 Germany MARKET SIZE ESTIMATES; FORECAST
      20. | | 7.6.1 BY MOLECULE, 2025-2035 (USD Billion)
      21. | | 7.6.2 BY APPLICATION, 2025-2035 (USD Billion)
      22. | | 7.6.3 BY DISTRIBUTION CHANNEL, 2025-2035 (USD Billion)
      23. | 7.7 UK MARKET SIZE ESTIMATES; FORECAST
      24. | | 7.7.1 BY MOLECULE, 2025-2035 (USD Billion)
      25. | | 7.7.2 BY APPLICATION, 2025-2035 (USD Billion)
      26. | | 7.7.3 BY DISTRIBUTION CHANNEL, 2025-2035 (USD Billion)
      27. | 7.8 France MARKET SIZE ESTIMATES; FORECAST
      28. | | 7.8.1 BY MOLECULE, 2025-2035 (USD Billion)
      29. | | 7.8.2 BY APPLICATION, 2025-2035 (USD Billion)
      30. | | 7.8.3 BY DISTRIBUTION CHANNEL, 2025-2035 (USD Billion)
      31. | 7.9 Russia MARKET SIZE ESTIMATES; FORECAST
      32. | | 7.9.1 BY MOLECULE, 2025-2035 (USD Billion)
      33. | | 7.9.2 BY APPLICATION, 2025-2035 (USD Billion)
      34. | | 7.9.3 BY DISTRIBUTION CHANNEL, 2025-2035 (USD Billion)
      35. | 7.10 Italy MARKET SIZE ESTIMATES; FORECAST
      36. | | 7.10.1 BY MOLECULE, 2025-2035 (USD Billion)
      37. | | 7.10.2 BY APPLICATION, 2025-2035 (USD Billion)
      38. | | 7.10.3 BY DISTRIBUTION CHANNEL, 2025-2035 (USD Billion)
      39. | 7.11 Spain MARKET SIZE ESTIMATES; FORECAST
      40. | | 7.11.1 BY MOLECULE, 2025-2035 (USD Billion)
      41. | | 7.11.2 BY APPLICATION, 2025-2035 (USD Billion)
      42. | | 7.11.3 BY DISTRIBUTION CHANNEL, 2025-2035 (USD Billion)
      43. | 7.12 Rest of Europe MARKET SIZE ESTIMATES; FORECAST
      44. | | 7.12.1 BY MOLECULE, 2025-2035 (USD Billion)
      45. | | 7.12.2 BY APPLICATION, 2025-2035 (USD Billion)
      46. | | 7.12.3 BY DISTRIBUTION CHANNEL, 2025-2035 (USD Billion)
      47. | 7.13 APAC MARKET SIZE ESTIMATES; FORECAST
      48. | | 7.13.1 BY MOLECULE, 2025-2035 (USD Billion)
      49. | | 7.13.2 BY APPLICATION, 2025-2035 (USD Billion)
      50. | | 7.13.3 BY DISTRIBUTION CHANNEL, 2025-2035 (USD Billion)
      51. | 7.14 China MARKET SIZE ESTIMATES; FORECAST
      52. | | 7.14.1 BY MOLECULE, 2025-2035 (USD Billion)
      53. | | 7.14.2 BY APPLICATION, 2025-2035 (USD Billion)
      54. | | 7.14.3 BY DISTRIBUTION CHANNEL, 2025-2035 (USD Billion)
      55. | 7.15 India MARKET SIZE ESTIMATES; FORECAST
      56. | | 7.15.1 BY MOLECULE, 2025-2035 (USD Billion)
      57. | | 7.15.2 BY APPLICATION, 2025-2035 (USD Billion)
      58. | | 7.15.3 BY DISTRIBUTION CHANNEL, 2025-2035 (USD Billion)
      59. | 7.16 Japan MARKET SIZE ESTIMATES; FORECAST
      60. | | 7.16.1 BY MOLECULE, 2025-2035 (USD Billion)
      61. | | 7.16.2 BY APPLICATION, 2025-2035 (USD Billion)
      62. | | 7.16.3 BY DISTRIBUTION CHANNEL, 2025-2035 (USD Billion)
      63. | 7.17 South Korea MARKET SIZE ESTIMATES; FORECAST
      64. | | 7.17.1 BY MOLECULE, 2025-2035 (USD Billion)
      65. | | 7.17.2 BY APPLICATION, 2025-2035 (USD Billion)
      66. | | 7.17.3 BY DISTRIBUTION CHANNEL, 2025-2035 (USD Billion)
      67. | 7.18 Malaysia MARKET SIZE ESTIMATES; FORECAST
      68. | | 7.18.1 BY MOLECULE, 2025-2035 (USD Billion)
      69. | | 7.18.2 BY APPLICATION, 2025-2035 (USD Billion)
      70. | | 7.18.3 BY DISTRIBUTION CHANNEL, 2025-2035 (USD Billion)
      71. | 7.19 Thailand MARKET SIZE ESTIMATES; FORECAST
      72. | | 7.19.1 BY MOLECULE, 2025-2035 (USD Billion)
      73. | | 7.19.2 BY APPLICATION, 2025-2035 (USD Billion)
      74. | | 7.19.3 BY DISTRIBUTION CHANNEL, 2025-2035 (USD Billion)
      75. | 7.20 Indonesia MARKET SIZE ESTIMATES; FORECAST
      76. | | 7.20.1 BY MOLECULE, 2025-2035 (USD Billion)
      77. | | 7.20.2 BY APPLICATION, 2025-2035 (USD Billion)
      78. | | 7.20.3 BY DISTRIBUTION CHANNEL, 2025-2035 (USD Billion)
      79. | 7.21 Rest of APAC MARKET SIZE ESTIMATES; FORECAST
      80. | | 7.21.1 BY MOLECULE, 2025-2035 (USD Billion)
      81. | | 7.21.2 BY APPLICATION, 2025-2035 (USD Billion)
      82. | | 7.21.3 BY DISTRIBUTION CHANNEL, 2025-2035 (USD Billion)
      83. | 7.22 South America MARKET SIZE ESTIMATES; FORECAST
      84. | | 7.22.1 BY MOLECULE, 2025-2035 (USD Billion)
      85. | | 7.22.2 BY APPLICATION, 2025-2035 (USD Billion)
      86. | | 7.22.3 BY DISTRIBUTION CHANNEL, 2025-2035 (USD Billion)
      87. | 7.23 Brazil MARKET SIZE ESTIMATES; FORECAST
      88. | | 7.23.1 BY MOLECULE, 2025-2035 (USD Billion)
      89. | | 7.23.2 BY APPLICATION, 2025-2035 (USD Billion)
      90. | | 7.23.3 BY DISTRIBUTION CHANNEL, 2025-2035 (USD Billion)
      91. | 7.24 Mexico MARKET SIZE ESTIMATES; FORECAST
      92. | | 7.24.1 BY MOLECULE, 2025-2035 (USD Billion)
      93. | | 7.24.2 BY APPLICATION, 2025-2035 (USD Billion)
      94. | | 7.24.3 BY DISTRIBUTION CHANNEL, 2025-2035 (USD Billion)
      95. | 7.25 Argentina MARKET SIZE ESTIMATES; FORECAST
      96. | | 7.25.1 BY MOLECULE, 2025-2035 (USD Billion)
      97. | | 7.25.2 BY APPLICATION, 2025-2035 (USD Billion)
      98. | | 7.25.3 BY DISTRIBUTION CHANNEL, 2025-2035 (USD Billion)
      99. | 7.26 Rest of South America MARKET SIZE ESTIMATES; FORECAST
      100. | | 7.26.1 BY MOLECULE, 2025-2035 (USD Billion)
      101. | | 7.26.2 BY APPLICATION, 2025-2035 (USD Billion)
      102. | | 7.26.3 BY DISTRIBUTION CHANNEL, 2025-2035 (USD Billion)
      103. | 7.27 MEA MARKET SIZE ESTIMATES; FORECAST
      104. | | 7.27.1 BY MOLECULE, 2025-2035 (USD Billion)
      105. | | 7.27.2 BY APPLICATION, 2025-2035 (USD Billion)
      106. | | 7.27.3 BY DISTRIBUTION CHANNEL, 2025-2035 (USD Billion)
      107. | 7.28 GCC Countries MARKET SIZE ESTIMATES; FORECAST
      108. | | 7.28.1 BY MOLECULE, 2025-2035 (USD Billion)
      109. | | 7.28.2 BY APPLICATION, 2025-2035 (USD Billion)
      110. | | 7.28.3 BY DISTRIBUTION CHANNEL, 2025-2035 (USD Billion)
      111. | 7.29 South Africa MARKET SIZE ESTIMATES; FORECAST
      112. | | 7.29.1 BY MOLECULE, 2025-2035 (USD Billion)
      113. | | 7.29.2 BY APPLICATION, 2025-2035 (USD Billion)
      114. | | 7.29.3 BY DISTRIBUTION CHANNEL, 2025-2035 (USD Billion)
      115. | 7.30 Rest of MEA MARKET SIZE ESTIMATES; FORECAST
      116. | | 7.30.1 BY MOLECULE, 2025-2035 (USD Billion)
      117. | | 7.30.2 BY APPLICATION, 2025-2035 (USD Billion)
      118. | | 7.30.3 BY DISTRIBUTION CHANNEL, 2025-2035 (USD Billion)
      119. | 7.31 PRODUCT LAUNCH/PRODUCT DEVELOPMENT/APPROVAL
      120. | | 7.31.1
      121. | 7.32 ACQUISITION/PARTNERSHIP
      122. | | 7.32.1

    Global Outlook (USD Billion,2019-2035)

    Global Pegylated Drugs, By Molecule (USD Billion,2019-2035)

    • Macromolecular Drugs
      • Protein and Peptide
      • Enzyme
      • Aptamer
    • Small Molecular Drugs
    • Lipid Nanoparticles (LNP) and Liposomes

    Global Pegylated Drugs, By Application (USD Billion,2019-2035)

    • Oncology
    • Neurology
    • Autoimmune Diseases   
    • Haematology
    • Others

    Global Pegylated Drugs, By Distribution Channel (USD Billion,2019-2035)

    • Hospital Pharmacy     
    • Online Pharmacy   
    • Retail Pharmacy 

    North America Outlook (USD Billion,2019-2035)

    North America Pegylated Drugs, By Molecule (USD Billion,2019-2035)

    • Macromolecular Drugs
      • Protein and Peptide
      • Enzyme
      • Aptamer
    • Small Molecular Drugs
    • Lipid Nanoparticles (LNP) and Liposomes

    North America Pegylated Drugs, By Application (USD Billion,2019-2035)

    • Oncology
    • Neurology
    • Autoimmune Diseases   
    • Haematology
    • Others

    North America Pegylated Drugs, By Distribution Channel (USD Billion,2019-2035)

    • Hospital Pharmacy     
    • Online Pharmacy   
    • Retail Pharmacy 

    US Outlook (USD Billion,2019-2035)

    US Pegylated Drugs, By Molecule (USD Billion,2019-2035)

    • Macromolecular Drugs
      • Protein and Peptide
      • Enzyme
      • Aptamer
    • Small Molecular Drugs
    • Lipid Nanoparticles (LNP) and Liposomes

    US Pegylated Drugs, By Application (USD Billion,2019-2035)

    • Oncology
    • Neurology
    • Autoimmune Diseases   
    • Haematology
    • Others

    US Pegylated Drugs, By Distribution Channel (USD Billion,2019-2035)

    • Hospital Pharmacy     
    • Online Pharmacy   
    • Retail Pharmacy 

    Canada Outlook (USD Billion,2019-2035)

    Canada Pegylated Drugs, By Molecule (USD Billion,2019-2035)

    • Macromolecular Drugs
      • Protein and Peptide
      • Enzyme
      • Aptamer
    • Small Molecular Drugs
    • Lipid Nanoparticles (LNP) and Liposomes

    Canada Pegylated Drugs, By Application (USD Billion,2019-2035)

    • Oncology
    • Neurology
    • Autoimmune Diseases   
    • Haematology
    • Others

    Canada Pegylated Drugs, By Distribution Channel (USD Billion,2019-2035)

    • Hospital Pharmacy     
    • Online Pharmacy   
    • Retail Pharmacy 

    Europe Outlook (USD Billion,2019-2035)

    Europe Pegylated Drugs, By Molecule (USD Billion,2019-2035)

    • Macromolecular Drugs
      • Protein and Peptide
      • Enzyme
      • Aptamer
    • Small Molecular Drugs
    • Lipid Nanoparticles (LNP) and Liposomes

    Europe Pegylated Drugs, By Application (USD Billion,2019-2035)

    • Oncology
    • Neurology
    • Autoimmune Diseases   
    • Haematology
    • Others

    Europe Pegylated Drugs, By Distribution Channel (USD Billion,2019-2035)

    • Hospital Pharmacy     
    • Online Pharmacy   
    • Retail Pharmacy 

    Germany Outlook (USD Billion,2019-2035)

    Germany Pegylated Drugs, By Molecule (USD Billion,2019-2035)

    • Macromolecular Drugs
      • Protein and Peptide
      • Enzyme
      • Aptamer
    • Small Molecular Drugs
    • Lipid Nanoparticles (LNP) and Liposomes

    Germany Pegylated Drugs, By Application (USD Billion,2019-2035)

    • Oncology
    • Neurology
    • Autoimmune Diseases   
    • Haematology
    • Others

    Germany Pegylated Drugs, By Distribution Channel (USD Billion,2019-2035)

    • Hospital Pharmacy     
    • Online Pharmacy   
    • Retail Pharmacy 

    France Outlook (USD Billion,2019-2035)

    France Pegylated Drugs, By Molecule (USD Billion,2019-2035)

    • Macromolecular Drugs
      • Protein and Peptide
      • Enzyme
      • Aptamer
    • Small Molecular Drugs
    • Lipid Nanoparticles (LNP) and Liposomes

    France Pegylated Drugs, By Application (USD Billion,2019-2035)

    • Oncology
    • Neurology
    • Autoimmune Diseases   
    • Haematology
    • Others

    France Pegylated Drugs, By Distribution Channel (USD Billion,2019-2035)

    • Hospital Pharmacy     
    • Online Pharmacy   
    • Retail Pharmacy 

    UK Outlook (USD Billion,2019-2035)

    UK Pegylated Drugs, By Molecule (USD Billion,2019-2035)

    • Macromolecular Drugs
      • Protein and Peptide
      • Enzyme
      • Aptamer
    • Small Molecular Drugs
    • Lipid Nanoparticles (LNP) and Liposomes

    UK Pegylated Drugs, By Application (USD Billion,2019-2035)

    • Oncology
    • Neurology
    • Autoimmune Diseases   
    • Haematology
    • Others

    UK Pegylated Drugs, By Distribution Channel (USD Billion,2019-2035)

    • Hospital Pharmacy     
    • Online Pharmacy   
    • Retail Pharmacy 

    Italy Outlook (USD Billion,2019-2035)

    Italy Pegylated Drugs, By Molecule (USD Billion,2019-2035)

    • Macromolecular Drugs
      • Protein and Peptide
      • Enzyme
      • Aptamer
    • Small Molecular Drugs
    • Lipid Nanoparticles (LNP) and Liposomes

    Italy Pegylated Drugs, By Application (USD Billion,2019-2035)

    • Oncology
    • Neurology
    • Autoimmune Diseases   
    • Haematology
    • Others

    Italy Pegylated Drugs, By Distribution Channel (USD Billion,2019-2035)

    • Hospital Pharmacy     
    • Online Pharmacy   
    • Retail Pharmacy 

    Spain Outlook (USD Billion,2019-2035)

    Spain Pegylated Drugs, By Molecule (USD Billion,2019-2035)

    • Macromolecular Drugs
      • Protein and Peptide
      • Enzyme
      • Aptamer
    • Small Molecular Drugs
    • Lipid Nanoparticles (LNP) and Liposomes

    Spain Pegylated Drugs, By Application (USD Billion,2019-2035)

    • Oncology
    • Neurology
    • Autoimmune Diseases   
    • Haematology
    • Others

    Spain Pegylated Drugs, By Distribution Channel (USD Billion,2019-2035)

    • Hospital Pharmacy     
    • Online Pharmacy   
    • Retail Pharmacy 

    Rest of Europe Outlook (USD Billion,2019-2035)

    Rest of Europe Pegylated Drugs, By Molecule (USD Billion,2019-2035)

    • Macromolecular Drugs
      • Protein and Peptide
      • Enzyme
      • Aptamer
    • Small Molecular Drugs
    • Lipid Nanoparticles (LNP) and Liposomes

    Rest of Europe Pegylated Drugs, By Application (USD Billion,2019-2035)

    • Oncology
    • Neurology
    • Autoimmune Diseases   
    • Haematology
    • Others

    Rest of Europe Pegylated Drugs, By Distribution Channel (USD Billion,2019-2035)

    • Hospital Pharmacy     
    • Online Pharmacy   
    • Retail Pharmacy 

    Asia-Pacific Outlook (USD Billion,2019-2035)

    Asia-Pacific Pegylated Drugs, By Molecule (USD Billion,2019-2035)

    • Macromolecular Drugs
      • Protein and Peptide
      • Enzyme
      • Aptamer
    • Small Molecular Drugs
    • Lipid Nanoparticles (LNP) and Liposomes

    Asia-Pacific Pegylated Drugs, By Application (USD Billion,2019-2035)

    • Oncology
    • Neurology
    • Autoimmune Diseases   
    • Haematology
    • Others

    Asia-Pacific Pegylated Drugs, By Distribution Channel (USD Billion,2019-2035)

    • Hospital Pharmacy     
    • Online Pharmacy   
    • Retail Pharmacy 

    China Outlook (USD Billion,2019-2035)

    China Pegylated Drugs, By Molecule (USD Billion,2019-2035)

    • Macromolecular Drugs
      • Protein and Peptide
      • Enzyme
      • Aptamer
    • Small Molecular Drugs
    • Lipid Nanoparticles (LNP) and Liposomes

    China Pegylated Drugs, By Application (USD Billion,2019-2035)

    • Oncology
    • Neurology
    • Autoimmune Diseases   
    • Haematology
    • Others

    China Pegylated Drugs, By Distribution Channel (USD Billion,2019-2035)

    • Hospital Pharmacy     
    • Online Pharmacy   
    • Retail Pharmacy 

    India Outlook (USD Billion,2019-2035)

    India Pegylated Drugs, By Molecule (USD Billion,2019-2035)

    • Macromolecular Drugs
      • Protein and Peptide
      • Enzyme
      • Aptamer
    • Small Molecular Drugs
    • Lipid Nanoparticles (LNP) and Liposomes

    India Pegylated Drugs, By Application (USD Billion,2019-2035)

    • Oncology
    • Neurology
    • Autoimmune Diseases   
    • Haematology
    • Others

    India Pegylated Drugs, By Distribution Channel (USD Billion,2019-2035)

    • Hospital Pharmacy     
    • Online Pharmacy   
    • Retail Pharmacy 

    Japan Outlook (USD Billion,2019-2035)

    Japan Pegylated Drugs, By Molecule (USD Billion,2019-2035)

    • Macromolecular Drugs
      • Protein and Peptide
      • Enzyme
      • Aptamer
    • Small Molecular Drugs
    • Lipid Nanoparticles (LNP) and Liposomes

    Japan Pegylated Drugs, By Application (USD Billion,2019-2035)

    • Oncology
    • Neurology
    • Autoimmune Diseases   
    • Haematology
    • Others

    Japan Pegylated Drugs, By Distribution Channel (USD Billion,2019-2035)

    • Hospital Pharmacy     
    • Online Pharmacy   
    • Retail Pharmacy 

    Australia Outlook (USD Billion,2019-2035)

    Australia Pegylated Drugs, By Molecule (USD Billion,2019-2035)

    • Macromolecular Drugs
      • Protein and Peptide
      • Enzyme
      • Aptamer
    • Small Molecular Drugs
    • Lipid Nanoparticles (LNP) and Liposomes

    Australia Pegylated Drugs, By Application (USD Billion,2019-2035)

    • Oncology
    • Neurology
    • Autoimmune Diseases   
    • Haematology
    • Others

    Australia Pegylated Drugs, By Distribution Channel (USD Billion,2019-2035)

    • Hospital Pharmacy     
    • Online Pharmacy   
    • Retail Pharmacy 

    South Korea Outlook (USD Billion,2019-2035)

    South Korea Pegylated Drugs, By Molecule (USD Billion,2019-2035)

    • Macromolecular Drugs
      • Protein and Peptide
      • Enzyme
      • Aptamer
    • Small Molecular Drugs
    • Lipid Nanoparticles (LNP) and Liposomes

    South Korea Pegylated Drugs, By Application (USD Billion,2019-2035)

    • Oncology
    • Neurology
    • Autoimmune Diseases   
    • Haematology
    • Others

    South Korea Pegylated Drugs, By Distribution Channel (USD Billion,2019-2035)

    • Hospital Pharmacy     
    • Online Pharmacy   
    • Retail Pharmacy 

    Rest of Asia-Pacific Outlook (USD Billion,2019-2035)

    Rest of Asia-Pacific Pegylated Drugs, By Molecule (USD Billion,2019-2035)

    • Macromolecular Drugs
      • Protein and Peptide
      • Enzyme
      • Aptamer
    • Small Molecular Drugs
    • Lipid Nanoparticles (LNP) and Liposomes

    Rest of Asia-Pacific Pegylated Drugs, By Application (USD Billion,2019-2035)

    • Oncology
    • Neurology
    • Autoimmune Diseases   
    • Haematology
    • Others

    Rest of Asia-Pacific Pegylated Drugs, By Distribution Channel (USD Billion,2019-2035)

    • Hospital Pharmacy     
    • Online Pharmacy   
    • Retail Pharmacy 

    Rest of the World Outlook (USD Billion,2019-2035)

    Rest of the World Pegylated Drugs, By Molecule (USD Billion,2019-2035)

    • Macromolecular Drugs
      • Protein and Peptide
      • Enzyme
      • Aptamer
    • Small Molecular Drugs
    • Lipid Nanoparticles (LNP) and Liposomes

    Rest of the World Pegylated Drugs, By Application (USD Billion,2019-2035)

    • Oncology
    • Neurology
    • Autoimmune Diseases   
    • Haematology
    • Others

    Rest of the World Pegylated Drugs, By Distribution Channel (USD Billion,2019-2035)

    • Hospital Pharmacy     
    • Online Pharmacy   
    • Retail Pharmacy 

    Middle East & Africa Outlook (USD Billion,2019-2035)

    Middle East & Africa Pegylated Drugs, By Molecule (USD Billion,2019-2035)

    • Macromolecular Drugs
      • Protein and Peptide
      • Enzyme
      • Aptamer
    • Small Molecular Drugs
    • Lipid Nanoparticles (LNP) and Liposomes

    Middle East & Africa Pegylated Drugs, By Application (USD Billion,2019-2035)

    • Oncology
    • Neurology
    • Autoimmune Diseases   
    • Haematology
    • Others

    Middle East & Africa Pegylated Drugs, By Distribution Channel (USD Billion,2019-2035)

    • Hospital Pharmacy     
    • Online Pharmacy   
    • Retail Pharmacy 

    South America Outlook (USD Billion,2019-2035)

    South America Pegylated Drugs, By Molecule (USD Billion,2019-2035)

    • Macromolecular Drugs
      • Protein and Peptide
      • Enzyme
      • Aptamer
    • Small Molecular Drugs
    • Lipid Nanoparticles (LNP) and Liposomes

    South America Pegylated Drugs, By Application (USD Billion,2019-2035)

    • Oncology
    • Neurology
    • Autoimmune Diseases   
    • Haematology
    • Others

    South America Pegylated Drugs, By Distribution Channel (USD Billion,2019-2035)

    • Hospital Pharmacy     
    • Online Pharmacy   
    • Retail Pharmacy 
    Infographic

    Free Sample Request

    Kindly complete the form below to receive a free sample of this Report

    Get Free Sample

    Customer Strories

    “I am very pleased with how market segments have been defined in a relevant way for my purposes (such as "Portable Freezers & refrigerators" and "last-mile"). In general the report is well structured. Thanks very much for your efforts.”

    Victoria Milne

    Founder
    Case Study
    Chemicals and Materials

    Compare Licence

    ×
    Features License Type
    Single User Multiuser License Enterprise User
    Price $4,950 $5,950 $7,250
    Maximum User Access Limit 1 User Upto 10 Users Unrestricted Access Throughout the Organization
    Free Customization
    Direct Access to Analyst
    Deliverable Format
    Platform Access
    Discount on Next Purchase 10% 15% 15%
    Printable Versions