• Cat-intel
  • MedIntelliX
  • Resources
  • About Us
  • Hero Background
    English
    Chinese
    French
    Japanese
    Korean
    German
    Spanish

    Nuclear waste management Market Trends

    ID: MRFR/E&P/5759-CR
    143 Pages
    Anshula Mandaokar
    May 2022

    Nuclear Waste Management Market Research Report Information By Waste Type (Low-Level Waste, Intermediate-Level Waste and High-Level Waste), By Reactor Type (Pressurized Water Reactor, Boiling Water Reactors, Gas-Cooled Reactors and Pressurized Heavy Water Reactor), By Application (Industrial and Utility), Disposal method (Incineration, Storage, Deep Geological Disposal, Others) and By Region (N...

    Share:
    Download PDF ×

    We do not share your information with anyone. However, we may send you emails based on your report interest from time to time. You may contact us at any time to opt-out.

    Nuclear waste management Market Infographic
    Purchase Options

    Market Trends

    Key Emerging Trends in the Nuclear waste management Market

    The market trends in nuclear waste management have passed through exceptional shifts in current years, driven by a confluence of factors that replicate the evolving panorama of the nuclear enterprise. As concerns over environmental sustainability and the lengthy-term impact of nuclear strength have gained prominence, the nuclear waste management market has skilled a developing emphasis on progressive solutions and technologies. One giant trend inside the market is the increasing adoption of advanced disposal methods. Traditional methods of nuclear waste disposal, along with deep geological repositories, stay imperative, but there may be a discernible shift towards exploring opportunity approaches. Innovations in technology like advanced reprocessing and partitioning have received traction, promising more efficient and environmentally friendly methods to handle nuclear waste. This fashion aligns with a broader industry push toward minimizing the environmental footprint of nuclear strength. Another noteworthy development is the upward thrust of international collaborations in nuclear waste control. Recognizing the global nature of nuclear energy and its waste, international locations are increasingly engaging in cooperative efforts to address commonplace challenges. This collaborative approach includes the sharing of expertise, know-how, and resources, fostering a greater unified and effective reaction to nuclear waste control on a global scale. Such partnerships also make a contribution to the establishment of standardized practices and policies, selling protection and responsibility across borders. Public attention and stakeholder engagement are playing an increasingly pivotal role in shaping market dynamics. Concerns and debates surrounding nuclear waste management have brought about a greater emphasis on transparency, communique, and network involvement. Companies and government organizations worried about nuclear waste control are actively seeking to teach the public about their techniques, protection measures, and the overall impact of their sports. This fashion displays a broader societal shift closer to annoying duty and accountable management of nuclear waste. Regulatory frameworks are evolving in response to the converting landscape of nuclear waste control. Governments and worldwide groups are revisiting and updating regulations to address rising demanding situations and ensure the safe and effective management of nuclear waste. In conclusion, the market developments in nuclear waste management underscore a dynamic and adaptive enterprise responding to the demanding situations and possibilities related to the nuclear electricity region. From the exploration of superior disposal strategies to expanded global collaboration, investments in waste minimization technology, heightened public engagement, and evolving regulatory frameworks, the nuclear waste management marketplace is witnessing a transformative phase that reflects a commitment to sustainability and responsible stewardship of nuclear sources.

    Author
    Anshula Mandaokar
    Team Lead - Research

    Anshula Mandaokar holds an academic degree in Chemical Engineering and has been contributing to the field for more than 5 years. She has expertise in Market Research and Business Consulting and serves as a Team Lead for a reputed Market Research firm under the Chemicals and Materials domain spectrum. She has worked on multiple projects, generating explicit results in a quick turnaround time. Her understanding of data interpretation justifies her role as a leader.

    Leave a Comment

    FAQs

    How much is the nuclear waste management market?

    The nuclear waste management market size was expected to be USD 4.84 billion in 2023.

    What is the growth rate of the nuclear waste management market?

    The market for nuclear waste management is expected to register a CAGR of 1.69% over the next ten years.

    Which region held the largest market share in the nuclear waste management market?

    North America held the largest market share in the nuclear waste management market.

    Who are the key players in the nuclear waste management market?

    Enercon (US), Veolia (France), US Ecology Inc. (US), Posiva Oy (Finland), Stericycle Inc. (US), John Wood Group PLC (UK), Perma-Fix (US), Bechtel Corporation (US), Fluor Corporation (US) are the key players in the market for nuclear waste management.

    Which waste type led the nuclear waste management market?

    The high-level waste category led the segment in the nuclear waste management market.

    Which application category had the largest market share in the nuclear waste management market?

    The utility category had the largest market share in the nuclear waste management market.

    Market Summary

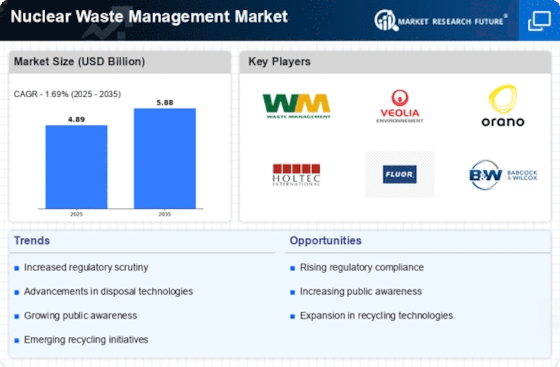
    As per Market Research Future Analysis, the Global Nuclear Waste Management Market was valued at USD 4.89 billion in 2024 and is projected to grow to USD 5.88 billion by 2035, with a CAGR of 1.69% from 2025 to 2035. The market is driven by stringent regulations on radioactive emissions and increased investments in nuclear power projects, alongside numerous nuclear decommissioning initiatives. The high-level waste segment, which constitutes only 3% of total nuclear waste but contains 95% of its radioactivity, is expected to be the fastest-growing segment. North America leads the market, accounting for USD 4.89 billion in 2024, with a projected CAGR of 43.10%.

    Key Market Trends & Highlights

    Key trends influencing the nuclear waste management market include increased military funding and the need for safe disposal methods.

    • Governments spent $72.6 billion on nuclear weapons in 2020, driving demand for waste management.
    • High-level waste requires long-term geological disposal due to its extreme radioactivity.
    • North America is expected to exhibit a 43.10% CAGR during the forecast period.

    Market Size & Forecast

    2024 Market Size USD 4.89 Billion
    2035 Market Size USD 5.88 Billion
    CAGR (2024-2035) 1.69%
    Largest Regional Market Share in 2021 North America

    Major Players

    Key players include Enercon (US), Veolia (France), US Ecology Inc. (US), Posiva Oy (Finland), Stericycle Inc. (US), and Bechtel Corporation (US).

    Market Trends

    Creation of nuclear weapons to propel the market growth

    Governments around the world are increasing funding for military expenditures due to growing worries about national security. Countries like the US, China, Russia, France, the UK, India, Israel, South Korea, and Iran have developed nuclear weapons to better strengthen their armed forces. By the beginning of 2021, there were roughly 13,000 nuclear weapons worldwide, down from 13,400 in 2020 when some of the warheads were retired. The anticipated number of weapons deployed with operational troops has climbed from 3,720 to 3,825 during the past year, despite a drop in the quantity of nuclear weapons. 

    The nuclear powers spent $72.6 billion on nuclear weapons in 2020, up US$1.4 billion from the previous year, according to the International Campaign to Abolish Nuclear Weapons (ICAN). There is enough low- and intermediate-level radioactive waste produced during the development and destruction of nuclear weapons. As a result, the market for nuclear waste management is developing as nuclear weapons are being developed and decommissioned at an increasing rate. Thus, this factor is driving the market CAGR.

    Furthermore, the manufacturing of nuclear weapons for national defense and as fuel for nuclear power plants are only two examples of the various sectors that use radiation. These processes produce radioactive waste, which needs to be disposed of in a safe and efficient manner. The high-level nuclear waste must be disposed of in order to keep it safely separated for a very long time because it will continue to be extremely radioactive for tens of thousands of years. Due to the absence of a method for disposal in a repository, waste may need to be stored permanently.

    However, management of nuclear waste aids in the long-term disposal of this material.

    Additionally, high-level, transuranic, and low-level waste are the three main categories of nuclear waste, and each category needs to be disposed of differently depending on the harm it poses to the environment and to human health. More money must be invested in nuclear power projects due to the strict norms and regulations being put in place to limit hazardous nuclear emissions worldwide. The treatment and disposal of radioactive waste from the US nuclear weapons programme are under the Department of Energy's (DOE) control. 

    The nation's commercial nuclear power facilities have over 85,000 metric tonnes of spent nuclear fuel. This high-level trash must be disposed of by the DOE in a long-term geologic repository. Because utilities failed to properly dispose of the garbage, the US federal government has already paid billions of dollars in damages to them and may still owe tens of billions of dollars in future decades. Federal law requires that certain kinds of high-level mixed waste be vitrified, or immobilized in glass, and disposed of in a deep geologic deposit.

    Thus, it is anticipated that this aspect will accelerate nuclear waste management market revenue globally.

    The ongoing evolution of regulatory frameworks and technological advancements in nuclear waste management appears to be fostering a more sustainable approach to handling radioactive materials, thereby enhancing public safety and environmental protection.

    U.S. Nuclear Regulatory Commission

    Nuclear waste management Market Market Drivers

    Investment in Infrastructure Development

    Investment in infrastructure development is a key driver of the Global Nuclear Waste Management Market Industry. Governments and private entities are allocating substantial resources to build and upgrade facilities for waste storage and disposal. This investment is essential for ensuring that nuclear waste is managed safely and effectively. For example, the construction of new storage facilities and the enhancement of existing ones are critical to accommodating the growing volume of nuclear waste. As infrastructure improves, the market is poised for growth, aligning with the projected increase to 5.97 USD Billion by 2035.

    Regulatory Compliance and Safety Standards

    The Global Nuclear Waste Management Market Industry is heavily influenced by stringent regulatory frameworks and safety standards established by governmental bodies. Countries are increasingly adopting comprehensive regulations to ensure the safe disposal and management of nuclear waste. For instance, the International Atomic Energy Agency (IAEA) provides guidelines that nations follow to mitigate risks associated with nuclear waste. As a result, the market is projected to reach 4.89 USD Billion in 2024, reflecting a growing emphasis on compliance and safety in nuclear waste management practices.

    Public Awareness and Environmental Concerns

    Growing public awareness regarding environmental issues is significantly impacting the Global Nuclear Waste Management Market Industry. Citizens are increasingly concerned about the long-term effects of nuclear waste on ecosystems and human health. This heightened awareness has led to demands for more transparent waste management practices and sustainable solutions. Governments are responding by implementing more rigorous waste management policies and engaging with communities to address their concerns. Consequently, the market is likely to experience a compound annual growth rate (CAGR) of 1.84% from 2025 to 2035, as stakeholders prioritize environmental sustainability.

    Technological Advancements in Waste Treatment

    Innovations in waste treatment technologies are driving the Global Nuclear Waste Management Market Industry forward. Advanced methods such as deep geological repositories and partitioning and transmutation techniques are being developed to enhance waste management efficiency. These technologies not only improve safety but also reduce the long-term environmental impact of nuclear waste. As nations invest in research and development, the market is expected to grow, with projections indicating an increase to 5.97 USD Billion by 2035. This growth underscores the importance of technological advancements in addressing the challenges of nuclear waste.

    International Collaboration and Knowledge Sharing

    International collaboration plays a crucial role in shaping the Global Nuclear Waste Management Market Industry. Countries are increasingly sharing knowledge and best practices to tackle the challenges associated with nuclear waste. Initiatives such as the Global Nuclear Energy Partnership facilitate cooperation among nations, promoting the exchange of technology and expertise. This collaborative approach not only enhances the effectiveness of waste management strategies but also fosters innovation. As a result, the market is expected to benefit from shared resources and collective efforts, leading to improved outcomes in nuclear waste management.

    Market Segment Insights

    Nuclear Waste Management Waste Type Insights

    The Nuclear Waste Management Market segmentation has been segmented by waste type into Low-Level Waste, Intermediate-Level Waste and High-Level Waste. The high-level waste segment dominated the market growth for nuclear waste management in 2021 and is projected to be the faster-growing segment during the forecast period, 2022-2030. 

    High-level waste only makes up 3% of the entire amount of nuclear waste, yet it includes 95% of the radioactive material. While low-level waste accounts for 90% of the entire volume, it contains only 1% radioactive material. While low-level waste can be managed without shielding, high-level waste needs cooling and shielding.

    Nuclear Waste Management Reactor Type Insights

    The Nuclear Waste Management Market segmentation, based on reactor type, Pressurized Water Reactor, Boiling Water Reactors, Gas-Cooled Reactors and Pressurized Heavy Water Reactor. The pressurized heavy water reactor segment dominated the nuclear waste management market revenue in 2021 and is projected to be the faster-growing segment during the forecast period, 2022-2030. Since the 1950s, the CANDU PHWR reactor has been developed in Canada. 

    Since the 1980s, it has been developed in India. The moderator needed for PHWRs is typically heavy water (D2O), but with the CANDU system, the moderator is enriched (i.e., water) rather than the fuel—a cost trade-off. PHWRs typically use natural uranium oxide as fuel.

    Nuclear Waste Management Application Insights

    The Nuclear Waste Management Market data, based on application, Industrial and Utility. The utility segment dominated the nuclear waste management market revenue in 2021 and is projected to be the faster-growing segment during the forecast period, 2022-2030. Nuclear fuel has been used to produce power for around five years. After that, it is removed and securely held until a location for long-term disposal is identified. A nuclear reactor generates and regulates the release of energy that results from splitting the atoms of specific elements.

    Nuclear power reactors release energy that is used as heat to produce steam, which is then used to produce electricity.

    Get more detailed insights about Nuclear Waste Management Market Research Report—Global Forecast till 2035

    Regional Insights

    By region, the study provides the market insights for nuclear waste management into North America, Europe, Asia-Pacific, and the Rest of the World. North America nuclear waste management market accounted for USD 2.5 billion in 2021 and is expected to exhibit a 43.10% CAGR during the study period. 

    There are numerous chances for considerable growth in the nuclear waste management market in North America during the forecast period because to the region's established infrastructure and key players. Furthermore, these main firms are actively collaborating with the regional energy regulatory commissions and key safety industry standard-setting bodies to promote the expansion of the nuclear waste management business.

    Further, the major countries studied in the market report for nuclear waste management are: The U.S., Canada, Germany, France, the UK, Italy, Spain, China, Japan, India, Australia, South Korea, and Brazil.

    Figure 3: Nuclear Waste Management Market Share By Region 2021 (%)

    Source: Secondary Research, Primary Research, Market Research Future Database and Analyst Review

    Europe nuclear waste management market is expected to grow at a significant CAGR from 2022 to 2030. Although production of wasted fuel in the European Union (EU) has varied considerably, on average, it increased annually by 1.5 percent, amounting to 3,300 tonnes of heavy metal (tHM). 

    The rise in electricity generated by nuclear power plants as capacity and demand increased was the main cause of this increase (nuclear electricity production increased at an annual average rate of 1.3 percent over the same period). Further, the UK nuclear waste management market held the largest market share, and the Germany nuclear waste management market was the fastest-growing market in the region.

    Asia Pacific nuclear waste management market accounts for the second-fastest growing market share. A number of developing nations, like China and India, who are among the top 10 nuclear power producers, call this region home. Over the projection period, the market will develop as nuclear generation capacity increases and these economies' demand for electricity rises. Moreover, China nuclear waste management market held the largest market share, and the India nuclear waste management market was the fastest-growing market in this region.

    Key Players and Competitive Insights

    Major market players are spending a lot on R&D to increase their product lines, which will help the nuclear waste management industry grow even more. Market participants are also taking various strategic initiatives to grow their worldwide footprint, including new product launches, contractual agreements, mergers and acquisitions, increased investments, market developments and collaboration with other organizations. Competitors in the industry must offer cost-effective items to expand and survive in an increasingly competitive and rising market industry.

    One of the primary business strategies manufacturers adopt in the global nuclear waste management industry to benefit clients and expand the sector is manufacturing locally to reduce operating costs. In recent years, nuclear waste management industry has provided medicine with some of the most significant benefits. 

    The nuclear waste management market major player such as Enercon (US), Veolia (France), US Ecology Inc. (US), Posiva Oy (Finland), Stericycle Inc. (US), John Wood Group PLC (UK), Perma-Fix (US), Bechtel Corporation (US), Fluor Corporation (US), BHI Energy (US), Waste Control Specialists LLC (US), Augean PLC (UK), Chase Environmental Group Inc. (US), DMT (Germany), Holtec International (US) and Westinghouse Electric Company LLC (US).

    The corporate offices of the Finnish corporation Posiva Oy are located in the town of Eurajoki. It was established in 1995 by two Finnish nuclear plant operators, Teollisuuden Voima and Fortum, for the purpose of investigating and developing a strategy for disposing of spent nuclear fuel from their facilities. In April 2022, a modelling effort on the groundwater chemistry in the bedrock has been started by Posiva Oy in Finland. It resulted in the eventual disposal of old nuclear fuel utilising the most effective computers decades in the future. The company is in charge of removing used nuclear energy.

    Also, the Irving, Texas-based Fluor Corporation is a worldwide American engineering and construction company. It is a holding company that offers services in the sectors of oil and gas, industrial and infrastructure, government, and power through its subsidiaries.

    Key Companies in the Nuclear waste management Market market include

    Industry Developments

    February 2019:Viridor has obtained a contract for the whole management of nuclear waste, and it will provide integrated waste management services for the waste generated at Hinkley Point C.

    December 2018:Magnox Ltd has given Wood a significant contract for the removal, processing, and disposal of radioactive waste from a decommissioned nuclear power plant in the UK. 47m3 of radioactive wet waste that has been kept in tanks at Dungeness A in Kent will be removed as part of the project.

    In November 2022, the Biden administration had planned for raising the funding in projects to recycle nuclear waste from power plants including through reprocessing, a technology that has not been practiced in the United States for decades because of concerns about costs and proliferation.

    Future Outlook

    Nuclear waste management Market Future Outlook

    The Nuclear Waste Management Market is projected to grow at a 1.69% CAGR from 2025 to 2035, driven by regulatory frameworks, technological advancements, and increasing public awareness.

    New opportunities lie in:

    • Invest in advanced waste treatment technologies to enhance efficiency and safety.
    • Develop strategic partnerships with governments for long-term waste storage solutions.
    • Explore innovative recycling methods for nuclear materials to reduce waste volume.

    By 2035, the market is expected to stabilize, reflecting enhanced sustainability and regulatory compliance.

    Market Segmentation

    Nuclear Waste Management Form Outlook (USD Billion, 2018-2030)

    • Industrial
    • Utility

    Nuclear Waste Management Regional Outlook (USD Billion, 2018-2030)

    • US
    • Canada

    Nuclear Waste Management Waste Type Outlook (USD Billion, 2018-2030)

    • Low-Level Waste
    • Intermediate-Level Waste
    • High-Level Waste

    Nuclear Waste Management Application Outlook (USD Billion, 2018-2030)

    • Pressurized Water Reactor
    • Boiling Water Reactors
    • Gas-Cooled Reactors
    • Pressurized Heavy Water Reactor

    Report Scope

    Report Attribute/Metric Details
    Market Size 2024 USD 4.89 Billion
    Market Size 2035 5.88
    Compound Annual Growth Rate (CAGR) 1.69% (2025 - 2035)
    Base Year 2024
    Forecast Period 2025 - 2035
    Historical Data 2018 & 2020
    Forecast Units Value (USD Billion)
    Report Coverage Revenue Forecast, Competitive Landscape, Growth Factors, and Trends
    Segments Covered Waste Type, Reactor Type, Application and Region
    Geographies Covered North America, Europe, Asia Pacific, and Rest of the World
    Countries Covered The U.S, Canada, Germany, France, UK, Italy, Spain, China, Japan, India, Australia, South Korea, and Brazil
    Key Companies Profiled Enercon (US), Veolia (France), US Ecology Inc. (US), Posiva Oy (Finland), Stericycle Inc. (US), John Wood Group PLC (UK), Perma-Fix (US), Bechtel Corporation (US), Fluor Corporation (US)
    Key Market Opportunities Concerns about the environment and rules for the best use of efficient fuels
    Key Market Dynamics Creation of nuclear weapons to propel market Lack of alternatives for permanent disposal will push the market
    Market Size 2025 4.97

    FAQs

    How much is the nuclear waste management market?

    The nuclear waste management market size was expected to be USD 4.84 billion in 2023.

    What is the growth rate of the nuclear waste management market?

    The market for nuclear waste management is expected to register a CAGR of 1.69% over the next ten years.

    Which region held the largest market share in the nuclear waste management market?

    North America held the largest market share in the nuclear waste management market.

    Who are the key players in the nuclear waste management market?

    Enercon (US), Veolia (France), US Ecology Inc. (US), Posiva Oy (Finland), Stericycle Inc. (US), John Wood Group PLC (UK), Perma-Fix (US), Bechtel Corporation (US), Fluor Corporation (US) are the key players in the market for nuclear waste management.

    Which waste type led the nuclear waste management market?

    The high-level waste category led the segment in the nuclear waste management market.

    Which application category had the largest market share in the nuclear waste management market?

    The utility category had the largest market share in the nuclear waste management market.

    1. SECTION I: EXECUTIVE SUMMARY AND KEY HIGHLIGHTS
      1. | 1.1 EXECUTIVE SUMMARY
      2. | | 1.1.1 Market Overview
      3. | | 1.1.2 Key Findings
      4. | | 1.1.3 Market Segmentation
      5. | | 1.1.4 Competitive Landscape
      6. | | 1.1.5 Challenges and Opportunities
      7. | | 1.1.6 Future Outlook
    2. SECTION II: SCOPING, METHODOLOGY AND MARKET STRUCTURE
      1. | 2.1 MARKET INTRODUCTION
      2. | | 2.1.1 Definition
      3. | | 2.1.2 Scope of the study
      4. | | | 2.1.2.1 Research Objective
      5. | | | 2.1.2.2 Assumption
      6. | | | 2.1.2.3 Limitations
      7. | 2.2 RESEARCH METHODOLOGY
      8. | | 2.2.1 Overview
      9. | | 2.2.2 Data Mining
      10. | | 2.2.3 Secondary Research
      11. | | 2.2.4 Primary Research
      12. | | | 2.2.4.1 Primary Interviews and Information Gathering Process
      13. | | | 2.2.4.2 Breakdown of Primary Respondents
      14. | | 2.2.5 Forecasting Model
      15. | | 2.2.6 Market Size Estimation
      16. | | | 2.2.6.1 Bottom-Up Approach
      17. | | | 2.2.6.2 Top-Down Approach
      18. | | 2.2.7 Data Triangulation
      19. | | 2.2.8 Validation
    3. SECTION III: QUALITATIVE ANALYSIS
      1. | 3.1 MARKET DYNAMICS
      2. | | 3.1.1 Overview
      3. | | 3.1.2 Drivers
      4. | | 3.1.3 Restraints
      5. | | 3.1.4 Opportunities
      6. | 3.2 MARKET FACTOR ANALYSIS
      7. | | 3.2.1 Value chain Analysis
      8. | | 3.2.2 Porter's Five Forces Analysis
      9. | | | 3.2.2.1 Bargaining Power of Suppliers
      10. | | | 3.2.2.2 Bargaining Power of Buyers
      11. | | | 3.2.2.3 Threat of New Entrants
      12. | | | 3.2.2.4 Threat of Substitutes
      13. | | | 3.2.2.5 Intensity of Rivalry
      14. | | 3.2.3 COVID-19 Impact Analysis
      15. | | | 3.2.3.1 Market Impact Analysis
      16. | | | 3.2.3.2 Regional Impact
      17. | | | 3.2.3.3 Opportunity and Threat Analysis
    4. SECTION IV: QUANTITATIVE ANALYSIS
      1. | 4.1 Energy & Power, BY Waste Type (USD Billion)
      2. | | 4.1.1 Low-Level Waste
      3. | | 4.1.2 Intermediate-Level Waste
      4. | | 4.1.3 High-Level Waste
      5. | 4.2 Energy & Power, BY Reactor Type (USD Billion)
      6. | | 4.2.1 Pressurized Water Reactor
      7. | | 4.2.2 Boiling Water Reactors
      8. | | 4.2.3 Gas-Cooled Reactors
      9. | | 4.2.4 Pressurized Heavy Water Reactor
      10. | 4.3 Energy & Power, BY Application (USD Billion)
      11. | | 4.3.1 Industrial
      12. | | 4.3.2 Utility
      13. | 4.4 Energy & Power, BY Region (USD Billion)
      14. | | 4.4.1 North America
      15. | | | 4.4.1.1 US
      16. | | | 4.4.1.2 Canada
      17. | | 4.4.2 Europe
      18. | | | 4.4.2.1 Germany
      19. | | | 4.4.2.2 UK
      20. | | | 4.4.2.3 France
      21. | | | 4.4.2.4 Russia
      22. | | | 4.4.2.5 Italy
      23. | | | 4.4.2.6 Spain
      24. | | | 4.4.2.7 Rest of Europe
      25. | | 4.4.3 APAC
      26. | | | 4.4.3.1 China
      27. | | | 4.4.3.2 India
      28. | | | 4.4.3.3 Japan
      29. | | | 4.4.3.4 South Korea
      30. | | | 4.4.3.5 Malaysia
      31. | | | 4.4.3.6 Thailand
      32. | | | 4.4.3.7 Indonesia
      33. | | | 4.4.3.8 Rest of APAC
      34. | | 4.4.4 South America
      35. | | | 4.4.4.1 Brazil
      36. | | | 4.4.4.2 Mexico
      37. | | | 4.4.4.3 Argentina
      38. | | | 4.4.4.4 Rest of South America
      39. | | 4.4.5 MEA
      40. | | | 4.4.5.1 GCC Countries
      41. | | | 4.4.5.2 South Africa
      42. | | | 4.4.5.3 Rest of MEA
    5. SECTION V: COMPETITIVE ANALYSIS
      1. | 5.1 Competitive Landscape
      2. | | 5.1.1 Overview
      3. | | 5.1.2 Competitive Analysis
      4. | | 5.1.3 Market share Analysis
      5. | | 5.1.4 Major Growth Strategy in the Energy & Power
      6. | | 5.1.5 Competitive Benchmarking
      7. | | 5.1.6 Leading Players in Terms of Number of Developments in the Energy & Power
      8. | | 5.1.7 Key developments and growth strategies
      9. | | | 5.1.7.1 New Product Launch/Service Deployment
      10. | | | 5.1.7.2 Merger & Acquisitions
      11. | | | 5.1.7.3 Joint Ventures
      12. | | 5.1.8 Major Players Financial Matrix
      13. | | | 5.1.8.1 Sales and Operating Income
      14. | | | 5.1.8.2 Major Players R&D Expenditure. 2023
      15. | 5.2 Company Profiles
      16. | | 5.2.1 Waste Management Inc (US)
      17. | | | 5.2.1.1 Financial Overview
      18. | | | 5.2.1.2 Products Offered
      19. | | | 5.2.1.3 Key Developments
      20. | | | 5.2.1.4 SWOT Analysis
      21. | | | 5.2.1.5 Key Strategies
      22. | | 5.2.2 Veolia Environnement SA (FR)
      23. | | | 5.2.2.1 Financial Overview
      24. | | | 5.2.2.2 Products Offered
      25. | | | 5.2.2.3 Key Developments
      26. | | | 5.2.2.4 SWOT Analysis
      27. | | | 5.2.2.5 Key Strategies
      28. | | 5.2.3 Energoatom (UA)
      29. | | | 5.2.3.1 Financial Overview
      30. | | | 5.2.3.2 Products Offered
      31. | | | 5.2.3.3 Key Developments
      32. | | | 5.2.3.4 SWOT Analysis
      33. | | | 5.2.3.5 Key Strategies
      34. | | 5.2.4 Orano SA (FR)
      35. | | | 5.2.4.1 Financial Overview
      36. | | | 5.2.4.2 Products Offered
      37. | | | 5.2.4.3 Key Developments
      38. | | | 5.2.4.4 SWOT Analysis
      39. | | | 5.2.4.5 Key Strategies
      40. | | 5.2.5 Holtec International (US)
      41. | | | 5.2.5.1 Financial Overview
      42. | | | 5.2.5.2 Products Offered
      43. | | | 5.2.5.3 Key Developments
      44. | | | 5.2.5.4 SWOT Analysis
      45. | | | 5.2.5.5 Key Strategies
      46. | | 5.2.6 Fluor Corporation (US)
      47. | | | 5.2.6.1 Financial Overview
      48. | | | 5.2.6.2 Products Offered
      49. | | | 5.2.6.3 Key Developments
      50. | | | 5.2.6.4 SWOT Analysis
      51. | | | 5.2.6.5 Key Strategies
      52. | | 5.2.7 Babcock & Wilcox Enterprises Inc (US)
      53. | | | 5.2.7.1 Financial Overview
      54. | | | 5.2.7.2 Products Offered
      55. | | | 5.2.7.3 Key Developments
      56. | | | 5.2.7.4 SWOT Analysis
      57. | | | 5.2.7.5 Key Strategies
      58. | | 5.2.8 Sierra Nuclear Corporation (US)
      59. | | | 5.2.8.1 Financial Overview
      60. | | | 5.2.8.2 Products Offered
      61. | | | 5.2.8.3 Key Developments
      62. | | | 5.2.8.4 SWOT Analysis
      63. | | | 5.2.8.5 Key Strategies
      64. | | 5.2.9 Nuvia Limited (GB)
      65. | | | 5.2.9.1 Financial Overview
      66. | | | 5.2.9.2 Products Offered
      67. | | | 5.2.9.3 Key Developments
      68. | | | 5.2.9.4 SWOT Analysis
      69. | | | 5.2.9.5 Key Strategies
      70. | 5.3 Appendix
      71. | | 5.3.1 References
      72. | | 5.3.2 Related Reports
    6. LIST OF FIGURES
      1. | 6.1 MARKET SYNOPSIS
      2. | 6.2 NORTH AMERICA MARKET ANALYSIS
      3. | 6.3 US MARKET ANALYSIS BY WASTE TYPE
      4. | 6.4 US MARKET ANALYSIS BY REACTOR TYPE
      5. | 6.5 US MARKET ANALYSIS BY APPLICATION
      6. | 6.6 CANADA MARKET ANALYSIS BY WASTE TYPE
      7. | 6.7 CANADA MARKET ANALYSIS BY REACTOR TYPE
      8. | 6.8 CANADA MARKET ANALYSIS BY APPLICATION
      9. | 6.9 EUROPE MARKET ANALYSIS
      10. | 6.10 GERMANY MARKET ANALYSIS BY WASTE TYPE
      11. | 6.11 GERMANY MARKET ANALYSIS BY REACTOR TYPE
      12. | 6.12 GERMANY MARKET ANALYSIS BY APPLICATION
      13. | 6.13 UK MARKET ANALYSIS BY WASTE TYPE
      14. | 6.14 UK MARKET ANALYSIS BY REACTOR TYPE
      15. | 6.15 UK MARKET ANALYSIS BY APPLICATION
      16. | 6.16 FRANCE MARKET ANALYSIS BY WASTE TYPE
      17. | 6.17 FRANCE MARKET ANALYSIS BY REACTOR TYPE
      18. | 6.18 FRANCE MARKET ANALYSIS BY APPLICATION
      19. | 6.19 RUSSIA MARKET ANALYSIS BY WASTE TYPE
      20. | 6.20 RUSSIA MARKET ANALYSIS BY REACTOR TYPE
      21. | 6.21 RUSSIA MARKET ANALYSIS BY APPLICATION
      22. | 6.22 ITALY MARKET ANALYSIS BY WASTE TYPE
      23. | 6.23 ITALY MARKET ANALYSIS BY REACTOR TYPE
      24. | 6.24 ITALY MARKET ANALYSIS BY APPLICATION
      25. | 6.25 SPAIN MARKET ANALYSIS BY WASTE TYPE
      26. | 6.26 SPAIN MARKET ANALYSIS BY REACTOR TYPE
      27. | 6.27 SPAIN MARKET ANALYSIS BY APPLICATION
      28. | 6.28 REST OF EUROPE MARKET ANALYSIS BY WASTE TYPE
      29. | 6.29 REST OF EUROPE MARKET ANALYSIS BY REACTOR TYPE
      30. | 6.30 REST OF EUROPE MARKET ANALYSIS BY APPLICATION
      31. | 6.31 APAC MARKET ANALYSIS
      32. | 6.32 CHINA MARKET ANALYSIS BY WASTE TYPE
      33. | 6.33 CHINA MARKET ANALYSIS BY REACTOR TYPE
      34. | 6.34 CHINA MARKET ANALYSIS BY APPLICATION
      35. | 6.35 INDIA MARKET ANALYSIS BY WASTE TYPE
      36. | 6.36 INDIA MARKET ANALYSIS BY REACTOR TYPE
      37. | 6.37 INDIA MARKET ANALYSIS BY APPLICATION
      38. | 6.38 JAPAN MARKET ANALYSIS BY WASTE TYPE
      39. | 6.39 JAPAN MARKET ANALYSIS BY REACTOR TYPE
      40. | 6.40 JAPAN MARKET ANALYSIS BY APPLICATION
      41. | 6.41 SOUTH KOREA MARKET ANALYSIS BY WASTE TYPE
      42. | 6.42 SOUTH KOREA MARKET ANALYSIS BY REACTOR TYPE
      43. | 6.43 SOUTH KOREA MARKET ANALYSIS BY APPLICATION
      44. | 6.44 MALAYSIA MARKET ANALYSIS BY WASTE TYPE
      45. | 6.45 MALAYSIA MARKET ANALYSIS BY REACTOR TYPE
      46. | 6.46 MALAYSIA MARKET ANALYSIS BY APPLICATION
      47. | 6.47 THAILAND MARKET ANALYSIS BY WASTE TYPE
      48. | 6.48 THAILAND MARKET ANALYSIS BY REACTOR TYPE
      49. | 6.49 THAILAND MARKET ANALYSIS BY APPLICATION
      50. | 6.50 INDONESIA MARKET ANALYSIS BY WASTE TYPE
      51. | 6.51 INDONESIA MARKET ANALYSIS BY REACTOR TYPE
      52. | 6.52 INDONESIA MARKET ANALYSIS BY APPLICATION
      53. | 6.53 REST OF APAC MARKET ANALYSIS BY WASTE TYPE
      54. | 6.54 REST OF APAC MARKET ANALYSIS BY REACTOR TYPE
      55. | 6.55 REST OF APAC MARKET ANALYSIS BY APPLICATION
      56. | 6.56 SOUTH AMERICA MARKET ANALYSIS
      57. | 6.57 BRAZIL MARKET ANALYSIS BY WASTE TYPE
      58. | 6.58 BRAZIL MARKET ANALYSIS BY REACTOR TYPE
      59. | 6.59 BRAZIL MARKET ANALYSIS BY APPLICATION
      60. | 6.60 MEXICO MARKET ANALYSIS BY WASTE TYPE
      61. | 6.61 MEXICO MARKET ANALYSIS BY REACTOR TYPE
      62. | 6.62 MEXICO MARKET ANALYSIS BY APPLICATION
      63. | 6.63 ARGENTINA MARKET ANALYSIS BY WASTE TYPE
      64. | 6.64 ARGENTINA MARKET ANALYSIS BY REACTOR TYPE
      65. | 6.65 ARGENTINA MARKET ANALYSIS BY APPLICATION
      66. | 6.66 REST OF SOUTH AMERICA MARKET ANALYSIS BY WASTE TYPE
      67. | 6.67 REST OF SOUTH AMERICA MARKET ANALYSIS BY REACTOR TYPE
      68. | 6.68 REST OF SOUTH AMERICA MARKET ANALYSIS BY APPLICATION
      69. | 6.69 MEA MARKET ANALYSIS
      70. | 6.70 GCC COUNTRIES MARKET ANALYSIS BY WASTE TYPE
      71. | 6.71 GCC COUNTRIES MARKET ANALYSIS BY REACTOR TYPE
      72. | 6.72 GCC COUNTRIES MARKET ANALYSIS BY APPLICATION
      73. | 6.73 SOUTH AFRICA MARKET ANALYSIS BY WASTE TYPE
      74. | 6.74 SOUTH AFRICA MARKET ANALYSIS BY REACTOR TYPE
      75. | 6.75 SOUTH AFRICA MARKET ANALYSIS BY APPLICATION
      76. | 6.76 REST OF MEA MARKET ANALYSIS BY WASTE TYPE
      77. | 6.77 REST OF MEA MARKET ANALYSIS BY REACTOR TYPE
      78. | 6.78 REST OF MEA MARKET ANALYSIS BY APPLICATION
      79. | 6.79 KEY BUYING CRITERIA OF ENERGY & POWER
      80. | 6.80 RESEARCH PROCESS OF MRFR
      81. | 6.81 DRO ANALYSIS OF ENERGY & POWER
      82. | 6.82 DRIVERS IMPACT ANALYSIS: ENERGY & POWER
      83. | 6.83 RESTRAINTS IMPACT ANALYSIS: ENERGY & POWER
      84. | 6.84 SUPPLY / VALUE CHAIN: ENERGY & POWER
      85. | 6.85 ENERGY & POWER, BY WASTE TYPE, 2024 (% SHARE)
      86. | 6.86 ENERGY & POWER, BY WASTE TYPE, 2024 TO 2035 (USD Billion)
      87. | 6.87 ENERGY & POWER, BY REACTOR TYPE, 2024 (% SHARE)
      88. | 6.88 ENERGY & POWER, BY REACTOR TYPE, 2024 TO 2035 (USD Billion)
      89. | 6.89 ENERGY & POWER, BY APPLICATION, 2024 (% SHARE)
      90. | 6.90 ENERGY & POWER, BY APPLICATION, 2024 TO 2035 (USD Billion)
      91. | 6.91 BENCHMARKING OF MAJOR COMPETITORS
    7. LIST OF TABLES
      1. | 7.1 LIST OF ASSUMPTIONS
      2. | | 7.1.1
      3. | 7.2 North America MARKET SIZE ESTIMATES; FORECAST
      4. | | 7.2.1 BY WASTE TYPE, 2025-2035 (USD Billion)
      5. | | 7.2.2 BY REACTOR TYPE, 2025-2035 (USD Billion)
      6. | | 7.2.3 BY APPLICATION, 2025-2035 (USD Billion)
      7. | 7.3 US MARKET SIZE ESTIMATES; FORECAST
      8. | | 7.3.1 BY WASTE TYPE, 2025-2035 (USD Billion)
      9. | | 7.3.2 BY REACTOR TYPE, 2025-2035 (USD Billion)
      10. | | 7.3.3 BY APPLICATION, 2025-2035 (USD Billion)
      11. | 7.4 Canada MARKET SIZE ESTIMATES; FORECAST
      12. | | 7.4.1 BY WASTE TYPE, 2025-2035 (USD Billion)
      13. | | 7.4.2 BY REACTOR TYPE, 2025-2035 (USD Billion)
      14. | | 7.4.3 BY APPLICATION, 2025-2035 (USD Billion)
      15. | 7.5 Europe MARKET SIZE ESTIMATES; FORECAST
      16. | | 7.5.1 BY WASTE TYPE, 2025-2035 (USD Billion)
      17. | | 7.5.2 BY REACTOR TYPE, 2025-2035 (USD Billion)
      18. | | 7.5.3 BY APPLICATION, 2025-2035 (USD Billion)
      19. | 7.6 Germany MARKET SIZE ESTIMATES; FORECAST
      20. | | 7.6.1 BY WASTE TYPE, 2025-2035 (USD Billion)
      21. | | 7.6.2 BY REACTOR TYPE, 2025-2035 (USD Billion)
      22. | | 7.6.3 BY APPLICATION, 2025-2035 (USD Billion)
      23. | 7.7 UK MARKET SIZE ESTIMATES; FORECAST
      24. | | 7.7.1 BY WASTE TYPE, 2025-2035 (USD Billion)
      25. | | 7.7.2 BY REACTOR TYPE, 2025-2035 (USD Billion)
      26. | | 7.7.3 BY APPLICATION, 2025-2035 (USD Billion)
      27. | 7.8 France MARKET SIZE ESTIMATES; FORECAST
      28. | | 7.8.1 BY WASTE TYPE, 2025-2035 (USD Billion)
      29. | | 7.8.2 BY REACTOR TYPE, 2025-2035 (USD Billion)
      30. | | 7.8.3 BY APPLICATION, 2025-2035 (USD Billion)
      31. | 7.9 Russia MARKET SIZE ESTIMATES; FORECAST
      32. | | 7.9.1 BY WASTE TYPE, 2025-2035 (USD Billion)
      33. | | 7.9.2 BY REACTOR TYPE, 2025-2035 (USD Billion)
      34. | | 7.9.3 BY APPLICATION, 2025-2035 (USD Billion)
      35. | 7.10 Italy MARKET SIZE ESTIMATES; FORECAST
      36. | | 7.10.1 BY WASTE TYPE, 2025-2035 (USD Billion)
      37. | | 7.10.2 BY REACTOR TYPE, 2025-2035 (USD Billion)
      38. | | 7.10.3 BY APPLICATION, 2025-2035 (USD Billion)
      39. | 7.11 Spain MARKET SIZE ESTIMATES; FORECAST
      40. | | 7.11.1 BY WASTE TYPE, 2025-2035 (USD Billion)
      41. | | 7.11.2 BY REACTOR TYPE, 2025-2035 (USD Billion)
      42. | | 7.11.3 BY APPLICATION, 2025-2035 (USD Billion)
      43. | 7.12 Rest of Europe MARKET SIZE ESTIMATES; FORECAST
      44. | | 7.12.1 BY WASTE TYPE, 2025-2035 (USD Billion)
      45. | | 7.12.2 BY REACTOR TYPE, 2025-2035 (USD Billion)
      46. | | 7.12.3 BY APPLICATION, 2025-2035 (USD Billion)
      47. | 7.13 APAC MARKET SIZE ESTIMATES; FORECAST
      48. | | 7.13.1 BY WASTE TYPE, 2025-2035 (USD Billion)
      49. | | 7.13.2 BY REACTOR TYPE, 2025-2035 (USD Billion)
      50. | | 7.13.3 BY APPLICATION, 2025-2035 (USD Billion)
      51. | 7.14 China MARKET SIZE ESTIMATES; FORECAST
      52. | | 7.14.1 BY WASTE TYPE, 2025-2035 (USD Billion)
      53. | | 7.14.2 BY REACTOR TYPE, 2025-2035 (USD Billion)
      54. | | 7.14.3 BY APPLICATION, 2025-2035 (USD Billion)
      55. | 7.15 India MARKET SIZE ESTIMATES; FORECAST
      56. | | 7.15.1 BY WASTE TYPE, 2025-2035 (USD Billion)
      57. | | 7.15.2 BY REACTOR TYPE, 2025-2035 (USD Billion)
      58. | | 7.15.3 BY APPLICATION, 2025-2035 (USD Billion)
      59. | 7.16 Japan MARKET SIZE ESTIMATES; FORECAST
      60. | | 7.16.1 BY WASTE TYPE, 2025-2035 (USD Billion)
      61. | | 7.16.2 BY REACTOR TYPE, 2025-2035 (USD Billion)
      62. | | 7.16.3 BY APPLICATION, 2025-2035 (USD Billion)
      63. | 7.17 South Korea MARKET SIZE ESTIMATES; FORECAST
      64. | | 7.17.1 BY WASTE TYPE, 2025-2035 (USD Billion)
      65. | | 7.17.2 BY REACTOR TYPE, 2025-2035 (USD Billion)
      66. | | 7.17.3 BY APPLICATION, 2025-2035 (USD Billion)
      67. | 7.18 Malaysia MARKET SIZE ESTIMATES; FORECAST
      68. | | 7.18.1 BY WASTE TYPE, 2025-2035 (USD Billion)
      69. | | 7.18.2 BY REACTOR TYPE, 2025-2035 (USD Billion)
      70. | | 7.18.3 BY APPLICATION, 2025-2035 (USD Billion)
      71. | 7.19 Thailand MARKET SIZE ESTIMATES; FORECAST
      72. | | 7.19.1 BY WASTE TYPE, 2025-2035 (USD Billion)
      73. | | 7.19.2 BY REACTOR TYPE, 2025-2035 (USD Billion)
      74. | | 7.19.3 BY APPLICATION, 2025-2035 (USD Billion)
      75. | 7.20 Indonesia MARKET SIZE ESTIMATES; FORECAST
      76. | | 7.20.1 BY WASTE TYPE, 2025-2035 (USD Billion)
      77. | | 7.20.2 BY REACTOR TYPE, 2025-2035 (USD Billion)
      78. | | 7.20.3 BY APPLICATION, 2025-2035 (USD Billion)
      79. | 7.21 Rest of APAC MARKET SIZE ESTIMATES; FORECAST
      80. | | 7.21.1 BY WASTE TYPE, 2025-2035 (USD Billion)
      81. | | 7.21.2 BY REACTOR TYPE, 2025-2035 (USD Billion)
      82. | | 7.21.3 BY APPLICATION, 2025-2035 (USD Billion)
      83. | 7.22 South America MARKET SIZE ESTIMATES; FORECAST
      84. | | 7.22.1 BY WASTE TYPE, 2025-2035 (USD Billion)
      85. | | 7.22.2 BY REACTOR TYPE, 2025-2035 (USD Billion)
      86. | | 7.22.3 BY APPLICATION, 2025-2035 (USD Billion)
      87. | 7.23 Brazil MARKET SIZE ESTIMATES; FORECAST
      88. | | 7.23.1 BY WASTE TYPE, 2025-2035 (USD Billion)
      89. | | 7.23.2 BY REACTOR TYPE, 2025-2035 (USD Billion)
      90. | | 7.23.3 BY APPLICATION, 2025-2035 (USD Billion)
      91. | 7.24 Mexico MARKET SIZE ESTIMATES; FORECAST
      92. | | 7.24.1 BY WASTE TYPE, 2025-2035 (USD Billion)
      93. | | 7.24.2 BY REACTOR TYPE, 2025-2035 (USD Billion)
      94. | | 7.24.3 BY APPLICATION, 2025-2035 (USD Billion)
      95. | 7.25 Argentina MARKET SIZE ESTIMATES; FORECAST
      96. | | 7.25.1 BY WASTE TYPE, 2025-2035 (USD Billion)
      97. | | 7.25.2 BY REACTOR TYPE, 2025-2035 (USD Billion)
      98. | | 7.25.3 BY APPLICATION, 2025-2035 (USD Billion)
      99. | 7.26 Rest of South America MARKET SIZE ESTIMATES; FORECAST
      100. | | 7.26.1 BY WASTE TYPE, 2025-2035 (USD Billion)
      101. | | 7.26.2 BY REACTOR TYPE, 2025-2035 (USD Billion)
      102. | | 7.26.3 BY APPLICATION, 2025-2035 (USD Billion)
      103. | 7.27 MEA MARKET SIZE ESTIMATES; FORECAST
      104. | | 7.27.1 BY WASTE TYPE, 2025-2035 (USD Billion)
      105. | | 7.27.2 BY REACTOR TYPE, 2025-2035 (USD Billion)
      106. | | 7.27.3 BY APPLICATION, 2025-2035 (USD Billion)
      107. | 7.28 GCC Countries MARKET SIZE ESTIMATES; FORECAST
      108. | | 7.28.1 BY WASTE TYPE, 2025-2035 (USD Billion)
      109. | | 7.28.2 BY REACTOR TYPE, 2025-2035 (USD Billion)
      110. | | 7.28.3 BY APPLICATION, 2025-2035 (USD Billion)
      111. | 7.29 South Africa MARKET SIZE ESTIMATES; FORECAST
      112. | | 7.29.1 BY WASTE TYPE, 2025-2035 (USD Billion)
      113. | | 7.29.2 BY REACTOR TYPE, 2025-2035 (USD Billion)
      114. | | 7.29.3 BY APPLICATION, 2025-2035 (USD Billion)
      115. | 7.30 Rest of MEA MARKET SIZE ESTIMATES; FORECAST
      116. | | 7.30.1 BY WASTE TYPE, 2025-2035 (USD Billion)
      117. | | 7.30.2 BY REACTOR TYPE, 2025-2035 (USD Billion)
      118. | | 7.30.3 BY APPLICATION, 2025-2035 (USD Billion)
      119. | 7.31 PRODUCT LAUNCH/PRODUCT DEVELOPMENT/APPROVAL
      120. | | 7.31.1
      121. | 7.32 ACQUISITION/PARTNERSHIP
      122. | | 7.32.1

    Nuclear Waste Management Market Segmentation

    Nuclear Waste Management Waste Type Outlook (USD Billion, 2018-2030)

    • Low-Level Waste
    • Intermediate-Level Waste
    • High-Level Waste

    Nuclear Waste Management Application Outlook (USD Billion, 2018-2030)

    • Pressurized Water Reactor
    • Boiling Water Reactors
    • Gas-Cooled Reactors
    • Pressurized Heavy Water Reactor

    Nuclear Waste Management Form Outlook (USD Billion, 2018-2030)

    • Industrial
    • Utility

    Nuclear Waste Management Regional Outlook (USD Billion, 2018-2030)

    • North America Outlook (USD Billion, 2018-2030)

      • North America Nuclear Waste Management by Waste Type
        • Low-Level Waste
        • Intermediate-Level Waste
        • High-Level Waste
      • North America Nuclear Waste Management by Application
        • Pressurized Water Reactor
        • Boiling Water Reactors
        • Gas-Cooled Reactors
        • Pressurized Heavy Water Reactor
      • North America Nuclear Waste Management by Form
        • Industrial
        • Utility
      • US Outlook (USD Billion, 2018-2030)

      • US Nuclear Waste Management by Waste Type
        • Low-Level Waste
        • Intermediate-Level Waste
        • High-Level Waste
      • US Nuclear Waste Management by Application
        • Pressurized Water Reactor
        • Boiling Water Reactors
        • Gas-Cooled Reactors
        • Pressurized Heavy Water Reactor
      • US Nuclear Waste Management by Form
        • Industrial
        • Utility
      • Canada Outlook (USD Billion, 2018-2030)

      • Canada Nuclear Waste Management by Waste Type
        • Low-Level Waste
        • Intermediate-Level Waste
        • High-Level Waste
      • Canada Nuclear Waste Management by Application
        • Pressurized Water Reactor
        • Boiling Water Reactors
        • Gas-Cooled Reactors
        • Pressurized Heavy Water Reactor
      • Canada Nuclear Waste Management by Form
        • Industrial
        • Utility
    • Europe Outlook (USD Billion, 2018-2030)

      • Europe Nuclear Waste Management by Waste Type
        • Low-Level Waste
        • Intermediate-Level Waste
        • High-Level Waste
      • Europe Nuclear Waste Management by Application
        • Pressurized Water Reactor
        • Boiling Water Reactors
        • Gas-Cooled Reactors
        • Pressurized Heavy Water Reactor
      • Europe Nuclear Waste Management by Form
        • Industrial
        • Utility
      • Germany Outlook (USD Billion, 2018-2030)

      • Germany Nuclear Waste Management by Waste Type
        • Low-Level Waste
        • Intermediate-Level Waste
        • High-Level Waste
      • Germany Nuclear Waste Management by Application
        • Pressurized Water Reactor
        • Boiling Water Reactors
        • Gas-Cooled Reactors
        • Pressurized Heavy Water Reactor
      • Germany Nuclear Waste Management by Form
        • Industrial
        • Utility
      • France Outlook (USD Billion, 2018-2030)

      • France Nuclear Waste Management by Waste Type
        • Low-Level Waste
        • Intermediate-Level Waste
        • High-Level Waste
      • France Nuclear Waste Management by Application
        • Pressurized Water Reactor
        • Boiling Water Reactors
        • Gas-Cooled Reactors
        • Pressurized Heavy Water Reactor
      • France Nuclear Waste Management by Form
        • Industrial
        • Utility
      • UK Outlook (USD Billion, 2018-2030)

      • UK Nuclear Waste Management by Waste Type
        • Low-Level Waste
        • Intermediate-Level Waste
        • High-Level Waste
      • UK Nuclear Waste Management by Application
        • Pressurized Water Reactor
        • Boiling Water Reactors
        • Gas-Cooled Reactors
        • Pressurized Heavy Water Reactor
      • UK Nuclear Waste Management by Form
        • Industrial
        • Utility
      • Italy Outlook (USD Billion, 2018-2030)

      • Italy Nuclear Waste Management by Waste Type
        • Low-Level Waste
        • Intermediate-Level Waste
        • High-Level Waste
      • Italy Nuclear Waste Management by Application
        • Pressurized Water Reactor
        • Boiling Water Reactors
        • Gas-Cooled Reactors
        • Pressurized Heavy Water Reactor
      • Italy Nuclear Waste Management by Form
        • Industrial
        • Utility
      • Spain Outlook (USD Billion, 2018-2030)

      • Spain Nuclear Waste Management by Waste Type
        • Low-Level Waste
        • Intermediate-Level Waste
        • High-Level Waste
      • Spain Nuclear Waste Management by Application
        • Pressurized Water Reactor
        • Boiling Water Reactors
        • Gas-Cooled Reactors
        • Pressurized Heavy Water Reactor
      • Spain Nuclear Waste Management by Form
        • Industrial
        • Utility
      • Rest Of Europe Outlook (USD Billion, 2018-2030)

      • Rest Of Europe Nuclear Waste Management by Waste Type
        • Low-Level Waste
        • Intermediate-Level Waste
        • High-Level Waste
      • Rest Of Europe Nuclear Waste Management by Application
        • Pressurized Water Reactor
        • Boiling Water Reactors
        • Gas-Cooled Reactors
        • Pressurized Heavy Water Reactor
      • Rest Of Europe Nuclear Waste Management by Form
        • Industrial
        • Utility
    • Asia-Pacific Outlook (USD Billion, 2018-2030)

      • Asia-Pacific Nuclear Waste Management by Waste Type
        • Low-Level Waste
        • Intermediate-Level Waste
        • High-Level Waste
      • Asia-Pacific Nuclear Waste Management by Application
        • Pressurized Water Reactor
        • Boiling Water Reactors
        • Gas-Cooled Reactors
        • Pressurized Heavy Water Reactor
      • Asia-Pacific Nuclear Waste Management by Form
        • Industrial
        • Utility
      • China Outlook (USD Billion, 2018-2030)

      • China Nuclear Waste Management by Waste Type
        • Low-Level Waste
        • Intermediate-Level Waste
        • High-Level Waste
      • China Nuclear Waste Management by Application
        • Pressurized Water Reactor
        • Boiling Water Reactors
        • Gas-Cooled Reactors
        • Pressurized Heavy Water Reactor
      • China Nuclear Waste Management by Form
        • Industrial
        • Utility
      • Japan Outlook (USD Billion, 2018-2030)

      • Japan Nuclear Waste Management by Waste Type
        • Low-Level Waste
        • Intermediate-Level Waste
        • High-Level Waste
      • Japan Nuclear Waste Management by Application
        • Pressurized Water Reactor
        • Boiling Water Reactors
        • Gas-Cooled Reactors
        • Pressurized Heavy Water Reactor
      • Japan Nuclear Waste Management by Form
        • Industrial
        • Utility
      • India Outlook (USD Billion, 2018-2030)

      • India Nuclear Waste Management by Waste Type
        • Low-Level Waste
        • Intermediate-Level Waste
        • High-Level Waste
      • India Nuclear Waste Management by Application
        • Pressurized Water Reactor
        • Boiling Water Reactors
        • Gas-Cooled Reactors
        • Pressurized Heavy Water Reactor
      • India Nuclear Waste Management by Form
        • Industrial
        • Utility
      • Australia Outlook (USD Billion, 2018-2030)

      • Australia Nuclear Waste Management by Waste Type
        • Low-Level Waste
        • Intermediate-Level Waste
        • High-Level Waste
      • Australia Nuclear Waste Management by Application
        • Pressurized Water Reactor
        • Boiling Water Reactors
        • Gas-Cooled Reactors
        • Pressurized Heavy Water Reactor
      • Australia Nuclear Waste Management by Form
        • Industrial
        • Utility
      • Rest of Asia-Pacific Outlook (USD Billion, 2018-2030)

      • Rest of Asia-Pacific Nuclear Waste Management by Waste Type
        • Low-Level Waste
        • Intermediate-Level Waste
        • High-Level Waste
      • Rest of Asia-Pacific Nuclear Waste Management by Application
        • Pressurized Water Reactor
        • Boiling Water Reactors
        • Gas-Cooled Reactors
        • Pressurized Heavy Water Reactor
      • Rest of Asia-Pacific Nuclear Waste Management by Form
        • Industrial
        • Utility
    • Rest of the World Outlook (USD Billion, 2018-2030)

      • Rest of the World Nuclear Waste Management by Waste Type
        • Low-Level Waste
        • Intermediate-Level Waste
        • High-Level Waste
      • Rest of the World Nuclear Waste Management by Application
        • Pressurized Water Reactor
        • Boiling Water Reactors
        • Gas-Cooled Reactors
        • Pressurized Heavy Water Reactor
      • Rest of the World Nuclear Waste Management by Form
        • Industrial
        • Utility
      • Middle East Outlook (USD Billion, 2018-2030)

      • Middle East Nuclear Waste Management by Waste Type
        • Low-Level Waste
        • Intermediate-Level Waste
        • High-Level Waste
      • Middle East Nuclear Waste Management by Application
        • Pressurized Water Reactor
        • Boiling Water Reactors
        • Gas-Cooled Reactors
        • Pressurized Heavy Water Reactor
      • Middle East Nuclear Waste Management by Form
        • Industrial
        • Utility
      • Africa Outlook (USD Billion, 2018-2030)

      • Africa Nuclear Waste Management by Waste Type
        • Low-Level Waste
        • Intermediate-Level Waste
        • High-Level Waste
      • Africa Nuclear Waste Management by Application
        • Pressurized Water Reactor
        • Boiling Water Reactors
        • Gas-Cooled Reactors
        • Pressurized Heavy Water Reactor
      • Africa Nuclear Waste Management by Form
        • Industrial
        • Utility
      • Latin America Outlook (USD Billion, 2018-2030)

      • Latin America Nuclear Waste Management by Waste Type
        • Low-Level Waste
        • Intermediate-Level Waste
        • High-Level Waste
      • Latin America Nuclear Waste Management by Application
        • Pressurized Water Reactor
        • Boiling Water Reactors
        • Gas-Cooled Reactors
        • Pressurized Heavy Water Reactor
      • Latin America Nuclear Waste Management by Form
        • Industrial
        • Utility
    Infographic

    Free Sample Request

    Kindly complete the form below to receive a free sample of this Report

    Get Free Sample

    Customer Strories

    “I am very pleased with how market segments have been defined in a relevant way for my purposes (such as "Portable Freezers & refrigerators" and "last-mile"). In general the report is well structured. Thanks very much for your efforts.”

    Victoria Milne

    Founder
    Case Study
    Chemicals and Materials

    Compare Licence

    ×
    Features License Type
    Single User Multiuser License Enterprise User
    Price $4,950 $5,950 $7,250
    Maximum User Access Limit 1 User Upto 10 Users Unrestricted Access Throughout the Organization
    Free Customization
    Direct Access to Analyst
    Deliverable Format
    Platform Access
    Discount on Next Purchase 10% 15% 15%
    Printable Versions