• Cat-intel
  • MedIntelliX
  • Resources
  • About Us
  • Hero Background
    English
    Chinese
    French
    Japanese
    Korean
    German
    Spanish

    Nuclear Imaging Devices Market Size

    ID: MRFR/HC/6542-HCR
    200 Pages
    Rahul Gotadki
    October 2025

    Nuclear Imaging Devices Market Research Report By Application (Cardiology, Oncology, Neurology, Thyroid Function), By Product Type (Single Photon Emission Computed Tomography, Positron Emission Tomography, Hybrid Imaging Systems), By End Use (Hospitals, Diagnostic Centers, Research Institutions), By Technology (Cobalt-60, Technetium-99m, Gallium-68) and By Regional (North America, Europe, South...

    Share:
    Download PDF ×

    We do not share your information with anyone. However, we may send you emails based on your report interest from time to time. You may contact us at any time to opt-out.

    Nuclear Imaging Devices Market Infographic
    Purchase Options

    Nuclear Imaging Devices Size

    Nuclear Imaging Devices Market Growth Projections and Opportunities

    The nuclear imaging devices market is significantly influenced by continuous technological advancements. Innovations in imaging technologies, such as Single Photon Emission Computed Tomography (SPECT) and Positron Emission Tomography (PET), drive market growth by enhancing diagnostic capabilities and improving imaging resolution. This market will be driven by growing cases of non-communicable diseases, for instance cancer and heart ailments. One of the major functions which the nuclear imaging devices perform is in the early detection, early diagnosis and treatment monitoring of these diseases and this has created a huge demand in the health sector. With the world aging there are higher chances of age related diseases such as cancer and neurodegenerative diseases. Due to the fact that nuclear imaging devices need to be used while diagnosing and managing diseases that are more prevalent among an aging population, aging demographic trend is one of the major driving forces for the nuclear imaging devices market. Increased realization, not only by the health practitioners but the consumers themselves of the gains of nuclear imagery also plays a critical role in enabling the market growth. Educational programs for adoption and acceptance of use of radiopharmaceutical therapies and nuclear imaging technologies such as PET-CT scan and SPECT scan is influenced by the development of the winning strategies which incorporate routine, education and adoption of cost effective training modules concept. The developments by government in promoting investments in healthcare infrastructure are vital for the growth of the nuclear imaging devices market. Research grants, purchase incentives for advanced imaging apparatuses, promote the spread of NIS throughout various clinical settings. It is collaboration among celebrated industry players and partnerships between industry and academic organizations for an increase in innovation developing new technologies for nuclear imaging. In most of these collaborations, there is embowment of innovative devices with enhanced functionalities and better diagnostic accuracy. For the cases of the availability and the level of the coverage of the reimbursement plans, the level of their adoption of the nuclear imaging instruments highly depended. They key as a result of the favorable reimbursement policies; especially for the healthcare providers who do encourage investment in this technology consequently making it more accessible to patients and hence a trend of increasing market growth. Economic and healthcare spending variances across the geographies affected the uptake of nuclear imaging devices. Rise in the dominant economies with well developed infrastructures and healthcare facilities and unravel the innovative technologies as well as innovative technologies are always going to be static knowledge but boundary conditions are not unchanging one’s they evolve and to where these emerging economies are bound to have opportunities as they grow with better investment in the healthcare this leads us into the environment scan model.

    Nuclear Imaging Devices Market Size Graph
    Author
    Rahul Gotadki
    Assistant Manager

    He holds an experience of about 7+ years in Market Research and Business Consulting, working under the spectrum of Life Sciences and Healthcare domains. Rahul conceptualizes and implements a scalable business strategy and provides strategic leadership to the clients. His expertise lies in market estimation, competitive intelligence, pipeline analysis, customer assessment, etc. In addition to the above, his other responsibility includes strategic tracking of high growth markets & advising clients on the potential areas of focus they could direct their business initiatives

    Leave a Comment

    FAQs

    What is the projected market valuation of the Nuclear Imaging Devices Market by 2035?

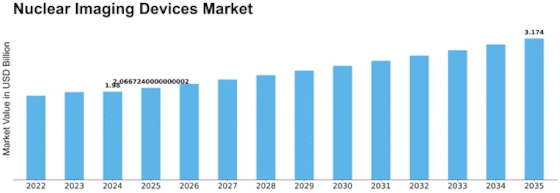
    The projected market valuation for the Nuclear Imaging Devices Market by 2035 is 3.174 USD Billion.

    What was the market valuation of the Nuclear Imaging Devices Market in 2024?

    The overall market valuation of the Nuclear Imaging Devices Market was 1.98 USD Billion in 2024.

    What is the expected CAGR for the Nuclear Imaging Devices Market during the forecast period 2025 - 2035?

    The expected CAGR for the Nuclear Imaging Devices Market during the forecast period 2025 - 2035 is 4.38%.

    Which application segment had the highest valuation in the Nuclear Imaging Devices Market in 2024?

    In 2024, the Cardiology and Oncology application segments each had a valuation of 0.792 USD Billion.

    What are the key players in the Nuclear Imaging Devices Market?

    Key players in the Nuclear Imaging Devices Market include GE Healthcare, Siemens Healthineers, Philips Healthcare, and Canon Medical Systems.

    Which product type is projected to dominate the Nuclear Imaging Devices Market?

    The Single Photon Emission Computed Tomography product type is projected to dominate the Nuclear Imaging Devices Market with a valuation of 0.792 USD Billion in 2024.

    What is the valuation of the Diagnostic Centers segment in the Nuclear Imaging Devices Market?

    The Diagnostic Centers segment had a valuation of 0.66 USD Billion in 2024.

    Which technology segment is expected to see significant growth in the Nuclear Imaging Devices Market?

    The Technetium-99m technology segment is expected to see significant growth, with a valuation of 1.0 USD Billion in 2024.

    How does the market valuation of Research Institutions compare to that of Hospitals in 2024?

    In 2024, the market valuation for Hospitals was 0.99 USD Billion, while Research Institutions had a valuation of 0.33 USD Billion.

    What is the projected growth trend for the Nuclear Imaging Devices Market in the coming years?

    The Nuclear Imaging Devices Market is expected to grow steadily, reaching a valuation of 3.174 USD Billion by 2035.

    Market Summary

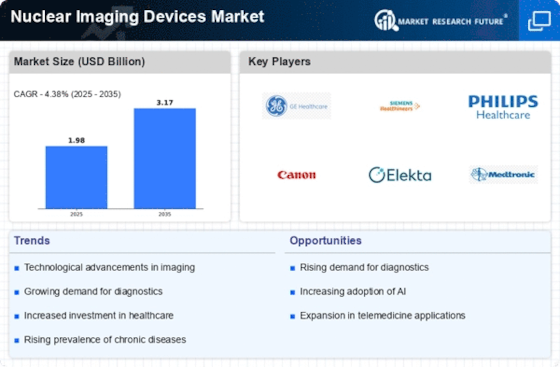
    As per MRFR analysis, the Nuclear Imaging Devices Market Size was estimated at 1.98 USD Billion in 2024. The Nuclear Imaging Devices industry is projected to grow from 2.067 USD Billion in 2025 to 3.174 USD Billion by 2035, exhibiting a compound annual growth rate (CAGR) of 4.38 during the forecast period 2025 - 2035.

    Key Market Trends & Highlights

    The Nuclear Imaging Devices Market is poised for substantial growth driven by technological advancements and increasing demand for early diagnosis.

    • Technological advancements are enhancing the capabilities of nuclear imaging devices, leading to improved diagnostic accuracy.
    • The growing demand for early diagnosis is propelling the adoption of nuclear imaging technologies across various healthcare settings.
    • North America remains the largest market, while the Asia-Pacific region is emerging as the fastest-growing area for nuclear imaging devices.
    • Key market drivers include the increasing prevalence of chronic diseases and the rising geriatric population, which are fueling the need for advanced imaging solutions.

    Market Size & Forecast

    2024 Market Size 1.98 (USD Billion)
    2035 Market Size 3.174 (USD Billion)
    CAGR (2025 - 2035) 4.38%
    Largest Regional Market Share in 2024 North America

    Major Players

    <p>GE Healthcare (US), Siemens Healthineers (DE), Philips Healthcare (NL), Canon Medical Systems (JP), Elekta (SE), Medtronic (US), Hitachi Medical Corporation (JP), Bracco Imaging (IT), Lantheus Medical Imaging (US)</p>

    Market Trends

    The Nuclear Imaging Devices Market is currently experiencing a transformative phase, driven by advancements in technology and increasing demand for precise diagnostic tools. The integration of artificial intelligence and machine learning into imaging devices appears to enhance the accuracy and efficiency of nuclear imaging procedures. Furthermore, the growing prevalence of chronic diseases necessitates early detection and monitoring, which nuclear imaging facilitates effectively. As healthcare systems evolve, the emphasis on personalized medicine and patient-centric approaches is likely to propel the adoption of these devices, fostering innovation and expanding market reach. In addition, the rising awareness of the benefits associated with nuclear imaging, such as its non-invasive nature and ability to provide functional information about organs, suggests a positive trajectory for the market. Collaborations between manufacturers and healthcare providers may further enhance the development of advanced imaging solutions. Overall, the Nuclear Imaging Devices Market seems poised for growth, driven by technological advancements and an increasing focus on improving patient outcomes.

    Technological Advancements

    Recent innovations in imaging technology, particularly in detector materials and software algorithms, are enhancing the performance of nuclear imaging devices. These advancements may lead to improved image quality and reduced radiation exposure for patients.

    Growing Demand for Early Diagnosis

    The increasing prevalence of chronic diseases is driving the need for early and accurate diagnostic tools. Nuclear imaging devices are becoming essential in identifying conditions at earlier stages, which could potentially improve treatment outcomes.

    Focus on Personalized Medicine

    The shift towards personalized medicine is influencing the Nuclear Imaging Devices Market. Tailored imaging solutions that cater to individual patient needs are likely to gain traction, promoting the development of specialized imaging techniques.

    <p>The Global Nuclear Imaging Devices Market is poised for growth as advancements in technology and increasing demand for early disease detection drive innovation and investment in this sector.</p>

    U.S. Food and Drug Administration (FDA)

    Nuclear Imaging Devices Market Market Drivers

    Rising Geriatric Population

    The increasing geriatric population is a significant factor influencing the Nuclear Imaging Devices Market. As individuals age, the likelihood of developing chronic diseases escalates, leading to a higher demand for diagnostic imaging services. The elderly population often requires more frequent medical evaluations, including imaging studies, to monitor health conditions. This demographic shift is prompting healthcare providers to invest in advanced nuclear imaging technologies to cater to the needs of older patients. Projections indicate that the global population aged 65 and older will double by 2050, which could substantially increase the demand for nuclear imaging devices. Consequently, the market is poised for growth as healthcare systems adapt to this demographic trend.

    Growing Awareness of Early Diagnosis

    There is a notable increase in awareness regarding the importance of early diagnosis in the management of diseases, which is driving the Nuclear Imaging Devices Market. Patients and healthcare professionals alike recognize that early detection can significantly improve treatment outcomes and survival rates. This awareness is leading to a higher utilization of nuclear imaging techniques, which are known for their ability to detect diseases at earlier stages. As educational initiatives and public health campaigns promote the benefits of early diagnosis, the demand for nuclear imaging devices is likely to surge. This trend suggests a robust growth trajectory for the market, as more healthcare facilities incorporate nuclear imaging into their diagnostic protocols.

    Expansion of Healthcare Infrastructure

    The expansion of healthcare infrastructure, particularly in emerging economies, is a crucial driver for the Nuclear Imaging Devices Market. As countries invest in healthcare facilities and services, the demand for advanced diagnostic tools, including nuclear imaging devices, is expected to rise. Improved access to healthcare services and increased funding for medical technologies are facilitating the adoption of nuclear imaging in various clinical settings. This expansion is not only enhancing diagnostic capabilities but also improving patient care. The Nuclear Imaging Devices Market stands to benefit from this trend, as more healthcare providers seek to integrate advanced imaging technologies into their practices, thereby driving market growth.

    Increasing Prevalence of Chronic Diseases

    The rising incidence of chronic diseases such as cancer, cardiovascular disorders, and neurological conditions is a primary driver for the Nuclear Imaging Devices Market. As these diseases become more prevalent, the demand for advanced diagnostic tools increases. Nuclear imaging techniques, including PET and SPECT, are essential for accurate diagnosis and treatment monitoring. According to recent data, the number of cancer cases is projected to rise significantly, necessitating enhanced imaging solutions. This trend indicates a growing market for nuclear imaging devices, as healthcare providers seek effective methods to diagnose and manage chronic illnesses. The Nuclear Imaging Devices Market is thus positioned to expand, driven by the urgent need for reliable diagnostic technologies.

    Technological Innovations in Imaging Techniques

    Technological advancements in nuclear imaging techniques are transforming the Nuclear Imaging Devices Market. Innovations such as hybrid imaging systems, which combine PET and CT, enhance diagnostic accuracy and patient outcomes. These advancements allow for better visualization of physiological processes, leading to more precise diagnoses. The introduction of new radiopharmaceuticals and improved detector technologies further boosts the efficacy of nuclear imaging. As healthcare facilities adopt these cutting-edge technologies, the demand for nuclear imaging devices is expected to rise. The market is likely to witness substantial growth as these innovations become more integrated into routine clinical practice, reflecting a shift towards more sophisticated imaging solutions.

    Market Segment Insights

    By Application: Cardiology (Largest) vs. Oncology (Fastest-Growing)

    <p>In the Nuclear Imaging Devices Market, the application segment sees significant distribution with cardiology leading the charge. As the largest segment, cardiology utilizes nuclear imaging technologies primarily for diagnosing and managing cardiovascular diseases. Oncology follows closely, capturing a substantial share as healthcare providers increasingly adopt these devices for cancer detection and monitoring, thus establishing their importance in contemporary medical practice. Oncology is recognized as the fastest-growing segment within this landscape. Factors driving this growth include the rising incidence of cancer globally, along with ongoing advancements in nuclear imaging technologies that enhance diagnostic accuracy and treatment planning. Additionally, the increased focus on precision medicine encourages healthcare systems to invest more in advanced imaging modalities for oncology applications, further propelling this segment's growth trajectory.</p>

    <p>Cardiology (Dominant) vs. Neurology (Emerging)</p>

    <p>Cardiology stands out as the dominant application in the Nuclear Imaging Devices Market, owing to its extensive utilization in diagnosing heart conditions. The proficiency of nuclear imaging in revealing physiological details of the heart makes it indispensable for clinicians. It aids in assessing myocardial perfusion, cardiac function, and the detection of ischemic heart disease. In contrast, neurology is an emerging application area, catching the attention of healthcare providers. With advancements in imaging technology, neurologists are increasingly leveraging nuclear imaging for diagnosing complex neurological disorders, such as Alzheimer's disease and seizures. The growing awareness of neurological conditions and the development of specialized imaging agents contribute to neurology's potential to carve a larger market presence in the coming years.</p>

    By Product Type: Single Photon Emission Computed Tomography (Largest) vs. Positron Emission Tomography (Fastest-Growing)

    <p>In the Nuclear Imaging Devices Market, Single Photon Emission Computed Tomography (SPECT) holds a substantial share due to its wide application in diagnosing various conditions, particularly in cardiology and oncology. The technology is well-established and continues to be favored by healthcare providers, contributing to its market dominance. Positron Emission Tomography (PET), while currently smaller in market share, is experiencing rapid growth as advancements in technology enhance its capabilities, making it an increasingly attractive option for oncological diagnoses and functional imaging.</p>

    <p>Imaging Technologies: SPECT (Dominant) vs. PET (Emerging)</p>

    <p>Single Photon Emission Computed Tomography (SPECT) remains the dominant technology in the Nuclear Imaging Devices Market, known for its ability to produce detailed three-dimensional images of functional processes within the body. Its established presence in clinical settings allows for effective diagnostics and treatment monitoring. Conversely, Positron Emission Tomography (PET) is emerging as a vigorously growing modality, driven by innovations in imaging agents and technology that enhance its sensitivity and specificity. As PET systems evolve, they are becoming increasingly pivotal in areas such as oncology, neurology, and cardiology, capturing a growing market segment. Hybrid Imaging Systems continue to integrate these technologies, offering improved diagnostic capabilities.</p>

    By End Use: Hospitals (Largest) vs. Diagnostic Centers (Fastest-Growing)

    <p>In the Nuclear Imaging Devices Market, hospitals command the largest share among end-use segments, capitalizing on their extensive resources and integrated healthcare services. Their capability to provide comprehensive patient care leads to significant demand for advanced nuclear imaging technologies. In contrast, diagnostic centers are quickly emerging as a vital player, thanks to their focused services and ability to adopt cutting-edge innovations that enhance diagnostic capabilities.</p>

    <p>Hospitals (Dominant) vs. Diagnostic Centers (Emerging)</p>

    <p>Hospitals are the dominant sector in the Nuclear Imaging Devices Market, leveraging their established infrastructure to drive the adoption of nuclear imaging technologies. They benefit from a broad spectrum of imaging applications, ranging from routine diagnostics to advanced therapeutic procedures. Conversely, diagnostic centers represent the emerging aspect of this market, characterized by their specialized services and rapid adoption of the latest imaging technologies. This shift is fueled by increasing patient volumes and demand for accurate, timely diagnostics, with these centers often implementing state-of-the-art equipment to provide precise imaging solutions.</p>

    By Technology: Technetium-99m (Largest) vs. Gallium-68 (Fastest-Growing)

    <p>In the Nuclear Imaging Devices Market, Technetium-99m dominates the landscape, favored for its wide applications in diagnostic imaging. As a key radioisotope, it holds a significant market share, primarily because of its favorable physical properties, including a short half-life and ideal radiation characteristics. Cobalt-60, although still relevant, is less commonly used in this segment compared to Technetium-99m and Gallium-68, which has been gaining traction in recent years due to advancements in PET imaging techniques. The growth trends in this segment are largely driven by technological innovations and an increasing prevalence of chronic diseases requiring advanced diagnostic tools. Gallium-68 is emerging as a faster-growing segment, as its use in targeted therapies and precision medicine expands. Advancements in radiopharmaceuticals and a greater emphasis on personalized medicine are propelling the adoption rates of Gallium-68, indicating a shift towards advanced imaging technologies that enhance diagnostic accuracy.</p>

    <p>Technology: Technetium-99m (Dominant) vs. Gallium-68 (Emerging)</p>

    <p>Technetium-99m remains the dominant force within the Nuclear Imaging Devices Market, extensively utilized in various imaging procedures due to its favorable attributes like a short half-life and optimal gamma emission. Its established position in routine diagnostics has made it a preferred choice among healthcare facilities for producing high-quality images in a non-invasive manner. Conversely, Gallium-68 is recognized as an emerging force in the market, gaining momentum for its application in novel PET imaging techniques. Its unique properties allow for targeted molecular imaging, which is becoming increasingly popular in oncology and personalized medicine. As techniques for producing and utilizing Gallium-68 improve, its market presence is expected to grow, thereby challenging the long-standing dominance of Technetium-99m.</p>

    Get more detailed insights about Nuclear Imaging Devices Market Research Report - Forecast till 2035

    Regional Insights

    North America : Healthcare Innovation Leader

    North America is the largest market for nuclear imaging devices, holding approximately 45% of the global market share. The region's growth is driven by advanced healthcare infrastructure, increasing prevalence of chronic diseases, and significant investments in research and development. Regulatory support from agencies like the FDA further catalyzes innovation and adoption of new technologies, enhancing patient care and diagnostic accuracy. The United States is the leading country in this market, with major players like GE Healthcare and Medtronic driving competition. Canada also contributes significantly, focusing on improving healthcare access and technology integration. The competitive landscape is characterized by continuous advancements in imaging technologies and strategic partnerships among key players, ensuring a robust market presence and innovation pipeline.

    Europe : Emerging Market Dynamics

    Europe is the second-largest market for nuclear imaging devices, accounting for about 30% of the global share. The region's growth is fueled by an aging population, rising healthcare expenditures, and increasing awareness of early disease detection. Regulatory frameworks, such as the European Medicines Agency guidelines, promote the safe and effective use of nuclear imaging technologies, further driving market expansion. Germany and France are the leading countries in this sector, with significant contributions from companies like Siemens Healthineers and Philips Healthcare. The competitive landscape is marked by innovation and collaboration among manufacturers, healthcare providers, and research institutions. This synergy fosters advancements in imaging technologies, enhancing diagnostic capabilities and patient outcomes.

    Asia-Pacific : Rapidly Growing Healthcare Sector

    Asia-Pacific is witnessing rapid growth in the nuclear imaging devices market, holding approximately 20% of the global share. The region's expansion is driven by increasing healthcare investments, rising incidences of chronic diseases, and a growing emphasis on advanced diagnostic techniques. Government initiatives aimed at enhancing healthcare infrastructure and accessibility are also significant catalysts for market growth. China and Japan are the leading countries in this market, with key players like Canon Medical Systems and Hitachi Medical Corporation making substantial contributions. The competitive landscape is evolving, with local manufacturers emerging alongside established global players. This dynamic environment fosters innovation and enhances the availability of advanced imaging solutions across the region.

    Middle East and Africa : Untapped Market Potential

    The Middle East and Africa region is gradually emerging in the nuclear imaging devices market, currently holding about 5% of the global share. The growth is driven by increasing healthcare investments, rising awareness of advanced diagnostic technologies, and government initiatives aimed at improving healthcare access. Regulatory bodies are also beginning to establish frameworks that support the adoption of nuclear imaging technologies, paving the way for future growth. Countries like South Africa and the UAE are leading the way in this sector, with a focus on enhancing healthcare infrastructure and attracting foreign investments. The competitive landscape is characterized by a mix of local and international players, creating opportunities for collaboration and innovation. As the market matures, the presence of key players is expected to expand, further driving growth in the region.

    Key Players and Competitive Insights

    The Nuclear Imaging Devices Market is characterized by a dynamic competitive landscape, driven by technological advancements and increasing demand for precise diagnostic tools. Key players such as GE Healthcare (US), Siemens Healthineers (DE), and Philips Healthcare (NL) are at the forefront, each adopting distinct strategies to enhance their market presence. GE Healthcare (US) emphasizes innovation through the development of advanced imaging technologies, while Siemens Healthineers (DE) focuses on strategic partnerships to expand its product offerings. Philips Healthcare (NL) is actively pursuing digital transformation initiatives, integrating AI capabilities into its imaging devices, thereby enhancing diagnostic accuracy and operational efficiency. Collectively, these strategies contribute to a competitive environment that is increasingly focused on technological differentiation and customer-centric solutions.

    In terms of business tactics, companies are localizing manufacturing and optimizing supply chains to enhance responsiveness to market demands. The Nuclear Imaging Devices Market appears moderately fragmented, with several key players exerting influence over various segments. This fragmentation allows for niche players to emerge, yet the collective strength of major companies shapes the overall market dynamics, fostering an environment where innovation and strategic collaborations are paramount.

    In August 2025, Siemens Healthineers (DE) announced a collaboration with a leading AI firm to develop next-generation imaging solutions that leverage machine learning algorithms. This strategic move is likely to enhance Siemens' product portfolio, positioning it as a leader in AI-integrated imaging technologies. The partnership underscores the growing importance of AI in improving diagnostic capabilities and streamlining workflows in healthcare settings.

    In September 2025, GE Healthcare (US) launched a new line of nuclear imaging devices designed to improve patient comfort and reduce scan times. This initiative reflects GE's commitment to enhancing user experience while maintaining high diagnostic standards. The introduction of these devices may strengthen GE's competitive edge by addressing the evolving needs of healthcare providers and patients alike.

    In July 2025, Philips Healthcare (NL) expanded its operations in Asia by establishing a new manufacturing facility in India. This strategic expansion is indicative of Philips' focus on localizing production to meet the growing demand for nuclear imaging devices in emerging markets. By enhancing its manufacturing capabilities in Asia, Philips is likely to improve its supply chain efficiency and reduce lead times, thereby gaining a competitive advantage in the region.

    As of October 2025, the Nuclear Imaging Devices Market is witnessing trends such as digitalization, sustainability, and the integration of AI technologies. These trends are reshaping competitive dynamics, with companies increasingly forming strategic alliances to leverage complementary strengths. The shift from price-based competition to a focus on innovation, technology, and supply chain reliability is evident, suggesting that future competitive differentiation will hinge on the ability to deliver advanced, efficient, and sustainable imaging solutions.

    Key Companies in the Nuclear Imaging Devices Market market include

    Industry Developments

    The Nuclear Imaging Devices Market has seen significant dynamics in recent months. In September 2023, Siemens Healthineers announced the launch of its new molecular imaging platform, aiming to enhance diagnostic capabilities and patient outcomes.

    In August 2023, Siemens Healthineers launched the Symbia Pro.specta SPECT/CT system with advanced imaging capabilities. This system is designed to improve diagnostic accuracy and workflow efficiency in clinical settings.

    In June 2023, Canon Medical Systems unveiled enhancements to its Celesteion PET/CT system. These enhancements focused on faster acquisition times and improved image reconstruction algorithms, which cater to the increasing demand for high-efficiency imaging solutions in oncology.

    Concurrently, GE Healthcare unveiled advancements in PET and SPECT technology, emphasizing a shift towards precision medicine in cancer treatment. Notable developments like these showcase the evolving landscape.

    Major companies like Philips, Canon Medical Systems, and Hitachi Healthcare are navigating competitive challenges while striving to deliver cutting-edge nuclear imaging solutions. This continuous innovation drives the market forward.

    .webp

    Future Outlook

    Nuclear Imaging Devices Market Future Outlook

    <p>The Nuclear Imaging Devices Market is projected to grow at a 4.38% CAGR from 2024 to 2035, driven by technological advancements, increasing healthcare expenditure, and rising demand for early disease detection.</p>

    New opportunities lie in:

    • <p>Development of portable nuclear imaging devices for remote diagnostics.</p>
    • <p>Integration of AI for enhanced image analysis and interpretation.</p>
    • <p>Expansion into emerging markets with tailored product offerings.</p>

    <p>By 2035, the market is expected to achieve robust growth, positioning itself as a leader in diagnostic imaging.</p>

    Market Segmentation

    Nuclear Imaging Devices Market End Use Outlook

    • Hospitals
    • Diagnostic Centers
    • Research Institutions

    Nuclear Imaging Devices Market Technology Outlook

    • Cobalt-60
    • Technetium-99m
    • Gallium-68

    Nuclear Imaging Devices Market Application Outlook

    • Cardiology
    • Oncology
    • Neurology
    • Thyroid Function

    Nuclear Imaging Devices Market Product Type Outlook

    • Single Photon Emission Computed Tomography
    • Positron Emission Tomography
    • Hybrid Imaging Systems

    Report Scope

    MARKET SIZE 20241.98(USD Billion)
    MARKET SIZE 20252.067(USD Billion)
    MARKET SIZE 20353.174(USD Billion)
    COMPOUND ANNUAL GROWTH RATE (CAGR)4.38% (2024 - 2035)
    REPORT COVERAGERevenue Forecast, Competitive Landscape, Growth Factors, and Trends
    BASE YEAR2024
    Market Forecast Period2025 - 2035
    Historical Data2019 - 2024
    Market Forecast UnitsUSD Billion
    Key Companies ProfiledMarket analysis in progress
    Segments CoveredMarket segmentation analysis in progress
    Key Market OpportunitiesAdvancements in artificial intelligence enhance diagnostic accuracy in the Nuclear Imaging Devices Market.
    Key Market DynamicsTechnological advancements and regulatory changes drive innovation and competition in the Nuclear Imaging Devices Market.
    Countries CoveredNorth America, Europe, APAC, South America, MEA

    FAQs

    What is the projected market valuation of the Nuclear Imaging Devices Market by 2035?

    The projected market valuation for the Nuclear Imaging Devices Market by 2035 is 3.174 USD Billion.

    What was the market valuation of the Nuclear Imaging Devices Market in 2024?

    The overall market valuation of the Nuclear Imaging Devices Market was 1.98 USD Billion in 2024.

    What is the expected CAGR for the Nuclear Imaging Devices Market during the forecast period 2025 - 2035?

    The expected CAGR for the Nuclear Imaging Devices Market during the forecast period 2025 - 2035 is 4.38%.

    Which application segment had the highest valuation in the Nuclear Imaging Devices Market in 2024?

    In 2024, the Cardiology and Oncology application segments each had a valuation of 0.792 USD Billion.

    What are the key players in the Nuclear Imaging Devices Market?

    Key players in the Nuclear Imaging Devices Market include GE Healthcare, Siemens Healthineers, Philips Healthcare, and Canon Medical Systems.

    Which product type is projected to dominate the Nuclear Imaging Devices Market?

    The Single Photon Emission Computed Tomography product type is projected to dominate the Nuclear Imaging Devices Market with a valuation of 0.792 USD Billion in 2024.

    What is the valuation of the Diagnostic Centers segment in the Nuclear Imaging Devices Market?

    The Diagnostic Centers segment had a valuation of 0.66 USD Billion in 2024.

    Which technology segment is expected to see significant growth in the Nuclear Imaging Devices Market?

    The Technetium-99m technology segment is expected to see significant growth, with a valuation of 1.0 USD Billion in 2024.

    How does the market valuation of Research Institutions compare to that of Hospitals in 2024?

    In 2024, the market valuation for Hospitals was 0.99 USD Billion, while Research Institutions had a valuation of 0.33 USD Billion.

    What is the projected growth trend for the Nuclear Imaging Devices Market in the coming years?

    The Nuclear Imaging Devices Market is expected to grow steadily, reaching a valuation of 3.174 USD Billion by 2035.

    1. SECTION I: EXECUTIVE SUMMARY AND KEY HIGHLIGHTS
      1. | 1.1 EXECUTIVE SUMMARY
      2. | | 1.1.1 Market Overview
      3. | | 1.1.2 Key Findings
      4. | | 1.1.3 Market Segmentation
      5. | | 1.1.4 Competitive Landscape
      6. | | 1.1.5 Challenges and Opportunities
      7. | | 1.1.6 Future Outlook
    2. SECTION II: SCOPING, METHODOLOGY AND MARKET STRUCTURE
      1. | 2.1 MARKET INTRODUCTION
      2. | | 2.1.1 Definition
      3. | | 2.1.2 Scope of the study
      4. | | | 2.1.2.1 Research Objective
      5. | | | 2.1.2.2 Assumption
      6. | | | 2.1.2.3 Limitations
      7. | 2.2 RESEARCH METHODOLOGY
      8. | | 2.2.1 Overview
      9. | | 2.2.2 Data Mining
      10. | | 2.2.3 Secondary Research
      11. | | 2.2.4 Primary Research
      12. | | | 2.2.4.1 Primary Interviews and Information Gathering Process
      13. | | | 2.2.4.2 Breakdown of Primary Respondents
      14. | | 2.2.5 Forecasting Model
      15. | | 2.2.6 Market Size Estimation
      16. | | | 2.2.6.1 Bottom-Up Approach
      17. | | | 2.2.6.2 Top-Down Approach
      18. | | 2.2.7 Data Triangulation
      19. | | 2.2.8 Validation
    3. SECTION III: QUALITATIVE ANALYSIS
      1. | 3.1 MARKET DYNAMICS
      2. | | 3.1.1 Overview
      3. | | 3.1.2 Drivers
      4. | | 3.1.3 Restraints
      5. | | 3.1.4 Opportunities
      6. | 3.2 MARKET FACTOR ANALYSIS
      7. | | 3.2.1 Value chain Analysis
      8. | | 3.2.2 Porter's Five Forces Analysis
      9. | | | 3.2.2.1 Bargaining Power of Suppliers
      10. | | | 3.2.2.2 Bargaining Power of Buyers
      11. | | | 3.2.2.3 Threat of New Entrants
      12. | | | 3.2.2.4 Threat of Substitutes
      13. | | | 3.2.2.5 Intensity of Rivalry
      14. | | 3.2.3 COVID-19 Impact Analysis
      15. | | | 3.2.3.1 Market Impact Analysis
      16. | | | 3.2.3.2 Regional Impact
      17. | | | 3.2.3.3 Opportunity and Threat Analysis
    4. SECTION IV: QUANTITATIVE ANALYSIS
      1. | 4.1 Healthcare, BY Application (USD Billion)
      2. | | 4.1.1 Cardiology
      3. | | 4.1.2 Oncology
      4. | | 4.1.3 Neurology
      5. | | 4.1.4 Thyroid Function
      6. | 4.2 Healthcare, BY Product Type (USD Billion)
      7. | | 4.2.1 Single Photon Emission Computed Tomography
      8. | | 4.2.2 Positron Emission Tomography
      9. | | 4.2.3 Hybrid Imaging Systems
      10. | 4.3 Healthcare, BY End Use (USD Billion)
      11. | | 4.3.1 Hospitals
      12. | | 4.3.2 Diagnostic Centers
      13. | | 4.3.3 Research Institutions
      14. | 4.4 Healthcare, BY Technology (USD Billion)
      15. | | 4.4.1 Cobalt-60
      16. | | 4.4.2 Technetium-99m
      17. | | 4.4.3 Gallium-68
      18. | 4.5 Healthcare, BY Region (USD Billion)
      19. | | 4.5.1 North America
      20. | | | 4.5.1.1 US
      21. | | | 4.5.1.2 Canada
      22. | | 4.5.2 Europe
      23. | | | 4.5.2.1 Germany
      24. | | | 4.5.2.2 UK
      25. | | | 4.5.2.3 France
      26. | | | 4.5.2.4 Russia
      27. | | | 4.5.2.5 Italy
      28. | | | 4.5.2.6 Spain
      29. | | | 4.5.2.7 Rest of Europe
      30. | | 4.5.3 APAC
      31. | | | 4.5.3.1 China
      32. | | | 4.5.3.2 India
      33. | | | 4.5.3.3 Japan
      34. | | | 4.5.3.4 South Korea
      35. | | | 4.5.3.5 Malaysia
      36. | | | 4.5.3.6 Thailand
      37. | | | 4.5.3.7 Indonesia
      38. | | | 4.5.3.8 Rest of APAC
      39. | | 4.5.4 South America
      40. | | | 4.5.4.1 Brazil
      41. | | | 4.5.4.2 Mexico
      42. | | | 4.5.4.3 Argentina
      43. | | | 4.5.4.4 Rest of South America
      44. | | 4.5.5 MEA
      45. | | | 4.5.5.1 GCC Countries
      46. | | | 4.5.5.2 South Africa
      47. | | | 4.5.5.3 Rest of MEA
    5. SECTION V: COMPETITIVE ANALYSIS
      1. | 5.1 Competitive Landscape
      2. | | 5.1.1 Overview
      3. | | 5.1.2 Competitive Analysis
      4. | | 5.1.3 Market share Analysis
      5. | | 5.1.4 Major Growth Strategy in the Healthcare
      6. | | 5.1.5 Competitive Benchmarking
      7. | | 5.1.6 Leading Players in Terms of Number of Developments in the Healthcare
      8. | | 5.1.7 Key developments and growth strategies
      9. | | | 5.1.7.1 New Product Launch/Service Deployment
      10. | | | 5.1.7.2 Merger & Acquisitions
      11. | | | 5.1.7.3 Joint Ventures
      12. | | 5.1.8 Major Players Financial Matrix
      13. | | | 5.1.8.1 Sales and Operating Income
      14. | | | 5.1.8.2 Major Players R&D Expenditure. 2023
      15. | 5.2 Company Profiles
      16. | | 5.2.1 GE Healthcare (US)
      17. | | | 5.2.1.1 Financial Overview
      18. | | | 5.2.1.2 Products Offered
      19. | | | 5.2.1.3 Key Developments
      20. | | | 5.2.1.4 SWOT Analysis
      21. | | | 5.2.1.5 Key Strategies
      22. | | 5.2.2 Siemens Healthineers (DE)
      23. | | | 5.2.2.1 Financial Overview
      24. | | | 5.2.2.2 Products Offered
      25. | | | 5.2.2.3 Key Developments
      26. | | | 5.2.2.4 SWOT Analysis
      27. | | | 5.2.2.5 Key Strategies
      28. | | 5.2.3 Philips Healthcare (NL)
      29. | | | 5.2.3.1 Financial Overview
      30. | | | 5.2.3.2 Products Offered
      31. | | | 5.2.3.3 Key Developments
      32. | | | 5.2.3.4 SWOT Analysis
      33. | | | 5.2.3.5 Key Strategies
      34. | | 5.2.4 Canon Medical Systems (JP)
      35. | | | 5.2.4.1 Financial Overview
      36. | | | 5.2.4.2 Products Offered
      37. | | | 5.2.4.3 Key Developments
      38. | | | 5.2.4.4 SWOT Analysis
      39. | | | 5.2.4.5 Key Strategies
      40. | | 5.2.5 Elekta (SE)
      41. | | | 5.2.5.1 Financial Overview
      42. | | | 5.2.5.2 Products Offered
      43. | | | 5.2.5.3 Key Developments
      44. | | | 5.2.5.4 SWOT Analysis
      45. | | | 5.2.5.5 Key Strategies
      46. | | 5.2.6 Medtronic (US)
      47. | | | 5.2.6.1 Financial Overview
      48. | | | 5.2.6.2 Products Offered
      49. | | | 5.2.6.3 Key Developments
      50. | | | 5.2.6.4 SWOT Analysis
      51. | | | 5.2.6.5 Key Strategies
      52. | | 5.2.7 Hitachi Medical Corporation (JP)
      53. | | | 5.2.7.1 Financial Overview
      54. | | | 5.2.7.2 Products Offered
      55. | | | 5.2.7.3 Key Developments
      56. | | | 5.2.7.4 SWOT Analysis
      57. | | | 5.2.7.5 Key Strategies
      58. | | 5.2.8 Bracco Imaging (IT)
      59. | | | 5.2.8.1 Financial Overview
      60. | | | 5.2.8.2 Products Offered
      61. | | | 5.2.8.3 Key Developments
      62. | | | 5.2.8.4 SWOT Analysis
      63. | | | 5.2.8.5 Key Strategies
      64. | | 5.2.9 Lantheus Medical Imaging (US)
      65. | | | 5.2.9.1 Financial Overview
      66. | | | 5.2.9.2 Products Offered
      67. | | | 5.2.9.3 Key Developments
      68. | | | 5.2.9.4 SWOT Analysis
      69. | | | 5.2.9.5 Key Strategies
      70. | 5.3 Appendix
      71. | | 5.3.1 References
      72. | | 5.3.2 Related Reports
    6. LIST OF FIGURES
      1. | 6.1 MARKET SYNOPSIS
      2. | 6.2 NORTH AMERICA MARKET ANALYSIS
      3. | 6.3 US MARKET ANALYSIS BY APPLICATION
      4. | 6.4 US MARKET ANALYSIS BY PRODUCT TYPE
      5. | 6.5 US MARKET ANALYSIS BY END USE
      6. | 6.6 US MARKET ANALYSIS BY TECHNOLOGY
      7. | 6.7 CANADA MARKET ANALYSIS BY APPLICATION
      8. | 6.8 CANADA MARKET ANALYSIS BY PRODUCT TYPE
      9. | 6.9 CANADA MARKET ANALYSIS BY END USE
      10. | 6.10 CANADA MARKET ANALYSIS BY TECHNOLOGY
      11. | 6.11 EUROPE MARKET ANALYSIS
      12. | 6.12 GERMANY MARKET ANALYSIS BY APPLICATION
      13. | 6.13 GERMANY MARKET ANALYSIS BY PRODUCT TYPE
      14. | 6.14 GERMANY MARKET ANALYSIS BY END USE
      15. | 6.15 GERMANY MARKET ANALYSIS BY TECHNOLOGY
      16. | 6.16 UK MARKET ANALYSIS BY APPLICATION
      17. | 6.17 UK MARKET ANALYSIS BY PRODUCT TYPE
      18. | 6.18 UK MARKET ANALYSIS BY END USE
      19. | 6.19 UK MARKET ANALYSIS BY TECHNOLOGY
      20. | 6.20 FRANCE MARKET ANALYSIS BY APPLICATION
      21. | 6.21 FRANCE MARKET ANALYSIS BY PRODUCT TYPE
      22. | 6.22 FRANCE MARKET ANALYSIS BY END USE
      23. | 6.23 FRANCE MARKET ANALYSIS BY TECHNOLOGY
      24. | 6.24 RUSSIA MARKET ANALYSIS BY APPLICATION
      25. | 6.25 RUSSIA MARKET ANALYSIS BY PRODUCT TYPE
      26. | 6.26 RUSSIA MARKET ANALYSIS BY END USE
      27. | 6.27 RUSSIA MARKET ANALYSIS BY TECHNOLOGY
      28. | 6.28 ITALY MARKET ANALYSIS BY APPLICATION
      29. | 6.29 ITALY MARKET ANALYSIS BY PRODUCT TYPE
      30. | 6.30 ITALY MARKET ANALYSIS BY END USE
      31. | 6.31 ITALY MARKET ANALYSIS BY TECHNOLOGY
      32. | 6.32 SPAIN MARKET ANALYSIS BY APPLICATION
      33. | 6.33 SPAIN MARKET ANALYSIS BY PRODUCT TYPE
      34. | 6.34 SPAIN MARKET ANALYSIS BY END USE
      35. | 6.35 SPAIN MARKET ANALYSIS BY TECHNOLOGY
      36. | 6.36 REST OF EUROPE MARKET ANALYSIS BY APPLICATION
      37. | 6.37 REST OF EUROPE MARKET ANALYSIS BY PRODUCT TYPE
      38. | 6.38 REST OF EUROPE MARKET ANALYSIS BY END USE
      39. | 6.39 REST OF EUROPE MARKET ANALYSIS BY TECHNOLOGY
      40. | 6.40 APAC MARKET ANALYSIS
      41. | 6.41 CHINA MARKET ANALYSIS BY APPLICATION
      42. | 6.42 CHINA MARKET ANALYSIS BY PRODUCT TYPE
      43. | 6.43 CHINA MARKET ANALYSIS BY END USE
      44. | 6.44 CHINA MARKET ANALYSIS BY TECHNOLOGY
      45. | 6.45 INDIA MARKET ANALYSIS BY APPLICATION
      46. | 6.46 INDIA MARKET ANALYSIS BY PRODUCT TYPE
      47. | 6.47 INDIA MARKET ANALYSIS BY END USE
      48. | 6.48 INDIA MARKET ANALYSIS BY TECHNOLOGY
      49. | 6.49 JAPAN MARKET ANALYSIS BY APPLICATION
      50. | 6.50 JAPAN MARKET ANALYSIS BY PRODUCT TYPE
      51. | 6.51 JAPAN MARKET ANALYSIS BY END USE
      52. | 6.52 JAPAN MARKET ANALYSIS BY TECHNOLOGY
      53. | 6.53 SOUTH KOREA MARKET ANALYSIS BY APPLICATION
      54. | 6.54 SOUTH KOREA MARKET ANALYSIS BY PRODUCT TYPE
      55. | 6.55 SOUTH KOREA MARKET ANALYSIS BY END USE
      56. | 6.56 SOUTH KOREA MARKET ANALYSIS BY TECHNOLOGY
      57. | 6.57 MALAYSIA MARKET ANALYSIS BY APPLICATION
      58. | 6.58 MALAYSIA MARKET ANALYSIS BY PRODUCT TYPE
      59. | 6.59 MALAYSIA MARKET ANALYSIS BY END USE
      60. | 6.60 MALAYSIA MARKET ANALYSIS BY TECHNOLOGY
      61. | 6.61 THAILAND MARKET ANALYSIS BY APPLICATION
      62. | 6.62 THAILAND MARKET ANALYSIS BY PRODUCT TYPE
      63. | 6.63 THAILAND MARKET ANALYSIS BY END USE
      64. | 6.64 THAILAND MARKET ANALYSIS BY TECHNOLOGY
      65. | 6.65 INDONESIA MARKET ANALYSIS BY APPLICATION
      66. | 6.66 INDONESIA MARKET ANALYSIS BY PRODUCT TYPE
      67. | 6.67 INDONESIA MARKET ANALYSIS BY END USE
      68. | 6.68 INDONESIA MARKET ANALYSIS BY TECHNOLOGY
      69. | 6.69 REST OF APAC MARKET ANALYSIS BY APPLICATION
      70. | 6.70 REST OF APAC MARKET ANALYSIS BY PRODUCT TYPE
      71. | 6.71 REST OF APAC MARKET ANALYSIS BY END USE
      72. | 6.72 REST OF APAC MARKET ANALYSIS BY TECHNOLOGY
      73. | 6.73 SOUTH AMERICA MARKET ANALYSIS
      74. | 6.74 BRAZIL MARKET ANALYSIS BY APPLICATION
      75. | 6.75 BRAZIL MARKET ANALYSIS BY PRODUCT TYPE
      76. | 6.76 BRAZIL MARKET ANALYSIS BY END USE
      77. | 6.77 BRAZIL MARKET ANALYSIS BY TECHNOLOGY
      78. | 6.78 MEXICO MARKET ANALYSIS BY APPLICATION
      79. | 6.79 MEXICO MARKET ANALYSIS BY PRODUCT TYPE
      80. | 6.80 MEXICO MARKET ANALYSIS BY END USE
      81. | 6.81 MEXICO MARKET ANALYSIS BY TECHNOLOGY
      82. | 6.82 ARGENTINA MARKET ANALYSIS BY APPLICATION
      83. | 6.83 ARGENTINA MARKET ANALYSIS BY PRODUCT TYPE
      84. | 6.84 ARGENTINA MARKET ANALYSIS BY END USE
      85. | 6.85 ARGENTINA MARKET ANALYSIS BY TECHNOLOGY
      86. | 6.86 REST OF SOUTH AMERICA MARKET ANALYSIS BY APPLICATION
      87. | 6.87 REST OF SOUTH AMERICA MARKET ANALYSIS BY PRODUCT TYPE
      88. | 6.88 REST OF SOUTH AMERICA MARKET ANALYSIS BY END USE
      89. | 6.89 REST OF SOUTH AMERICA MARKET ANALYSIS BY TECHNOLOGY
      90. | 6.90 MEA MARKET ANALYSIS
      91. | 6.91 GCC COUNTRIES MARKET ANALYSIS BY APPLICATION
      92. | 6.92 GCC COUNTRIES MARKET ANALYSIS BY PRODUCT TYPE
      93. | 6.93 GCC COUNTRIES MARKET ANALYSIS BY END USE
      94. | 6.94 GCC COUNTRIES MARKET ANALYSIS BY TECHNOLOGY
      95. | 6.95 SOUTH AFRICA MARKET ANALYSIS BY APPLICATION
      96. | 6.96 SOUTH AFRICA MARKET ANALYSIS BY PRODUCT TYPE
      97. | 6.97 SOUTH AFRICA MARKET ANALYSIS BY END USE
      98. | 6.98 SOUTH AFRICA MARKET ANALYSIS BY TECHNOLOGY
      99. | 6.99 REST OF MEA MARKET ANALYSIS BY APPLICATION
      100. | 6.100 REST OF MEA MARKET ANALYSIS BY PRODUCT TYPE
      101. | 6.101 REST OF MEA MARKET ANALYSIS BY END USE
      102. | 6.102 REST OF MEA MARKET ANALYSIS BY TECHNOLOGY
      103. | 6.103 KEY BUYING CRITERIA OF HEALTHCARE
      104. | 6.104 RESEARCH PROCESS OF MRFR
      105. | 6.105 DRO ANALYSIS OF HEALTHCARE
      106. | 6.106 DRIVERS IMPACT ANALYSIS: HEALTHCARE
      107. | 6.107 RESTRAINTS IMPACT ANALYSIS: HEALTHCARE
      108. | 6.108 SUPPLY / VALUE CHAIN: HEALTHCARE
      109. | 6.109 HEALTHCARE, BY APPLICATION, 2024 (% SHARE)
      110. | 6.110 HEALTHCARE, BY APPLICATION, 2024 TO 2035 (USD Billion)
      111. | 6.111 HEALTHCARE, BY PRODUCT TYPE, 2024 (% SHARE)
      112. | 6.112 HEALTHCARE, BY PRODUCT TYPE, 2024 TO 2035 (USD Billion)
      113. | 6.113 HEALTHCARE, BY END USE, 2024 (% SHARE)
      114. | 6.114 HEALTHCARE, BY END USE, 2024 TO 2035 (USD Billion)
      115. | 6.115 HEALTHCARE, BY TECHNOLOGY, 2024 (% SHARE)
      116. | 6.116 HEALTHCARE, BY TECHNOLOGY, 2024 TO 2035 (USD Billion)
      117. | 6.117 BENCHMARKING OF MAJOR COMPETITORS
    7. LIST OF TABLES
      1. | 7.1 LIST OF ASSUMPTIONS
      2. | | 7.1.1
      3. | 7.2 North America MARKET SIZE ESTIMATES; FORECAST
      4. | | 7.2.1 BY APPLICATION, 2025-2035 (USD Billion)
      5. | | 7.2.2 BY PRODUCT TYPE, 2025-2035 (USD Billion)
      6. | | 7.2.3 BY END USE, 2025-2035 (USD Billion)
      7. | | 7.2.4 BY TECHNOLOGY, 2025-2035 (USD Billion)
      8. | 7.3 US MARKET SIZE ESTIMATES; FORECAST
      9. | | 7.3.1 BY APPLICATION, 2025-2035 (USD Billion)
      10. | | 7.3.2 BY PRODUCT TYPE, 2025-2035 (USD Billion)
      11. | | 7.3.3 BY END USE, 2025-2035 (USD Billion)
      12. | | 7.3.4 BY TECHNOLOGY, 2025-2035 (USD Billion)
      13. | 7.4 Canada MARKET SIZE ESTIMATES; FORECAST
      14. | | 7.4.1 BY APPLICATION, 2025-2035 (USD Billion)
      15. | | 7.4.2 BY PRODUCT TYPE, 2025-2035 (USD Billion)
      16. | | 7.4.3 BY END USE, 2025-2035 (USD Billion)
      17. | | 7.4.4 BY TECHNOLOGY, 2025-2035 (USD Billion)
      18. | 7.5 Europe MARKET SIZE ESTIMATES; FORECAST
      19. | | 7.5.1 BY APPLICATION, 2025-2035 (USD Billion)
      20. | | 7.5.2 BY PRODUCT TYPE, 2025-2035 (USD Billion)
      21. | | 7.5.3 BY END USE, 2025-2035 (USD Billion)
      22. | | 7.5.4 BY TECHNOLOGY, 2025-2035 (USD Billion)
      23. | 7.6 Germany MARKET SIZE ESTIMATES; FORECAST
      24. | | 7.6.1 BY APPLICATION, 2025-2035 (USD Billion)
      25. | | 7.6.2 BY PRODUCT TYPE, 2025-2035 (USD Billion)
      26. | | 7.6.3 BY END USE, 2025-2035 (USD Billion)
      27. | | 7.6.4 BY TECHNOLOGY, 2025-2035 (USD Billion)
      28. | 7.7 UK MARKET SIZE ESTIMATES; FORECAST
      29. | | 7.7.1 BY APPLICATION, 2025-2035 (USD Billion)
      30. | | 7.7.2 BY PRODUCT TYPE, 2025-2035 (USD Billion)
      31. | | 7.7.3 BY END USE, 2025-2035 (USD Billion)
      32. | | 7.7.4 BY TECHNOLOGY, 2025-2035 (USD Billion)
      33. | 7.8 France MARKET SIZE ESTIMATES; FORECAST
      34. | | 7.8.1 BY APPLICATION, 2025-2035 (USD Billion)
      35. | | 7.8.2 BY PRODUCT TYPE, 2025-2035 (USD Billion)
      36. | | 7.8.3 BY END USE, 2025-2035 (USD Billion)
      37. | | 7.8.4 BY TECHNOLOGY, 2025-2035 (USD Billion)
      38. | 7.9 Russia MARKET SIZE ESTIMATES; FORECAST
      39. | | 7.9.1 BY APPLICATION, 2025-2035 (USD Billion)
      40. | | 7.9.2 BY PRODUCT TYPE, 2025-2035 (USD Billion)
      41. | | 7.9.3 BY END USE, 2025-2035 (USD Billion)
      42. | | 7.9.4 BY TECHNOLOGY, 2025-2035 (USD Billion)
      43. | 7.10 Italy MARKET SIZE ESTIMATES; FORECAST
      44. | | 7.10.1 BY APPLICATION, 2025-2035 (USD Billion)
      45. | | 7.10.2 BY PRODUCT TYPE, 2025-2035 (USD Billion)
      46. | | 7.10.3 BY END USE, 2025-2035 (USD Billion)
      47. | | 7.10.4 BY TECHNOLOGY, 2025-2035 (USD Billion)
      48. | 7.11 Spain MARKET SIZE ESTIMATES; FORECAST
      49. | | 7.11.1 BY APPLICATION, 2025-2035 (USD Billion)
      50. | | 7.11.2 BY PRODUCT TYPE, 2025-2035 (USD Billion)
      51. | | 7.11.3 BY END USE, 2025-2035 (USD Billion)
      52. | | 7.11.4 BY TECHNOLOGY, 2025-2035 (USD Billion)
      53. | 7.12 Rest of Europe MARKET SIZE ESTIMATES; FORECAST
      54. | | 7.12.1 BY APPLICATION, 2025-2035 (USD Billion)
      55. | | 7.12.2 BY PRODUCT TYPE, 2025-2035 (USD Billion)
      56. | | 7.12.3 BY END USE, 2025-2035 (USD Billion)
      57. | | 7.12.4 BY TECHNOLOGY, 2025-2035 (USD Billion)
      58. | 7.13 APAC MARKET SIZE ESTIMATES; FORECAST
      59. | | 7.13.1 BY APPLICATION, 2025-2035 (USD Billion)
      60. | | 7.13.2 BY PRODUCT TYPE, 2025-2035 (USD Billion)
      61. | | 7.13.3 BY END USE, 2025-2035 (USD Billion)
      62. | | 7.13.4 BY TECHNOLOGY, 2025-2035 (USD Billion)
      63. | 7.14 China MARKET SIZE ESTIMATES; FORECAST
      64. | | 7.14.1 BY APPLICATION, 2025-2035 (USD Billion)
      65. | | 7.14.2 BY PRODUCT TYPE, 2025-2035 (USD Billion)
      66. | | 7.14.3 BY END USE, 2025-2035 (USD Billion)
      67. | | 7.14.4 BY TECHNOLOGY, 2025-2035 (USD Billion)
      68. | 7.15 India MARKET SIZE ESTIMATES; FORECAST
      69. | | 7.15.1 BY APPLICATION, 2025-2035 (USD Billion)
      70. | | 7.15.2 BY PRODUCT TYPE, 2025-2035 (USD Billion)
      71. | | 7.15.3 BY END USE, 2025-2035 (USD Billion)
      72. | | 7.15.4 BY TECHNOLOGY, 2025-2035 (USD Billion)
      73. | 7.16 Japan MARKET SIZE ESTIMATES; FORECAST
      74. | | 7.16.1 BY APPLICATION, 2025-2035 (USD Billion)
      75. | | 7.16.2 BY PRODUCT TYPE, 2025-2035 (USD Billion)
      76. | | 7.16.3 BY END USE, 2025-2035 (USD Billion)
      77. | | 7.16.4 BY TECHNOLOGY, 2025-2035 (USD Billion)
      78. | 7.17 South Korea MARKET SIZE ESTIMATES; FORECAST
      79. | | 7.17.1 BY APPLICATION, 2025-2035 (USD Billion)
      80. | | 7.17.2 BY PRODUCT TYPE, 2025-2035 (USD Billion)
      81. | | 7.17.3 BY END USE, 2025-2035 (USD Billion)
      82. | | 7.17.4 BY TECHNOLOGY, 2025-2035 (USD Billion)
      83. | 7.18 Malaysia MARKET SIZE ESTIMATES; FORECAST
      84. | | 7.18.1 BY APPLICATION, 2025-2035 (USD Billion)
      85. | | 7.18.2 BY PRODUCT TYPE, 2025-2035 (USD Billion)
      86. | | 7.18.3 BY END USE, 2025-2035 (USD Billion)
      87. | | 7.18.4 BY TECHNOLOGY, 2025-2035 (USD Billion)
      88. | 7.19 Thailand MARKET SIZE ESTIMATES; FORECAST
      89. | | 7.19.1 BY APPLICATION, 2025-2035 (USD Billion)
      90. | | 7.19.2 BY PRODUCT TYPE, 2025-2035 (USD Billion)
      91. | | 7.19.3 BY END USE, 2025-2035 (USD Billion)
      92. | | 7.19.4 BY TECHNOLOGY, 2025-2035 (USD Billion)
      93. | 7.20 Indonesia MARKET SIZE ESTIMATES; FORECAST
      94. | | 7.20.1 BY APPLICATION, 2025-2035 (USD Billion)
      95. | | 7.20.2 BY PRODUCT TYPE, 2025-2035 (USD Billion)
      96. | | 7.20.3 BY END USE, 2025-2035 (USD Billion)
      97. | | 7.20.4 BY TECHNOLOGY, 2025-2035 (USD Billion)
      98. | 7.21 Rest of APAC MARKET SIZE ESTIMATES; FORECAST
      99. | | 7.21.1 BY APPLICATION, 2025-2035 (USD Billion)
      100. | | 7.21.2 BY PRODUCT TYPE, 2025-2035 (USD Billion)
      101. | | 7.21.3 BY END USE, 2025-2035 (USD Billion)
      102. | | 7.21.4 BY TECHNOLOGY, 2025-2035 (USD Billion)
      103. | 7.22 South America MARKET SIZE ESTIMATES; FORECAST
      104. | | 7.22.1 BY APPLICATION, 2025-2035 (USD Billion)
      105. | | 7.22.2 BY PRODUCT TYPE, 2025-2035 (USD Billion)
      106. | | 7.22.3 BY END USE, 2025-2035 (USD Billion)
      107. | | 7.22.4 BY TECHNOLOGY, 2025-2035 (USD Billion)
      108. | 7.23 Brazil MARKET SIZE ESTIMATES; FORECAST
      109. | | 7.23.1 BY APPLICATION, 2025-2035 (USD Billion)
      110. | | 7.23.2 BY PRODUCT TYPE, 2025-2035 (USD Billion)
      111. | | 7.23.3 BY END USE, 2025-2035 (USD Billion)
      112. | | 7.23.4 BY TECHNOLOGY, 2025-2035 (USD Billion)
      113. | 7.24 Mexico MARKET SIZE ESTIMATES; FORECAST
      114. | | 7.24.1 BY APPLICATION, 2025-2035 (USD Billion)
      115. | | 7.24.2 BY PRODUCT TYPE, 2025-2035 (USD Billion)
      116. | | 7.24.3 BY END USE, 2025-2035 (USD Billion)
      117. | | 7.24.4 BY TECHNOLOGY, 2025-2035 (USD Billion)
      118. | 7.25 Argentina MARKET SIZE ESTIMATES; FORECAST
      119. | | 7.25.1 BY APPLICATION, 2025-2035 (USD Billion)
      120. | | 7.25.2 BY PRODUCT TYPE, 2025-2035 (USD Billion)
      121. | | 7.25.3 BY END USE, 2025-2035 (USD Billion)
      122. | | 7.25.4 BY TECHNOLOGY, 2025-2035 (USD Billion)
      123. | 7.26 Rest of South America MARKET SIZE ESTIMATES; FORECAST
      124. | | 7.26.1 BY APPLICATION, 2025-2035 (USD Billion)
      125. | | 7.26.2 BY PRODUCT TYPE, 2025-2035 (USD Billion)
      126. | | 7.26.3 BY END USE, 2025-2035 (USD Billion)
      127. | | 7.26.4 BY TECHNOLOGY, 2025-2035 (USD Billion)
      128. | 7.27 MEA MARKET SIZE ESTIMATES; FORECAST
      129. | | 7.27.1 BY APPLICATION, 2025-2035 (USD Billion)
      130. | | 7.27.2 BY PRODUCT TYPE, 2025-2035 (USD Billion)
      131. | | 7.27.3 BY END USE, 2025-2035 (USD Billion)
      132. | | 7.27.4 BY TECHNOLOGY, 2025-2035 (USD Billion)
      133. | 7.28 GCC Countries MARKET SIZE ESTIMATES; FORECAST
      134. | | 7.28.1 BY APPLICATION, 2025-2035 (USD Billion)
      135. | | 7.28.2 BY PRODUCT TYPE, 2025-2035 (USD Billion)
      136. | | 7.28.3 BY END USE, 2025-2035 (USD Billion)
      137. | | 7.28.4 BY TECHNOLOGY, 2025-2035 (USD Billion)
      138. | 7.29 South Africa MARKET SIZE ESTIMATES; FORECAST
      139. | | 7.29.1 BY APPLICATION, 2025-2035 (USD Billion)
      140. | | 7.29.2 BY PRODUCT TYPE, 2025-2035 (USD Billion)
      141. | | 7.29.3 BY END USE, 2025-2035 (USD Billion)
      142. | | 7.29.4 BY TECHNOLOGY, 2025-2035 (USD Billion)
      143. | 7.30 Rest of MEA MARKET SIZE ESTIMATES; FORECAST
      144. | | 7.30.1 BY APPLICATION, 2025-2035 (USD Billion)
      145. | | 7.30.2 BY PRODUCT TYPE, 2025-2035 (USD Billion)
      146. | | 7.30.3 BY END USE, 2025-2035 (USD Billion)
      147. | | 7.30.4 BY TECHNOLOGY, 2025-2035 (USD Billion)
      148. | 7.31 PRODUCT LAUNCH/PRODUCT DEVELOPMENT/APPROVAL
      149. | | 7.31.1
      150. | 7.32 ACQUISITION/PARTNERSHIP
      151. | | 7.32.1

    Nuclear Imaging Devices Market Segmentation

    Nuclear Imaging Devices Market By Application (USD Billion, 2019-2035)

    Cardiology

    Oncology

    Neurology

    Thyroid Function

    Nuclear Imaging Devices Market By Product Type (USD Billion, 2019-2035)

    Single Photon Emission Computed Tomography

    Positron Emission Tomography

    Hybrid Imaging Systems

    Nuclear Imaging Devices Market By End Use (USD Billion, 2019-2035)

    Hospitals

    Diagnostic Centers

    Research Institutions

    Nuclear Imaging Devices Market By Technology (USD Billion, 2019-2035)

    Cobalt-60

    Technetium-99m

    Gallium-68

    Nuclear Imaging Devices Market By Regional (USD Billion, 2019-2035)

    North America

    Europe

    South America

    Asia Pacific

    Middle East and Africa

    Nuclear Imaging Devices Market Regional Outlook (USD Billion, 2019-2035)

    North America Outlook (USD Billion, 2019-2035)

    North America Nuclear Imaging Devices Market by Application Type

    Cardiology

    Oncology

    Neurology

    Thyroid Function

    North America Nuclear Imaging Devices Market by Product Type

    Single Photon Emission Computed Tomography

    Positron Emission Tomography

    Hybrid Imaging Systems

    North America Nuclear Imaging Devices Market by End Use Type

    Hospitals

    Diagnostic Centers

    Research Institutions

    North America Nuclear Imaging Devices Market by Technology Type

    Cobalt-60

    Technetium-99m

    Gallium-68

    North America Nuclear Imaging Devices Market by Regional Type

    US

    Canada

    US Outlook (USD Billion, 2019-2035)

    US Nuclear Imaging Devices Market by Application Type

    Cardiology

    Oncology

    Neurology

    Thyroid Function

    US Nuclear Imaging Devices Market by Product Type

    Single Photon Emission Computed Tomography

    Positron Emission Tomography

    Hybrid Imaging Systems

    US Nuclear Imaging Devices Market by End Use Type

    Hospitals

    Diagnostic Centers

    Research Institutions

    US Nuclear Imaging Devices Market by Technology Type

    Cobalt-60

    Technetium-99m

    Gallium-68

    CANADA Outlook (USD Billion, 2019-2035)

    CANADA Nuclear Imaging Devices Market by Application Type

    Cardiology

    Oncology

    Neurology

    Thyroid Function

    CANADA Nuclear Imaging Devices Market by Product Type

    Single Photon Emission Computed Tomography

    Positron Emission Tomography

    Hybrid Imaging Systems

    CANADA Nuclear Imaging Devices Market by End Use Type

    Hospitals

    Diagnostic Centers

    Research Institutions

    CANADA Nuclear Imaging Devices Market by Technology Type

    Cobalt-60

    Technetium-99m

    Gallium-68

    Europe Outlook (USD Billion, 2019-2035)

    Europe Nuclear Imaging Devices Market by Application Type

    Cardiology

    Oncology

    Neurology

    Thyroid Function

    Europe Nuclear Imaging Devices Market by Product Type

    Single Photon Emission Computed Tomography

    Positron Emission Tomography

    Hybrid Imaging Systems

    Europe Nuclear Imaging Devices Market by End Use Type

    Hospitals

    Diagnostic Centers

    Research Institutions

    Europe Nuclear Imaging Devices Market by Technology Type

    Cobalt-60

    Technetium-99m

    Gallium-68

    Europe Nuclear Imaging Devices Market by Regional Type

    Germany

    UK

    France

    Russia

    Italy

    Spain

    Rest of Europe

    GERMANY Outlook (USD Billion, 2019-2035)

    GERMANY Nuclear Imaging Devices Market by Application Type

    Cardiology

    Oncology

    Neurology

    Thyroid Function

    GERMANY Nuclear Imaging Devices Market by Product Type

    Single Photon Emission Computed Tomography

    Positron Emission Tomography

    Hybrid Imaging Systems

    GERMANY Nuclear Imaging Devices Market by End Use Type

    Hospitals

    Diagnostic Centers

    Research Institutions

    GERMANY Nuclear Imaging Devices Market by Technology Type

    Cobalt-60

    Technetium-99m

    Gallium-68

    UK Outlook (USD Billion, 2019-2035)

    UK Nuclear Imaging Devices Market by Application Type

    Cardiology

    Oncology

    Neurology

    Thyroid Function

    UK Nuclear Imaging Devices Market by Product Type

    Single Photon Emission Computed Tomography

    Positron Emission Tomography

    Hybrid Imaging Systems

    UK Nuclear Imaging Devices Market by End Use Type

    Hospitals

    Diagnostic Centers

    Research Institutions

    UK Nuclear Imaging Devices Market by Technology Type

    Cobalt-60

    Technetium-99m

    Gallium-68

    FRANCE Outlook (USD Billion, 2019-2035)

    FRANCE Nuclear Imaging Devices Market by Application Type

    Cardiology

    Oncology

    Neurology

    Thyroid Function

    FRANCE Nuclear Imaging Devices Market by Product Type

    Single Photon Emission Computed Tomography

    Positron Emission Tomography

    Hybrid Imaging Systems

    FRANCE Nuclear Imaging Devices Market by End Use Type

    Hospitals

    Diagnostic Centers

    Research Institutions

    FRANCE Nuclear Imaging Devices Market by Technology Type

    Cobalt-60

    Technetium-99m

    Gallium-68

    RUSSIA Outlook (USD Billion, 2019-2035)

    RUSSIA Nuclear Imaging Devices Market by Application Type

    Cardiology

    Oncology

    Neurology

    Thyroid Function

    RUSSIA Nuclear Imaging Devices Market by Product Type

    Single Photon Emission Computed Tomography

    Positron Emission Tomography

    Hybrid Imaging Systems

    RUSSIA Nuclear Imaging Devices Market by End Use Type

    Hospitals

    Diagnostic Centers

    Research Institutions

    RUSSIA Nuclear Imaging Devices Market by Technology Type

    Cobalt-60

    Technetium-99m

    Gallium-68

    ITALY Outlook (USD Billion, 2019-2035)

    ITALY Nuclear Imaging Devices Market by Application Type

    Cardiology

    Oncology

    Neurology

    Thyroid Function

    ITALY Nuclear Imaging Devices Market by Product Type

    Single Photon Emission Computed Tomography

    Positron Emission Tomography

    Hybrid Imaging Systems

    ITALY Nuclear Imaging Devices Market by End Use Type

    Hospitals

    Diagnostic Centers

    Research Institutions

    ITALY Nuclear Imaging Devices Market by Technology Type

    Cobalt-60

    Technetium-99m

    Gallium-68

    SPAIN Outlook (USD Billion, 2019-2035)

    SPAIN Nuclear Imaging Devices Market by Application Type

    Cardiology

    Oncology

    Neurology

    Thyroid Function

    SPAIN Nuclear Imaging Devices Market by Product Type

    Single Photon Emission Computed Tomography

    Positron Emission Tomography

    Hybrid Imaging Systems

    SPAIN Nuclear Imaging Devices Market by End Use Type

    Hospitals

    Diagnostic Centers

    Research Institutions

    SPAIN Nuclear Imaging Devices Market by Technology Type

    Cobalt-60

    Technetium-99m

    Gallium-68

    REST OF EUROPE Outlook (USD Billion, 2019-2035)

    REST OF EUROPE Nuclear Imaging Devices Market by Application Type

    Cardiology

    Oncology

    Neurology

    Thyroid Function

    REST OF EUROPE Nuclear Imaging Devices Market by Product Type

    Single Photon Emission Computed Tomography

    Positron Emission Tomography

    Hybrid Imaging Systems

    REST OF EUROPE Nuclear Imaging Devices Market by End Use Type

    Hospitals

    Diagnostic Centers

    Research Institutions

    REST OF EUROPE Nuclear Imaging Devices Market by Technology Type

    Cobalt-60

    Technetium-99m

    Gallium-68

    APAC Outlook (USD Billion, 2019-2035)

    APAC Nuclear Imaging Devices Market by Application Type

    Cardiology

    Oncology

    Neurology

    Thyroid Function

    APAC Nuclear Imaging Devices Market by Product Type

    Single Photon Emission Computed Tomography

    Positron Emission Tomography

    Hybrid Imaging Systems

    APAC Nuclear Imaging Devices Market by End Use Type

    Hospitals

    Diagnostic Centers

    Research Institutions

    APAC Nuclear Imaging Devices Market by Technology Type

    Cobalt-60

    Technetium-99m

    Gallium-68

    APAC Nuclear Imaging Devices Market by Regional Type

    China

    India

    Japan

    South Korea

    Malaysia

    Thailand

    Indonesia

    Rest of APAC

    CHINA Outlook (USD Billion, 2019-2035)

    CHINA Nuclear Imaging Devices Market by Application Type

    Cardiology

    Oncology

    Neurology

    Thyroid Function

    CHINA Nuclear Imaging Devices Market by Product Type

    Single Photon Emission Computed Tomography

    Positron Emission Tomography

    Hybrid Imaging Systems

    CHINA Nuclear Imaging Devices Market by End Use Type

    Hospitals

    Diagnostic Centers

    Research Institutions

    CHINA Nuclear Imaging Devices Market by Technology Type

    Cobalt-60

    Technetium-99m

    Gallium-68

    INDIA Outlook (USD Billion, 2019-2035)

    INDIA Nuclear Imaging Devices Market by Application Type

    Cardiology

    Oncology

    Neurology

    Thyroid Function

    INDIA Nuclear Imaging Devices Market by Product Type

    Single Photon Emission Computed Tomography

    Positron Emission Tomography

    Hybrid Imaging Systems

    INDIA Nuclear Imaging Devices Market by End Use Type

    Hospitals

    Diagnostic Centers

    Research Institutions

    INDIA Nuclear Imaging Devices Market by Technology Type

    Cobalt-60

    Technetium-99m

    Gallium-68

    JAPAN Outlook (USD Billion, 2019-2035)

    JAPAN Nuclear Imaging Devices Market by Application Type

    Cardiology

    Oncology

    Neurology

    Thyroid Function

    JAPAN Nuclear Imaging Devices Market by Product Type

    Single Photon Emission Computed Tomography

    Positron Emission Tomography

    Hybrid Imaging Systems

    JAPAN Nuclear Imaging Devices Market by End Use Type

    Hospitals

    Diagnostic Centers

    Research Institutions

    JAPAN Nuclear Imaging Devices Market by Technology Type

    Cobalt-60

    Technetium-99m

    Gallium-68

    SOUTH KOREA Outlook (USD Billion, 2019-2035)

    SOUTH KOREA Nuclear Imaging Devices Market by Application Type

    Cardiology

    Oncology

    Neurology

    Thyroid Function

    SOUTH KOREA Nuclear Imaging Devices Market by Product Type

    Single Photon Emission Computed Tomography

    Positron Emission Tomography

    Hybrid Imaging Systems

    SOUTH KOREA Nuclear Imaging Devices Market by End Use Type

    Hospitals

    Diagnostic Centers

    Research Institutions

    SOUTH KOREA Nuclear Imaging Devices Market by Technology Type

    Cobalt-60

    Technetium-99m

    Gallium-68

    MALAYSIA Outlook (USD Billion, 2019-2035)

    MALAYSIA Nuclear Imaging Devices Market by Application Type

    Cardiology

    Oncology

    Neurology

    Thyroid Function

    MALAYSIA Nuclear Imaging Devices Market by Product Type

    Single Photon Emission Computed Tomography

    Positron Emission Tomography

    Hybrid Imaging Systems

    MALAYSIA Nuclear Imaging Devices Market by End Use Type

    Hospitals

    Diagnostic Centers

    Research Institutions

    MALAYSIA Nuclear Imaging Devices Market by Technology Type

    Cobalt-60

    Technetium-99m

    Gallium-68

    THAILAND Outlook (USD Billion, 2019-2035)

    THAILAND Nuclear Imaging Devices Market by Application Type

    Cardiology

    Oncology

    Neurology

    Thyroid Function

    THAILAND Nuclear Imaging Devices Market by Product Type

    Single Photon Emission Computed Tomography

    Positron Emission Tomography

    Hybrid Imaging Systems

    THAILAND Nuclear Imaging Devices Market by End Use Type

    Hospitals

    Diagnostic Centers

    Research Institutions

    THAILAND Nuclear Imaging Devices Market by Technology Type

    Cobalt-60

    Technetium-99m

    Gallium-68

    INDONESIA Outlook (USD Billion, 2019-2035)

    INDONESIA Nuclear Imaging Devices Market by Application Type

    Cardiology

    Oncology

    Neurology

    Thyroid Function

    INDONESIA Nuclear Imaging Devices Market by Product Type

    Single Photon Emission Computed Tomography

    Positron Emission Tomography

    Hybrid Imaging Systems

    INDONESIA Nuclear Imaging Devices Market by End Use Type

    Hospitals

    Diagnostic Centers

    Research Institutions

    INDONESIA Nuclear Imaging Devices Market by Technology Type

    Cobalt-60

    Technetium-99m

    Gallium-68

    REST OF APAC Outlook (USD Billion, 2019-2035)

    REST OF APAC Nuclear Imaging Devices Market by Application Type

    Cardiology

    Oncology

    Neurology

    Thyroid Function

    REST OF APAC Nuclear Imaging Devices Market by Product Type

    Single Photon Emission Computed Tomography

    Positron Emission Tomography

    Hybrid Imaging Systems

    REST OF APAC Nuclear Imaging Devices Market by End Use Type

    Hospitals

    Diagnostic Centers

    Research Institutions

    REST OF APAC Nuclear Imaging Devices Market by Technology Type

    Cobalt-60

    Technetium-99m

    Gallium-68

    South America Outlook (USD Billion, 2019-2035)

    South America Nuclear Imaging Devices Market by Application Type

    Cardiology

    Oncology

    Neurology

    Thyroid Function

    South America Nuclear Imaging Devices Market by Product Type

    Single Photon Emission Computed Tomography

    Positron Emission Tomography

    Hybrid Imaging Systems

    South America Nuclear Imaging Devices Market by End Use Type

    Hospitals

    Diagnostic Centers

    Research Institutions

    South America Nuclear Imaging Devices Market by Technology Type

    Cobalt-60

    Technetium-99m

    Gallium-68

    South America Nuclear Imaging Devices Market by Regional Type

    Brazil

    Mexico

    Argentina

    Rest of South America

    BRAZIL Outlook (USD Billion, 2019-2035)

    BRAZIL Nuclear Imaging Devices Market by Application Type

    Cardiology

    Oncology

    Neurology

    Thyroid Function

    BRAZIL Nuclear Imaging Devices Market by Product Type

    Single Photon Emission Computed Tomography

    Positron Emission Tomography

    Hybrid Imaging Systems

    BRAZIL Nuclear Imaging Devices Market by End Use Type

    Hospitals

    Diagnostic Centers

    Research Institutions

    BRAZIL Nuclear Imaging Devices Market by Technology Type

    Cobalt-60

    Technetium-99m

    Gallium-68

    MEXICO Outlook (USD Billion, 2019-2035)

    MEXICO Nuclear Imaging Devices Market by Application Type

    Cardiology

    Oncology

    Neurology

    Thyroid Function

    MEXICO Nuclear Imaging Devices Market by Product Type

    Single Photon Emission Computed Tomography

    Positron Emission Tomography

    Hybrid Imaging Systems

    MEXICO Nuclear Imaging Devices Market by End Use Type

    Hospitals

    Diagnostic Centers

    Research Institutions

    MEXICO Nuclear Imaging Devices Market by Technology Type

    Cobalt-60

    Technetium-99m

    Gallium-68

    ARGENTINA Outlook (USD Billion, 2019-2035)

    ARGENTINA Nuclear Imaging Devices Market by Application Type

    Cardiology

    Oncology

    Neurology

    Thyroid Function

    ARGENTINA Nuclear Imaging Devices Market by Product Type

    Single Photon Emission Computed Tomography

    Positron Emission Tomography

    Hybrid Imaging Systems

    ARGENTINA Nuclear Imaging Devices Market by End Use Type

    Hospitals

    Diagnostic Centers

    Research Institutions

    ARGENTINA Nuclear Imaging Devices Market by Technology Type

    Cobalt-60

    Technetium-99m

    Gallium-68

    REST OF SOUTH AMERICA Outlook (USD Billion, 2019-2035)

    REST OF SOUTH AMERICA Nuclear Imaging Devices Market by Application Type

    Cardiology

    Oncology

    Neurology

    Thyroid Function

    REST OF SOUTH AMERICA Nuclear Imaging Devices Market by Product Type

    Single Photon Emission Computed Tomography

    Positron Emission Tomography

    Hybrid Imaging Systems

    REST OF SOUTH AMERICA Nuclear Imaging Devices Market by End Use Type

    Hospitals

    Diagnostic Centers

    Research Institutions

    REST OF SOUTH AMERICA Nuclear Imaging Devices Market by Technology Type

    Cobalt-60

    Technetium-99m

    Gallium-68

    MEA Outlook (USD Billion, 2019-2035)

    MEA Nuclear Imaging Devices Market by Application Type

    Cardiology

    Oncology

    Neurology

    Thyroid Function

    MEA Nuclear Imaging Devices Market by Product Type

    Single Photon Emission Computed Tomography

    Positron Emission Tomography

    Hybrid Imaging Systems

    MEA Nuclear Imaging Devices Market by End Use Type

    Hospitals

    Diagnostic Centers

    Research Institutions

    MEA Nuclear Imaging Devices Market by Technology Type

    Cobalt-60

    Technetium-99m

    Gallium-68

    MEA Nuclear Imaging Devices Market by Regional Type

    GCC Countries

    South Africa

    Rest of MEA

    GCC COUNTRIES Outlook (USD Billion, 2019-2035)

    GCC COUNTRIES Nuclear Imaging Devices Market by Application Type

    Cardiology

    Oncology

    Neurology

    Thyroid Function

    GCC COUNTRIES Nuclear Imaging Devices Market by Product Type

    Single Photon Emission Computed Tomography

    Positron Emission Tomography

    Hybrid Imaging Systems

    GCC COUNTRIES Nuclear Imaging Devices Market by End Use Type

    Hospitals

    Diagnostic Centers

    Research Institutions

    GCC COUNTRIES Nuclear Imaging Devices Market by Technology Type

    Cobalt-60

    Technetium-99m

    Gallium-68

    SOUTH AFRICA Outlook (USD Billion, 2019-2035)

    SOUTH AFRICA Nuclear Imaging Devices Market by Application Type

    Cardiology

    Oncology

    Neurology

    Thyroid Function

    SOUTH AFRICA Nuclear Imaging Devices Market by Product Type

    Single Photon Emission Computed Tomography

    Positron Emission Tomography

    Hybrid Imaging Systems

    SOUTH AFRICA Nuclear Imaging Devices Market by End Use Type

    Hospitals

    Diagnostic Centers

    Research Institutions

    SOUTH AFRICA Nuclear Imaging Devices Market by Technology Type

    Cobalt-60

    Technetium-99m

    Gallium-68

    REST OF MEA Outlook (USD Billion, 2019-2035)

    REST OF MEA Nuclear Imaging Devices Market by Application Type

    Cardiology

    Oncology

    Neurology

    Thyroid Function

    REST OF MEA Nuclear Imaging Devices Market by Product Type

    Single Photon Emission Computed Tomography

    Positron Emission Tomography

    Hybrid Imaging Systems

    REST OF MEA Nuclear Imaging Devices Market by End Use Type

    Hospitals

    Diagnostic Centers

    Research Institutions

    REST OF MEA Nuclear Imaging Devices Market by Technology Type

    Cobalt-60

    Technetium-99m

    Gallium-68


    Infographic

    Free Sample Request

    Kindly complete the form below to receive a free sample of this Report

    Get Free Sample

    Customer Strories

    “I am very pleased with how market segments have been defined in a relevant way for my purposes (such as "Portable Freezers & refrigerators" and "last-mile"). In general the report is well structured. Thanks very much for your efforts.”

    Victoria Milne

    Founder
    Case Study
    Chemicals and Materials

    Compare Licence

    ×
    Features License Type
    Single User Multiuser License Enterprise User
    Price $4,950 $5,950 $7,250
    Maximum User Access Limit 1 User Upto 10 Users Unrestricted Access Throughout the Organization
    Free Customization
    Direct Access to Analyst
    Deliverable Format
    Platform Access
    Discount on Next Purchase 10% 15% 15%
    Printable Versions