• Cat-intel
  • MedIntelliX
  • Resources
  • About Us
  • Hero Background
    English
    Chinese
    French
    Japanese
    Korean
    German
    Spanish

    Metering Pump Market Share

    ID: MRFR/E&P/2137-HCR
    132 Pages
    Anshula Mandaokar
    October 2025

    Metering Pump Market Research Report By Application (Water Treatment, Chemicals Processing, Food and Beverage, Pharmaceuticals, Oil and Gas), By Type (Diaphragm Pumps, Peristaltic Pumps, Gear Pumps, Piston Pumps), By End Use Industry (Chemical Industry, Water and Wastewater Management, Pharmaceutical Industry, Food and Beverage Industry), By Pump Capacity (Less than 5 LPH, 5 to 20 LPH, 20 to 10...

    Share:
    Download PDF ×

    We do not share your information with anyone. However, we may send you emails based on your report interest from time to time. You may contact us at any time to opt-out.

    Metering Pump Market Infographic
    $ 4,950.0
    $ 5,950.0
    $ 7,250.0

    Market Share

    Metering Pump Market Share Analysis

    One common methodology includes differentiation through mechanical advancement. Organizations strive for an edge by presenting state of the art highlights, for example, accuracy control instruments, upgraded strength, and easy to understand interfaces. This draws in new clients as well as encourages client loyalty, as businesses progressively look for cutting edge and effective pumping arrangements. Another essential road spins around valuing methodologies. In this cutthroat scene, organizations frequently take on cost administration or premium valuing models. Some select expense initiative by offering conservative metering pump arrangements, focusing on a more extensive client base, and accomplishing economies of scale. Then again, others position themselves as suppliers of top of the line, premium pumps with predominant execution, supporting a top-notch sticker price through trend setting innovations or prevalent materials. This division permits organizations to take special care of various market portions and meet different client needs. Additionally, topographical positioning has a significant role in the market for metering pumps. Businesses firmly focus on certain regions, tailoring their offerings to the unique needs and governmental frameworks of places. This constrained approach involves adapting items to comply with local regulations, ensuring optimal performance in a variety of settings. Through understanding and meeting the needs of different markets, companies may gain a competitive advantage and establish significant areas of strength in clear locations. Furthermore, in the metering pump market, client-driven processes are essential for supported outcomes. Developing strong relationships with customers involves being aware of their evolving needs and preferences. Businesses that prioritize customer loyalty, provide outstanding after-deal assistance, and actively seek out feedback are more likely to succeed. Through specific speech exchanges and reputation-building, this client-driven strategy helps retain current clients and attracts new ones. Organizations may study the nuances of the Metering Pump Market, set themselves apart from competitors, and create long-lasting value for both clients and partners by resolutely implementing these positioning techniques.

    Market Summary

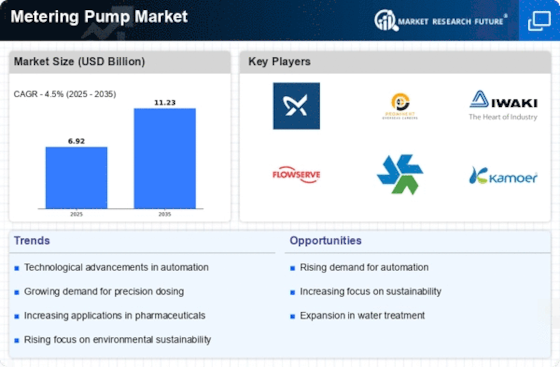
    As per Market Research Future Analysis, the Metering Pump Market was valued at 6.92 USD Billion in 2024 and is projected to grow from 6.92 USD Billion in 2024 to 11.23 USD Billion by 2035, reflecting a CAGR of 4.50% from 2025 to 2035. The market is driven by increasing automation in industries, particularly in water and wastewater management, and advancements in technology such as smart pumps and IoT systems.

    Key Market Trends & Highlights

    The Metering Pump Market is witnessing significant growth due to various trends.

    • Water Treatment segment valued at 1.5 USD Billion in 2023, expected to reach 11.23 USD Billion by 2035. Chemical Processing segment valued at 1.2 USD Billion in 2023, projected to grow to 1.7 USD Billion by 2032. Pharmaceuticals segment valued at 1.0 USD Billion in 2023, anticipated to increase to 1.5 USD Billion by 2032. North America leads the market with a valuation of 2.1 USD Billion in 2023.

    Market Size & Forecast

    2024 Market Size USD 6.92 Billion
    2035 Market Size USD 11.23 Billion
    CAGR (2024-2035) 4.50%
    Largest Regional Market Share in 2023 North America.

    Major Players

    <p>Key players include Hale Hamilton, Flowserve, GormanRupp, ProMinent, Viking Pump, KSB, WatsonMarlow, Grundfos, Netzsch Pumps, Pulsafeeder, Graco, Apex Pumps, Iwaki, BlueWhite Industries, and Versa Matic.</p>

    Market Trends

    The Metering Pump Market is experiencing significant growth driven by several key market drivers. A rise in automation across industries, particularly in water and wastewater management, has boosted the demand for precise fluid handling solutions. As various sectors recognize the need for accurate dosing and distribution, metering pumps have become essential components in improving operational efficiency and reducing waste. Additionally, the ongoing advancements in technology, such as the development of smart pumps and IoT-enabled systems, are enhancing performance and providing better control.

    Opportunities to be explored in the metering pump sector include expanding applications across industries, such as food and beverage, pharmaceuticals, and chemical processing.

    The continuous need for reliable dosing solutions in these sectors presents a chance for manufacturers to innovate and cater to specific requirements. Furthermore, the increasing focus on sustainability and environmental regulations is pushing industries to seek energy-efficient and eco-friendly pumping solutions. This trend can lead to increased demand for metering pumps designed with sustainability in mind.  Trends in recent times indicate a rising preference for intelligent pumping systems equipped with advanced monitoring features. Users are looking for ways to optimize operations through real-time data analytics.

    This growing interest in smart technologies signifies a shift towards more integrated systems that enhance overall productivity.

    In addition, the need for remote operation capabilities and predictive maintenance is encouraging the adoption of metering pumps that can seamlessly integrate with existing industrial setups, fostering greater efficiency and safety in operations. The combination of these factors demonstrates the dynamic evolution of the metering pump market and its responsiveness to industry needs.


    Source: Primary Research, Secondary Research, MRFR Database and Analyst Review

    <p>The ongoing evolution of industrial processes and the increasing demand for precise fluid control are driving advancements in metering pump technology, which appears poised to enhance operational efficiency across various sectors.</p>

    U.S. Department of Energy

    Metering Pump Market Market Drivers

    Market Growth Projections

    The Global Metering Pump Market Industry is projected to experience substantial growth, with estimates indicating a market value of 5.84 USD Billion in 2024 and a potential increase to 9.28 USD Billion by 2035. This growth trajectory suggests a compound annual growth rate of 4.3% from 2025 to 2035. The expansion is driven by various factors, including increasing industrial automation, stringent regulatory compliance, and technological advancements in pump design. These projections highlight the dynamic nature of the market and the potential opportunities for stakeholders in the metering pump industry.

    Growing Demand in Water Treatment

    The increasing global focus on water treatment and management is driving the Global Metering Pump Market Industry. As urbanization accelerates, the need for efficient water supply systems becomes paramount. Metering pumps play a crucial role in accurately dosing chemicals for water purification processes. For instance, municipalities are investing in advanced metering technologies to enhance water quality and safety. This trend is expected to contribute to the market's growth, with projections indicating a market value of 5.84 USD Billion in 2024, reflecting the industry's response to rising environmental concerns and regulatory pressures.

    Industrial Automation and Process Control

    The rise of industrial automation is significantly influencing the Global Metering Pump Market Industry. Industries such as oil and gas, chemicals, and pharmaceuticals are increasingly adopting automated systems for precise fluid management. Metering pumps are integral to these systems, ensuring accurate dosing and minimizing waste. The push for efficiency and cost reduction in manufacturing processes is likely to bolster demand for metering pumps. As industries evolve, the market is projected to reach 9.28 USD Billion by 2035, with a compound annual growth rate of 4.3% from 2025 to 2035, indicating a robust trajectory driven by automation.

    Rising Demand in Food and Beverage Sector

    The food and beverage sector is experiencing a surge in demand for metering pumps, significantly impacting the Global Metering Pump Market Industry. As consumer preferences shift towards quality and safety, manufacturers are investing in precise dosing solutions for ingredients and additives. Metering pumps ensure consistency and accuracy in production processes, which is vital for maintaining product quality. This trend is particularly evident in the dairy and beverage industries, where precise dosing is critical. The growing emphasis on food safety and quality assurance is likely to drive further adoption of metering pumps in this sector.

    Technological Advancements in Pump Design

    Innovations in metering pump technology are reshaping the Global Metering Pump Market Industry. Advances such as smart metering systems, IoT integration, and enhanced materials are improving pump efficiency and reliability. These developments enable real-time monitoring and control, which is increasingly sought after in various applications. For example, industries are leveraging smart pumps to optimize chemical dosing based on real-time data, leading to improved operational efficiency. As technology continues to evolve, the market is poised for growth, with new solutions addressing the diverse needs of end-users and enhancing overall performance.

    Regulatory Compliance and Safety Standards

    Stringent regulatory frameworks governing chemical handling and environmental safety are propelling the Global Metering Pump Market Industry. Industries are compelled to adhere to safety standards that necessitate precise chemical dosing to mitigate risks associated with spills and contamination. Metering pumps are essential for compliance, as they provide accurate and reliable dosing solutions. The increasing emphasis on workplace safety and environmental protection is likely to enhance the adoption of metering pumps across various sectors. This trend underscores the importance of metering technology in meeting regulatory requirements, thereby driving market growth.

    Market Segment Insights

    Metering Pump Market Application Insights   

    <p>The Application segment of the Metering Pump Market plays a crucial role in driving the overall market dynamics, with a total market value projected to reach 5.66 billion USD in 2023 and estimated to grow significantly by 2032. This segment encompasses various critical industries, including Water Treatment, Chemicals Processing, Food and Beverage, Pharmaceuticals, and Oil and Gas, each contributing to the overall growth trajectory of the market.</p>

    <p>Water Treatment stands as a key contributor, valued at 1.5 billion USD in 2023 and projected to increase to 2.2 billion USD by 2032, reflecting the growing demand for efficient water management solutions in both municipal and industrial applications.</p>

    <p>Following closely, the Chemicals Processing application is valued at 1.2 billion USD in 2023 and expected to reach 1.7 billion USD by 2032, driven by the need for precise and reliable chemical dosing in various manufacturing processes, which is essential for enhancing product quality and safety. The Food and Beverage segment, although smaller in comparison, shows promising growth potential, with a projected increase from 0.75 billion USD in 2023 to 1.1 billion USD by 2032, emphasizing the necessity of maintaining strict hygiene standards and precise ingredient mixing in food production.</p>

    Get more detailed insights about Metering Pump Market Research Report - Forecast to 2032

    Regional Insights

    The Metering Pump Market revenue is poised for steady growth across key regional segments. In 2023, North America leads with a valuation of 2.1 USD Billion, reflecting its dominance in the industry due to strong demand from various end-use sectors, positioning it as the majority holding market. Europe follows with a value of 1.5 USD Billion, showcasing a significant market presence driven by industrial applications and advanced technology adoption. The APAC region, valued at 1.3 USD Billion, is emerging as a promising area for growth, bolstered by rapid industrialization and increasing investments.

    South America, with a valuation of 0.4 USD Billion, and MEA at 0.36 USD Billion, represent smaller but essential markets, reflecting developing industrial landscapes and the growing need for efficient metering solutions. The overall Metering Pump Market segmentation illustrates diverse opportunities fueled by urbanization and infrastructural advancements alongside challenges such as competition and cost pressures that could influence market dynamics in the coming years.

    Metering Pump Market Regional Insights

    Source: Primary Research, Secondary Research, MRFR Database and Analyst Review

    Key Players and Competitive Insights

    The Metering Pump Market is characterized by diverse players and dynamic growth trends, experiencing increasing demand across industries such as water treatment, chemicals, oil and gas, and pharmaceuticals. Competitive insights into this market reveal a landscape marked by innovation, technological advancements, and strategic collaborations among key stakeholders. 

    As companies strive to enhance efficiency, precision, and sustainability in fluid handling processes, they are also leveraging advances in materials and control systems to improve the performance and reliability of metering pumps. This competition is fostering a robust environment for product development while market participants continuously seek to differentiate themselves through superior quality, service, and customer-centric solutions to gain a competitive edge.

    Hale Hamilton stands out in the Metering Pump Market with a strong reputation for delivering high-quality and reliable solutions tailored to the specific needs of various industries. The company is well-regarded for its engineering expertise, which allows it to provide customized products that meet exact specifications. Hale Hamilton benefits from a durable product range, ensuring efficient metering and dispensing of fluids while adhering to stringent environmental regulations. The company’s commitment to research and innovation fosters continuous improvement, enabling it to maintain a competitive standing in the market.

    Furthermore, its well-established distribution channels and customer support services strengthen its market presence and enhance customer satisfaction.

    Flowserve occupies a significant position in the Metering Pump Market, leveraging decades of industry experience and a comprehensive portfolio of flow management solutions. The company's expertise is reflected in its ability to engineer advanced metering pumps that cater to diverse applications, particularly in demanding environments. Flowserve's strengths lie in its commitment to reliability, performance, and efficiency, which resonate with customers seeking high-performance pumping solutions. The company also emphasizes the integration of advanced technologies to enhance product functionality and operational efficiency.

    Flowserve's global reach and established partnerships further amplify its market presence, enabling it to tap into emerging opportunities while continuing to deliver innovative and reliable products to its customer base.

    Key Companies in the Metering Pump Market market include

    Industry Developments

    Recent developments in the Metering Pump Market have showcased significant advancements and activities among key players such as Hale Hamilton, Flowserve, and GormanRupp. ProMinent has introduced innovative solutions that enhance precision in chemical dosing applications, driving demand in various industries. Viking Pump is expanding its product line to cater to the growing requirements in wastewater management, while KSB and WatsonMarlow are reinforcing their market presence through upgraded technologies aimed at improving efficiency. The market is also witnessing substantial growth, with an increasing valuation contributing to heightened competition and investment in research and development.

    Additionally, companies like Grundfos and Netzsch Pumps are experiencing growth in demand for their metering pumps due to the rising need for reliable fluid handling systems across multiple sectors. Recently, Pulsafeeder and Graco have announced collaborations aimed at enhancing their service capabilities and responding to evolving market needs. Although there are no recent high-profile mergers or acquisitions among these companies, the increasing collaboration signifies a trend towards consolidation in the market, reflecting a strategic approach to cater to the emerging requirements within the industry. Overall, the metering pump sector remains dynamic, marked by innovation and responsive strategies from leading companies.

    Future Outlook

    Metering Pump Market Future Outlook

    <p>The Global Metering Pump Market is projected to grow at a 4.50% CAGR from 2025 to 2035, driven by advancements in automation, increasing demand for precise fluid handling, and environmental regulations.</p>

    New opportunities lie in:

    • <p>Invest in smart metering technologies to enhance efficiency and data analytics capabilities. Develop eco-friendly pump solutions to meet rising sustainability demands in various industries. Expand into emerging markets with tailored products for local industrial applications.</p>

    <p>By 2035, the Metering Pump Market is expected to exhibit robust growth, reflecting evolving industry needs and technological advancements.</p>

    Market Segmentation

    Metering Pump Market Type Outlook

    • {""=>["Chemical Industry"
    • "Water and Wastewater Management"
    • "Pharmaceutical Industry"
    • "Food and Beverage Industry"]}

    Metering Pump Market Regional Outlook

    • North America
    • Europe
    • South America
    • Asia Pacific
    • Middle East and Africa

    Metering Pump Market Application Outlook

    • {""=>["Diaphragm Pumps"
    • "Peristaltic Pumps"
    • "Gear Pumps"
    • "Piston Pumps"]}

    Metering Pump Market Pump Capacity Outlook

    • {""=>["North America"
    • "Europe"
    • "South America"
    • "Asia Pacific"
    • "Middle East and Africa"]}

    Metering Pump Market End Use Industry Outlook

    • {""=>["Less than 5 LPH"
    • "5 to 20 LPH"
    • "20 to 100 LPH"
    • "More than 100 LPH"]}

    Report Scope

    Attribute/MetricDetails
    Market Size 203511.23 (USD Billion)
    Compound Annual Growth Rate (CAGR)4.50% (2025 - 2035)
    Report CoverageRevenue Forecast, Competitive Landscape, Growth Factors, and Trends
    Base Year2024
    Market Forecast Period2025 - 2035
    Historical Data2019 - 2023
    Market Forecast UnitsUSD Billion
    Key Companies ProfiledHale Hamilton, Flowserve, GormanRupp, ProMinent, Viking Pump, KSB, WatsonMarlow, Grundfos, Netzsch Pumps, Pulsafeeder, Graco, Apex Pumps, Iwaki, BlueWhite Industries, Versa Matic
    Segments CoveredApplication, Type, End Use Industry, Pump Capacity, Regional
    Key Market OpportunitiesRising demand in chemical processing, Growth in water treatment facilities, Expansion of the pharmaceuticals sector, Technological advancements in pump design, Increased focus on energy efficiency
    Key Market DynamicsIncreasing industrial automation, Rising demand for chemical processing, Growth in water treatment facilities, Advancements in metering technology, Stringent regulations for chemical handling
    Countries CoveredNorth America, Europe, APAC, South America, MEA
    Market Size 20246.92 (USD Billion)
    Market Size 20257.23 (USD Billion)

    Market Highlights

    Author

    Anshula Mandaokar
    Team Lead - Research

    She holds an experience of about 6+ years in market research and business consulting, working under the spectrum of information communication technology, telecommunications and semiconductor domains. aarti conceptualizes and implements a scalable business strategy and provides strategic leadership to the clients. her expertise lies in market estimation, competitive intelligence, pipeline analysis, customer assessment, etc.

    Leave a Comment

    Latest Comments

    John Doe
    john@example.com

    This is a great article! Really helped me understand the topic better.

    Posted on July 23, 2025, 10:15 AM
    Jane Smith
    jane@domain.com

    Thanks for sharing this. I’ve bookmarked it for later reference.

    Posted on July 22, 2025, 7:45 PM

    FAQs

    What is the expected market size of the Metering Pump Market in 2032?

    The Metering Pump Market is expected to be valued at 8.2 USD Billion in 2032.

    What is the predicted CAGR for the Metering Pump Market from 2024 to 2032?

    The expected CAGR for the Metering Pump Market from 2024 to 2032 is 4.21%.

    Which region holds the largest market share in the Metering Pump Market in 2023?

    North America holds the largest market share in the Metering Pump Market, valued at 2.1 USD Billion in 2023.

    What is the market value of the Water Treatment application in 2032?

    The market value of the Water Treatment application is expected to reach 2.2 USD Billion in 2032.

    Who are the key players in the Metering Pump Market?

    Major players in the market include Hale Hamilton, Flowserve, GormanRupp, ProMinent, and Viking Pump.

    What is the expected market size for the Chemicals Processing application in 2032?

    The Chemicals Processing application is expected to reach a market size of 1.7 USD Billion in 2032.

    What is the expected growth rate of the Pharmaceuticals application from 2023 to 2032?

    The Pharmaceuticals application is projected to grow from 1.0 USD Billion in 2023 to 1.5 USD Billion in 2032.

    What is the market size for the APAC region in 2032?

    The market size for the APAC region is expected to be 2.0 USD Billion in 2032.

    What is the projected market value of the Oil and Gas application in 2032?

    The Oil and Gas application is projected to reach a market value of 1.7 USD Billion in 2032.

    What is the forecasted market size for South America in 2032?

    The forecasted market size for South America is expected to be 0.6 USD Billion in 2032.

    1. . EXECUTIVE SUMMARY
    2. . Market Overview
    3. . Key Findings
    4. . Market Segmentation
    5. . Competitive Landscape
    6. . Challenges and Opportunities
    7. . Future Outlook
    8. . MARKET INTRODUCTION
    9. . Definition
    10. . Scope of the study
    11. . Research Objective
    12. . Assumption
    13. . Limitations
    14. . RESEARCH METHODOLOGY
    15. . Overview
    16. . Data Mining
    17. . Secondary Research
    18. . Primary Research
    19. . Primary Interviews and Information Gathering Process
    20. . Breakdown of Primary Respondents
    21. . Forecasting Model
    22. . Market Size Estimation
    23. . Bottom-Up Approach
    24. . Top-Down Approach
    25. . Data Triangulation
    26. . Validation
    27. . MARKET DYNAMICS
    28. . Overview
    29. . Drivers
    30. . Restraints
    31. . Opportunities
    32. . MARKET FACTOR ANALYSIS
    33. . Value chain Analysis
    34. . Porter's Five Forces Analysis
    35. . Bargaining Power of Suppliers
    36. . Bargaining Power of Buyers
    37. . Threat of New Entrants
    38. . Threat of Substitutes
    39. . Intensity of Rivalry
    40. . COVID-19 Impact Analysis
    41. . Market Impact Analysis
    42. . Regional Impact
    43. . Opportunity and Threat Analysis
    44. . METERING PUMP MARKET, BY APPLICATION (USD BILLION)
    45. . Water Treatment
    46. . Chemicals Processing
    47. . Food and Beverage
    48. . Pharmaceuticals
    49. . Oil and Gas
    50. . METERING PUMP MARKET, BY TYPE (USD BILLION)
    51. . Diaphragm Pumps
    52. . Peristaltic Pumps
    53. . Gear Pumps
    54. . Piston Pumps
    55. . METERING PUMP MARKET, BY END USE INDUSTRY (USD BILLION)
    56. . Chemical Industry
    57. . Water and Wastewater Management
    58. . Pharmaceutical Industry
    59. . Food and Beverage Industry
    60. . METERING PUMP MARKET, BY PUMP CAPACITY (USD BILLION)
    61. . Less than 5 LPH
    62. . 5 to 20 LPH
    63. . 20 to 100 LPH
    64. . More than 100 LPH
    65. . METERING PUMP MARKET, BY REGIONAL (USD BILLION)
    66. . North America
    67. . US
    68. . Canada
    69. . Europe
    70. . Germany
    71. . UK
    72. . France
    73. . Russia
    74. . Italy
    75. . Spain
    76. . Rest of Europe
    77. . APAC
    78. . China
    79. . India
    80. . Japan
    81. . South Korea
    82. . Malaysia
    83. . Thailand
    84. . Indonesia
    85. . Rest of APAC
    86. . South America
    87. . Brazil
    88. . Mexico
    89. . Argentina
    90. . Rest of South America
    91. . MEA
    92. . GCC Countries
    93. . South Africa
    94. . Rest of MEA
    95. . COMPETITIVE LANDSCAPE
    96. . Overview
    97. . Competitive Analysis
    98. . Market share Analysis
    99. . Major Growth Strategy in the Metering Pump Market
    100. . Competitive Benchmarking
    101. . Leading Players in Terms of Number of Developments in the Metering Pump Market
    102. . Key developments and growth strategies
    103. . New Product Launch/Service Deployment
    104. . Merger & Acquisitions
    105. . Joint Ventures
    106. . Major Players Financial Matrix
    107. . Sales and Operating Income
    108. . Major Players R&D Expenditure. 2023
    109. . COMPANY PROFILES
    110. . Hale Hamilton
    111. . Financial Overview
    112. . Products Offered
    113. . Key Developments
    114. . SWOT Analysis
    115. . Key Strategies
    116. . Flowserve
    117. . Financial Overview
    118. . Products Offered
    119. . Key Developments
    120. . SWOT Analysis
    121. . Key Strategies
    122. . GormanRupp
    123. . Financial Overview
    124. . Products Offered
    125. . Key Developments
    126. . SWOT Analysis
    127. . Key Strategies
    128. . ProMinent
    129. . Financial Overview
    130. . Products Offered
    131. . Key Developments
    132. . SWOT Analysis
    133. . Key Strategies
    134. . Viking Pump
    135. . Financial Overview
    136. . Products Offered
    137. . Key Developments
    138. . SWOT Analysis
    139. . Key Strategies
    140. . KSB
    141. . Financial Overview
    142. . Products Offered
    143. . Key Developments
    144. . SWOT Analysis
    145. . Key Strategies
    146. . WatsonMarlow
    147. . Financial Overview
    148. . Products Offered
    149. . Key Developments
    150. . SWOT Analysis
    151. . Key Strategies
    152. . Grundfos
    153. . Financial Overview
    154. . Products Offered
    155. . Key Developments
    156. . SWOT Analysis
    157. . Key Strategies
    158. . Netzsch Pumps
    159. . Financial Overview
    160. . Products Offered
    161. . Key Developments
    162. . SWOT Analysis
    163. . Key Strategies
    164. . Pulsafeeder
    165. . Financial Overview
    166. . Products Offered
    167. . Key Developments
    168. . SWOT Analysis
    169. . Key Strategies
    170. . Graco
    171. . Financial Overview
    172. . Products Offered
    173. . Key Developments
    174. . SWOT Analysis
    175. . Key Strategies
    176. . Apex Pumps
    177. . Financial Overview
    178. . Products Offered
    179. . Key Developments
    180. . SWOT Analysis
    181. . Key Strategies
    182. . Iwaki
    183. . Financial Overview
    184. . Products Offered
    185. . Key Developments
    186. . SWOT Analysis
    187. . Key Strategies
    188. . BlueWhite Industries
    189. . Financial Overview
    190. . Products Offered
    191. . Key Developments
    192. . SWOT Analysis
    193. . Key Strategies
    194. . Versa Matic
    195. . Financial Overview
    196. . Products Offered
    197. . Key Developments
    198. . SWOT Analysis
    199. . Key Strategies
    200. . APPENDIX
    201. . References
    202. . Related Reports LIST OF TABLES TABLE
    203. . LIST OF ASSUMPTIONS TABLE
    204. . NORTH AMERICA METERING PUMP MARKET SIZE ESTIMATES & FORECAST, BY APPLICATION, 2019-2032 (USD BILLIONS) TABLE
    205. . NORTH AMERICA METERING PUMP MARKET SIZE ESTIMATES & FORECAST, BY TYPE, 2019-2032 (USD BILLIONS) TABLE
    206. . NORTH AMERICA METERING PUMP MARKET SIZE ESTIMATES & FORECAST, BY END USE INDUSTRY, 2019-2032 (USD BILLIONS) TABLE
    207. . NORTH AMERICA METERING PUMP MARKET SIZE ESTIMATES & FORECAST, BY PUMP CAPACITY, 2019-2032 (USD BILLIONS) TABLE
    208. . NORTH AMERICA METERING PUMP MARKET SIZE ESTIMATES & FORECAST, BY REGIONAL, 2019-2032 (USD BILLIONS) TABLE
    209. . US METERING PUMP MARKET SIZE ESTIMATES & FORECAST, BY APPLICATION, 2019-2032 (USD BILLIONS) TABLE
    210. . US METERING PUMP MARKET SIZE ESTIMATES & FORECAST, BY TYPE, 2019-2032 (USD BILLIONS) TABLE
    211. . US METERING PUMP MARKET SIZE ESTIMATES & FORECAST, BY END USE INDUSTRY, 2019-2032 (USD BILLIONS) TABLE
    212. . US METERING PUMP MARKET SIZE ESTIMATES & FORECAST, BY PUMP CAPACITY, 2019-2032 (USD BILLIONS) TABLE
    213. . US METERING PUMP MARKET SIZE ESTIMATES & FORECAST, BY REGIONAL, 2019-2032 (USD BILLIONS) TABLE
    214. . CANADA METERING PUMP MARKET SIZE ESTIMATES & FORECAST, BY APPLICATION, 2019-2032 (USD BILLIONS) TABLE
    215. . CANADA METERING PUMP MARKET SIZE ESTIMATES & FORECAST, BY TYPE, 2019-2032 (USD BILLIONS) TABLE
    216. . CANADA METERING PUMP MARKET SIZE ESTIMATES & FORECAST, BY END USE INDUSTRY, 2019-2032 (USD BILLIONS) TABLE
    217. . CANADA METERING PUMP MARKET SIZE ESTIMATES & FORECAST, BY PUMP CAPACITY, 2019-2032 (USD BILLIONS) TABLE
    218. . CANADA METERING PUMP MARKET SIZE ESTIMATES & FORECAST, BY REGIONAL, 2019-2032 (USD BILLIONS) TABLE
    219. . EUROPE METERING PUMP MARKET SIZE ESTIMATES & FORECAST, BY APPLICATION, 2019-2032 (USD BILLIONS) TABLE
    220. . EUROPE METERING PUMP MARKET SIZE ESTIMATES & FORECAST, BY TYPE, 2019-2032 (USD BILLIONS) TABLE
    221. . EUROPE METERING PUMP MARKET SIZE ESTIMATES & FORECAST, BY END USE INDUSTRY, 2019-2032 (USD BILLIONS) TABLE
    222. . EUROPE METERING PUMP MARKET SIZE ESTIMATES & FORECAST, BY PUMP CAPACITY, 2019-2032 (USD BILLIONS) TABLE
    223. . EUROPE METERING PUMP MARKET SIZE ESTIMATES & FORECAST, BY REGIONAL, 2019-2032 (USD BILLIONS) TABLE
    224. . GERMANY METERING PUMP MARKET SIZE ESTIMATES & FORECAST, BY APPLICATION, 2019-2032 (USD BILLIONS) TABLE
    225. . GERMANY METERING PUMP MARKET SIZE ESTIMATES & FORECAST, BY TYPE, 2019-2032 (USD BILLIONS) TABLE
    226. . GERMANY METERING PUMP MARKET SIZE ESTIMATES & FORECAST, BY END USE INDUSTRY, 2019-2032 (USD BILLIONS) TABLE
    227. . GERMANY METERING PUMP MARKET SIZE ESTIMATES & FORECAST, BY PUMP CAPACITY, 2019-2032 (USD BILLIONS) TABLE
    228. . GERMANY METERING PUMP MARKET SIZE ESTIMATES & FORECAST, BY REGIONAL, 2019-2032 (USD BILLIONS) TABLE
    229. . UK METERING PUMP MARKET SIZE ESTIMATES & FORECAST, BY APPLICATION, 2019-2032 (USD BILLIONS) TABLE
    230. . UK METERING PUMP MARKET SIZE ESTIMATES & FORECAST, BY TYPE, 2019-2032 (USD BILLIONS) TABLE
    231. . UK METERING PUMP MARKET SIZE ESTIMATES & FORECAST, BY END USE INDUSTRY, 2019-2032 (USD BILLIONS) TABLE
    232. . UK METERING PUMP MARKET SIZE ESTIMATES & FORECAST, BY PUMP CAPACITY, 2019-2032 (USD BILLIONS) TABLE
    233. . UK METERING PUMP MARKET SIZE ESTIMATES & FORECAST, BY REGIONAL, 2019-2032 (USD BILLIONS) TABLE
    234. . FRANCE METERING PUMP MARKET SIZE ESTIMATES & FORECAST, BY APPLICATION, 2019-2032 (USD BILLIONS) TABLE
    235. . FRANCE METERING PUMP MARKET SIZE ESTIMATES & FORECAST, BY TYPE, 2019-2032 (USD BILLIONS) TABLE
    236. . FRANCE METERING PUMP MARKET SIZE ESTIMATES & FORECAST, BY END USE INDUSTRY, 2019-2032 (USD BILLIONS) TABLE
    237. . FRANCE METERING PUMP MARKET SIZE ESTIMATES & FORECAST, BY PUMP CAPACITY, 2019-2032 (USD BILLIONS) TABLE
    238. . FRANCE METERING PUMP MARKET SIZE ESTIMATES & FORECAST, BY REGIONAL, 2019-2032 (USD BILLIONS) TABLE
    239. . RUSSIA METERING PUMP MARKET SIZE ESTIMATES & FORECAST, BY APPLICATION, 2019-2032 (USD BILLIONS) TABLE
    240. . RUSSIA METERING PUMP MARKET SIZE ESTIMATES & FORECAST, BY TYPE, 2019-2032 (USD BILLIONS) TABLE
    241. . RUSSIA METERING PUMP MARKET SIZE ESTIMATES & FORECAST, BY END USE INDUSTRY, 2019-2032 (USD BILLIONS) TABLE
    242. . RUSSIA METERING PUMP MARKET SIZE ESTIMATES & FORECAST, BY PUMP CAPACITY, 2019-2032 (USD BILLIONS) TABLE
    243. . RUSSIA METERING PUMP MARKET SIZE ESTIMATES & FORECAST, BY REGIONAL, 2019-2032 (USD BILLIONS) TABLE
    244. . ITALY METERING PUMP MARKET SIZE ESTIMATES & FORECAST, BY APPLICATION, 2019-2032 (USD BILLIONS) TABLE
    245. . ITALY METERING PUMP MARKET SIZE ESTIMATES & FORECAST, BY TYPE, 2019-2032 (USD BILLIONS) TABLE
    246. . ITALY METERING PUMP MARKET SIZE ESTIMATES & FORECAST, BY END USE INDUSTRY, 2019-2032 (USD BILLIONS) TABLE
    247. . ITALY METERING PUMP MARKET SIZE ESTIMATES & FORECAST, BY PUMP CAPACITY, 2019-2032 (USD BILLIONS) TABLE
    248. . ITALY METERING PUMP MARKET SIZE ESTIMATES & FORECAST, BY REGIONAL, 2019-2032 (USD BILLIONS) TABLE
    249. . SPAIN METERING PUMP MARKET SIZE ESTIMATES & FORECAST, BY APPLICATION, 2019-2032 (USD BILLIONS) TABLE
    250. . SPAIN METERING PUMP MARKET SIZE ESTIMATES & FORECAST, BY TYPE, 2019-2032 (USD BILLIONS) TABLE
    251. . SPAIN METERING PUMP MARKET SIZE ESTIMATES & FORECAST, BY END USE INDUSTRY, 2019-2032 (USD BILLIONS) TABLE
    252. . SPAIN METERING PUMP MARKET SIZE ESTIMATES & FORECAST, BY PUMP CAPACITY, 2019-2032 (USD BILLIONS) TABLE
    253. . SPAIN METERING PUMP MARKET SIZE ESTIMATES & FORECAST, BY REGIONAL, 2019-2032 (USD BILLIONS) TABLE
    254. . REST OF EUROPE METERING PUMP MARKET SIZE ESTIMATES & FORECAST, BY APPLICATION, 2019-2032 (USD BILLIONS) TABLE
    255. . REST OF EUROPE METERING PUMP MARKET SIZE ESTIMATES & FORECAST, BY TYPE, 2019-2032 (USD BILLIONS) TABLE
    256. . REST OF EUROPE METERING PUMP MARKET SIZE ESTIMATES & FORECAST, BY END USE INDUSTRY, 2019-2032 (USD BILLIONS) TABLE
    257. . REST OF EUROPE METERING PUMP MARKET SIZE ESTIMATES & FORECAST, BY PUMP CAPACITY, 2019-2032 (USD BILLIONS) TABLE
    258. . REST OF EUROPE METERING PUMP MARKET SIZE ESTIMATES & FORECAST, BY REGIONAL, 2019-2032 (USD BILLIONS) TABLE
    259. . APAC METERING PUMP MARKET SIZE ESTIMATES & FORECAST, BY APPLICATION, 2019-2032 (USD BILLIONS) TABLE
    260. . APAC METERING PUMP MARKET SIZE ESTIMATES & FORECAST, BY TYPE, 2019-2032 (USD BILLIONS) TABLE
    261. . APAC METERING PUMP MARKET SIZE ESTIMATES & FORECAST, BY END USE INDUSTRY, 2019-2032 (USD BILLIONS) TABLE
    262. . APAC METERING PUMP MARKET SIZE ESTIMATES & FORECAST, BY PUMP CAPACITY, 2019-2032 (USD BILLIONS) TABLE
    263. . APAC METERING PUMP MARKET SIZE ESTIMATES & FORECAST, BY REGIONAL, 2019-2032 (USD BILLIONS) TABLE
    264. . CHINA METERING PUMP MARKET SIZE ESTIMATES & FORECAST, BY APPLICATION, 2019-2032 (USD BILLIONS) TABLE
    265. . CHINA METERING PUMP MARKET SIZE ESTIMATES & FORECAST, BY TYPE, 2019-2032 (USD BILLIONS) TABLE
    266. . CHINA METERING PUMP MARKET SIZE ESTIMATES & FORECAST, BY END USE INDUSTRY, 2019-2032 (USD BILLIONS) TABLE
    267. . CHINA METERING PUMP MARKET SIZE ESTIMATES & FORECAST, BY PUMP CAPACITY, 2019-2032 (USD BILLIONS) TABLE
    268. . CHINA METERING PUMP MARKET SIZE ESTIMATES & FORECAST, BY REGIONAL, 2019-2032 (USD BILLIONS) TABLE
    269. . INDIA METERING PUMP MARKET SIZE ESTIMATES & FORECAST, BY APPLICATION, 2019-2032 (USD BILLIONS) TABLE
    270. . INDIA METERING PUMP MARKET SIZE ESTIMATES & FORECAST, BY TYPE, 2019-2032 (USD BILLIONS) TABLE
    271. . INDIA METERING PUMP MARKET SIZE ESTIMATES & FORECAST, BY END USE INDUSTRY, 2019-2032 (USD BILLIONS) TABLE
    272. . INDIA METERING PUMP MARKET SIZE ESTIMATES & FORECAST, BY PUMP CAPACITY, 2019-2032 (USD BILLIONS) TABLE
    273. . INDIA METERING PUMP MARKET SIZE ESTIMATES & FORECAST, BY REGIONAL, 2019-2032 (USD BILLIONS) TABLE
    274. . JAPAN METERING PUMP MARKET SIZE ESTIMATES & FORECAST, BY APPLICATION, 2019-2032 (USD BILLIONS) TABLE
    275. . JAPAN METERING PUMP MARKET SIZE ESTIMATES & FORECAST, BY TYPE, 2019-2032 (USD BILLIONS) TABLE
    276. . JAPAN METERING PUMP MARKET SIZE ESTIMATES & FORECAST, BY END USE INDUSTRY, 2019-2032 (USD BILLIONS) TABLE
    277. . JAPAN METERING PUMP MARKET SIZE ESTIMATES & FORECAST, BY PUMP CAPACITY, 2019-2032 (USD BILLIONS) TABLE
    278. . JAPAN METERING PUMP MARKET SIZE ESTIMATES & FORECAST, BY REGIONAL, 2019-2032 (USD BILLIONS) TABLE
    279. . SOUTH KOREA METERING PUMP MARKET SIZE ESTIMATES & FORECAST, BY APPLICATION, 2019-2032 (USD BILLIONS) TABLE
    280. . SOUTH KOREA METERING PUMP MARKET SIZE ESTIMATES & FORECAST, BY TYPE, 2019-2032 (USD BILLIONS) TABLE
    281. . SOUTH KOREA METERING PUMP MARKET SIZE ESTIMATES & FORECAST, BY END USE INDUSTRY, 2019-2032 (USD BILLIONS) TABLE
    282. . SOUTH KOREA METERING PUMP MARKET SIZE ESTIMATES & FORECAST, BY PUMP CAPACITY, 2019-2032 (USD BILLIONS) TABLE
    283. . SOUTH KOREA METERING PUMP MARKET SIZE ESTIMATES & FORECAST, BY REGIONAL, 2019-2032 (USD BILLIONS) TABLE
    284. . MALAYSIA METERING PUMP MARKET SIZE ESTIMATES & FORECAST, BY APPLICATION, 2019-2032 (USD BILLIONS) TABLE
    285. . MALAYSIA METERING PUMP MARKET SIZE ESTIMATES & FORECAST, BY TYPE, 2019-2032 (USD BILLIONS) TABLE
    286. . MALAYSIA METERING PUMP MARKET SIZE ESTIMATES & FORECAST, BY END USE INDUSTRY, 2019-2032 (USD BILLIONS) TABLE
    287. . MALAYSIA METERING PUMP MARKET SIZE ESTIMATES & FORECAST, BY PUMP CAPACITY, 2019-2032 (USD BILLIONS) TABLE
    288. . MALAYSIA METERING PUMP MARKET SIZE ESTIMATES & FORECAST, BY REGIONAL, 2019-2032 (USD BILLIONS) TABLE
    289. . THAILAND METERING PUMP MARKET SIZE ESTIMATES & FORECAST, BY APPLICATION, 2019-2032 (USD BILLIONS) TABLE
    290. . THAILAND METERING PUMP MARKET SIZE ESTIMATES & FORECAST, BY TYPE, 2019-2032 (USD BILLIONS) TABLE
    291. . THAILAND METERING PUMP MARKET SIZE ESTIMATES & FORECAST, BY END USE INDUSTRY, 2019-2032 (USD BILLIONS) TABLE
    292. . THAILAND METERING PUMP MARKET SIZE ESTIMATES & FORECAST, BY PUMP CAPACITY, 2019-2032 (USD BILLIONS) TABLE
    293. . THAILAND METERING PUMP MARKET SIZE ESTIMATES & FORECAST, BY REGIONAL, 2019-2032 (USD BILLIONS) TABLE
    294. . INDONESIA METERING PUMP MARKET SIZE ESTIMATES & FORECAST, BY APPLICATION, 2019-2032 (USD BILLIONS) TABLE
    295. . INDONESIA METERING PUMP MARKET SIZE ESTIMATES & FORECAST, BY TYPE, 2019-2032 (USD BILLIONS) TABLE
    296. . INDONESIA METERING PUMP MARKET SIZE ESTIMATES & FORECAST, BY END USE INDUSTRY, 2019-2032 (USD BILLIONS) TABLE
    297. . INDONESIA METERING PUMP MARKET SIZE ESTIMATES & FORECAST, BY PUMP CAPACITY, 2019-2032 (USD BILLIONS) TABLE
    298. . INDONESIA METERING PUMP MARKET SIZE ESTIMATES & FORECAST, BY REGIONAL, 2019-2032 (USD BILLIONS) TABLE
    299. . REST OF APAC METERING PUMP MARKET SIZE ESTIMATES & FORECAST, BY APPLICATION, 2019-2032 (USD BILLIONS) TABLE
    300. . REST OF APAC METERING PUMP MARKET SIZE ESTIMATES & FORECAST, BY TYPE, 2019-2032 (USD BILLIONS) TABLE
    301. . REST OF APAC METERING PUMP MARKET SIZE ESTIMATES & FORECAST, BY END USE INDUSTRY, 2019-2032 (USD BILLIONS) TABLE
    302. . REST OF APAC METERING PUMP MARKET SIZE ESTIMATES & FORECAST, BY PUMP CAPACITY, 2019-2032 (USD BILLIONS) TABLE
    303. . REST OF APAC METERING PUMP MARKET SIZE ESTIMATES & FORECAST, BY REGIONAL, 2019-2032 (USD BILLIONS) TABLE
    304. . SOUTH AMERICA METERING PUMP MARKET SIZE ESTIMATES & FORECAST, BY APPLICATION, 2019-2032 (USD BILLIONS) TABLE
    305. . SOUTH AMERICA METERING PUMP MARKET SIZE ESTIMATES & FORECAST, BY TYPE, 2019-2032 (USD BILLIONS) TABLE
    306. . SOUTH AMERICA METERING PUMP MARKET SIZE ESTIMATES & FORECAST, BY END USE INDUSTRY, 2019-2032 (USD BILLIONS) TABLE
    307. . SOUTH AMERICA METERING PUMP MARKET SIZE ESTIMATES & FORECAST, BY PUMP CAPACITY, 2019-2032 (USD BILLIONS) TABLE
    308. . SOUTH AMERICA METERING PUMP MARKET SIZE ESTIMATES & FORECAST, BY REGIONAL, 2019-2032 (USD BILLIONS) TABLE
    309. . BRAZIL METERING PUMP MARKET SIZE ESTIMATES & FORECAST, BY APPLICATION, 2019-2032 (USD BILLIONS) TABLE
    310. . BRAZIL METERING PUMP MARKET SIZE ESTIMATES & FORECAST, BY TYPE, 2019-2032 (USD BILLIONS) TABLE
    311. . BRAZIL METERING PUMP MARKET SIZE ESTIMATES & FORECAST, BY END USE INDUSTRY, 2019-2032 (USD BILLIONS) TABLE
    312. . BRAZIL METERING PUMP MARKET SIZE ESTIMATES & FORECAST, BY PUMP CAPACITY, 2019-2032 (USD BILLIONS) TABLE
    313. . BRAZIL METERING PUMP MARKET SIZE ESTIMATES & FORECAST, BY REGIONAL, 2019-2032 (USD BILLIONS) TABLE
    314. . MEXICO METERING PUMP MARKET SIZE ESTIMATES & FORECAST, BY APPLICATION, 2019-2032 (USD BILLIONS) TABLE
    315. . MEXICO METERING PUMP MARKET SIZE ESTIMATES & FORECAST, BY TYPE, 2019-2032 (USD BILLIONS) TABLE
    316. . MEXICO METERING PUMP MARKET SIZE ESTIMATES & FORECAST, BY END USE INDUSTRY, 2019-2032 (USD BILLIONS) TABLE
    317. . MEXICO METERING PUMP MARKET SIZE ESTIMATES & FORECAST, BY PUMP CAPACITY, 2019-2032 (USD BILLIONS) TABLE
    318. . MEXICO METERING PUMP MARKET SIZE ESTIMATES & FORECAST, BY REGIONAL, 2019-2032 (USD BILLIONS) TABLE
    319. . ARGENTINA METERING PUMP MARKET SIZE ESTIMATES & FORECAST, BY APPLICATION, 2019-2032 (USD BILLIONS) TABLE
    320. . ARGENTINA METERING PUMP MARKET SIZE ESTIMATES & FORECAST, BY TYPE, 2019-2032 (USD BILLIONS) TABLE
    321. . ARGENTINA METERING PUMP MARKET SIZE ESTIMATES & FORECAST, BY END USE INDUSTRY, 2019-2032 (USD BILLIONS) TABLE
    322. . ARGENTINA METERING PUMP MARKET SIZE ESTIMATES & FORECAST, BY PUMP CAPACITY, 2019-2032 (USD BILLIONS) TABLE
    323. . ARGENTINA METERING PUMP MARKET SIZE ESTIMATES & FORECAST, BY REGIONAL, 2019-2032 (USD BILLIONS) TABLE
    324. . REST OF SOUTH AMERICA METERING PUMP MARKET SIZE ESTIMATES & FORECAST, BY APPLICATION, 2019-2032 (USD BILLIONS) TABLE
    325. . REST OF SOUTH AMERICA METERING PUMP MARKET SIZE ESTIMATES & FORECAST, BY TYPE, 2019-2032 (USD BILLIONS) TABLE
    326. . REST OF SOUTH AMERICA METERING PUMP MARKET SIZE ESTIMATES & FORECAST, BY END USE INDUSTRY, 2019-2032 (USD BILLIONS) TABLE
    327. . REST OF SOUTH AMERICA METERING PUMP MARKET SIZE ESTIMATES & FORECAST, BY PUMP CAPACITY, 2019-2032 (USD BILLIONS) TABLE
    328. . REST OF SOUTH AMERICA METERING PUMP MARKET SIZE ESTIMATES & FORECAST, BY REGIONAL, 2019-2032 (USD BILLIONS) TABLE
    329. . MEA METERING PUMP MARKET SIZE ESTIMATES & FORECAST, BY APPLICATION, 2019-2032 (USD BILLIONS) TABLE
    330. . MEA METERING PUMP MARKET SIZE ESTIMATES & FORECAST, BY TYPE, 2019-2032 (USD BILLIONS) TABLE
    331. . MEA METERING PUMP MARKET SIZE ESTIMATES & FORECAST, BY END USE INDUSTRY, 2019-2032 (USD BILLIONS) TABLE
    332. . MEA METERING PUMP MARKET SIZE ESTIMATES & FORECAST, BY PUMP CAPACITY, 2019-2032 (USD BILLIONS) TABLE
    333. . MEA METERING PUMP MARKET SIZE ESTIMATES & FORECAST, BY REGIONAL, 2019-2032 (USD BILLIONS) TABLE
    334. . GCC COUNTRIES METERING PUMP MARKET SIZE ESTIMATES & FORECAST, BY APPLICATION, 2019-2032 (USD BILLIONS) TABLE
    335. . GCC COUNTRIES METERING PUMP MARKET SIZE ESTIMATES & FORECAST, BY TYPE, 2019-2032 (USD BILLIONS) TABLE
    336. . GCC COUNTRIES METERING PUMP MARKET SIZE ESTIMATES & FORECAST, BY END USE INDUSTRY, 2019-2032 (USD BILLIONS) TABLE
    337. . GCC COUNTRIES METERING PUMP MARKET SIZE ESTIMATES & FORECAST, BY PUMP CAPACITY, 2019-2032 (USD BILLIONS) TABLE
    338. . GCC COUNTRIES METERING PUMP MARKET SIZE ESTIMATES & FORECAST, BY REGIONAL, 2019-2032 (USD BILLIONS) TABLE
    339. . SOUTH AFRICA METERING PUMP MARKET SIZE ESTIMATES & FORECAST, BY APPLICATION, 2019-2032 (USD BILLIONS) TABLE
    340. . SOUTH AFRICA METERING PUMP MARKET SIZE ESTIMATES & FORECAST, BY TYPE, 2019-2032 (USD BILLIONS) TABLE
    341. . SOUTH AFRICA METERING PUMP MARKET SIZE ESTIMATES & FORECAST, BY END USE INDUSTRY, 2019-2032 (USD BILLIONS) TABLE
    342. . SOUTH AFRICA METERING PUMP MARKET SIZE ESTIMATES & FORECAST, BY PUMP CAPACITY, 2019-2032 (USD BILLIONS) TABLE
    343. . SOUTH AFRICA METERING PUMP MARKET SIZE ESTIMATES & FORECAST, BY REGIONAL, 2019-2032 (USD BILLIONS) TABLE
    344. . REST OF MEA METERING PUMP MARKET SIZE ESTIMATES & FORECAST, BY APPLICATION, 2019-2032 (USD BILLIONS) TABLE
    345. . REST OF MEA METERING PUMP MARKET SIZE ESTIMATES & FORECAST, BY TYPE, 2019-2032 (USD BILLIONS) TABLE
    346. . REST OF MEA METERING PUMP MARKET SIZE ESTIMATES & FORECAST, BY END USE INDUSTRY, 2019-2032 (USD BILLIONS) TABLE
    347. . REST OF MEA METERING PUMP MARKET SIZE ESTIMATES & FORECAST, BY PUMP CAPACITY, 2019-2032 (USD BILLIONS) TABLE
    348. . REST OF MEA METERING PUMP MARKET SIZE ESTIMATES & FORECAST, BY REGIONAL, 2019-2032 (USD BILLIONS) TABLE
    349. . PRODUCT LAUNCH/PRODUCT DEVELOPMENT/APPROVAL TABLE
    350. . ACQUISITION/PARTNERSHIP LIST OF FIGURES FIGURE
    351. . MARKET SYNOPSIS FIGURE
    352. . NORTH AMERICA METERING PUMP MARKET ANALYSIS FIGURE
    353. . US METERING PUMP MARKET ANALYSIS BY APPLICATION FIGURE
    354. . US METERING PUMP MARKET ANALYSIS BY TYPE FIGURE
    355. . US METERING PUMP MARKET ANALYSIS BY END USE INDUSTRY FIGURE
    356. . US METERING PUMP MARKET ANALYSIS BY PUMP CAPACITY FIGURE
    357. . US METERING PUMP MARKET ANALYSIS BY REGIONAL FIGURE
    358. . CANADA METERING PUMP MARKET ANALYSIS BY APPLICATION FIGURE
    359. . CANADA METERING PUMP MARKET ANALYSIS BY TYPE FIGURE
    360. . CANADA METERING PUMP MARKET ANALYSIS BY END USE INDUSTRY FIGURE
    361. . CANADA METERING PUMP MARKET ANALYSIS BY PUMP CAPACITY FIGURE
    362. . CANADA METERING PUMP MARKET ANALYSIS BY REGIONAL FIGURE
    363. . EUROPE METERING PUMP MARKET ANALYSIS FIGURE
    364. . GERMANY METERING PUMP MARKET ANALYSIS BY APPLICATION FIGURE
    365. . GERMANY METERING PUMP MARKET ANALYSIS BY TYPE FIGURE
    366. . GERMANY METERING PUMP MARKET ANALYSIS BY END USE INDUSTRY FIGURE
    367. . GERMANY METERING PUMP MARKET ANALYSIS BY PUMP CAPACITY FIGURE
    368. . GERMANY METERING PUMP MARKET ANALYSIS BY REGIONAL FIGURE
    369. . UK METERING PUMP MARKET ANALYSIS BY APPLICATION FIGURE
    370. . UK METERING PUMP MARKET ANALYSIS BY TYPE FIGURE
    371. . UK METERING PUMP MARKET ANALYSIS BY END USE INDUSTRY FIGURE
    372. . UK METERING PUMP MARKET ANALYSIS BY PUMP CAPACITY FIGURE
    373. . UK METERING PUMP MARKET ANALYSIS BY REGIONAL FIGURE
    374. . FRANCE METERING PUMP MARKET ANALYSIS BY APPLICATION FIGURE
    375. . FRANCE METERING PUMP MARKET ANALYSIS BY TYPE FIGURE
    376. . FRANCE METERING PUMP MARKET ANALYSIS BY END USE INDUSTRY FIGURE
    377. . FRANCE METERING PUMP MARKET ANALYSIS BY PUMP CAPACITY FIGURE
    378. . FRANCE METERING PUMP MARKET ANALYSIS BY REGIONAL FIGURE
    379. . RUSSIA METERING PUMP MARKET ANALYSIS BY APPLICATION FIGURE
    380. . RUSSIA METERING PUMP MARKET ANALYSIS BY TYPE FIGURE
    381. . RUSSIA METERING PUMP MARKET ANALYSIS BY END USE INDUSTRY FIGURE
    382. . RUSSIA METERING PUMP MARKET ANALYSIS BY PUMP CAPACITY FIGURE
    383. . RUSSIA METERING PUMP MARKET ANALYSIS BY REGIONAL FIGURE
    384. . ITALY METERING PUMP MARKET ANALYSIS BY APPLICATION FIGURE
    385. . ITALY METERING PUMP MARKET ANALYSIS BY TYPE FIGURE
    386. . ITALY METERING PUMP MARKET ANALYSIS BY END USE INDUSTRY FIGURE
    387. . ITALY METERING PUMP MARKET ANALYSIS BY PUMP CAPACITY FIGURE
    388. . ITALY METERING PUMP MARKET ANALYSIS BY REGIONAL FIGURE
    389. . SPAIN METERING PUMP MARKET ANALYSIS BY APPLICATION FIGURE
    390. . SPAIN METERING PUMP MARKET ANALYSIS BY TYPE FIGURE
    391. . SPAIN METERING PUMP MARKET ANALYSIS BY END USE INDUSTRY FIGURE
    392. . SPAIN METERING PUMP MARKET ANALYSIS BY PUMP CAPACITY FIGURE
    393. . SPAIN METERING PUMP MARKET ANALYSIS BY REGIONAL FIGURE
    394. . REST OF EUROPE METERING PUMP MARKET ANALYSIS BY APPLICATION FIGURE
    395. . REST OF EUROPE METERING PUMP MARKET ANALYSIS BY TYPE FIGURE
    396. . REST OF EUROPE METERING PUMP MARKET ANALYSIS BY END USE INDUSTRY FIGURE
    397. . REST OF EUROPE METERING PUMP MARKET ANALYSIS BY PUMP CAPACITY FIGURE
    398. . REST OF EUROPE METERING PUMP MARKET ANALYSIS BY REGIONAL FIGURE
    399. . APAC METERING PUMP MARKET ANALYSIS FIGURE
    400. . CHINA METERING PUMP MARKET ANALYSIS BY APPLICATION FIGURE
    401. . CHINA METERING PUMP MARKET ANALYSIS BY TYPE FIGURE
    402. . CHINA METERING PUMP MARKET ANALYSIS BY END USE INDUSTRY FIGURE
    403. . CHINA METERING PUMP MARKET ANALYSIS BY PUMP CAPACITY FIGURE
    404. . CHINA METERING PUMP MARKET ANALYSIS BY REGIONAL FIGURE
    405. . INDIA METERING PUMP MARKET ANALYSIS BY APPLICATION FIGURE
    406. . INDIA METERING PUMP MARKET ANALYSIS BY TYPE FIGURE
    407. . INDIA METERING PUMP MARKET ANALYSIS BY END USE INDUSTRY FIGURE
    408. . INDIA METERING PUMP MARKET ANALYSIS BY PUMP CAPACITY FIGURE
    409. . INDIA METERING PUMP MARKET ANALYSIS BY REGIONAL FIGURE
    410. . JAPAN METERING PUMP MARKET ANALYSIS BY APPLICATION FIGURE
    411. . JAPAN METERING PUMP MARKET ANALYSIS BY TYPE FIGURE
    412. . JAPAN METERING PUMP MARKET ANALYSIS BY END USE INDUSTRY FIGURE
    413. . JAPAN METERING PUMP MARKET ANALYSIS BY PUMP CAPACITY FIGURE
    414. . JAPAN METERING PUMP MARKET ANALYSIS BY REGIONAL FIGURE
    415. . SOUTH KOREA METERING PUMP MARKET ANALYSIS BY APPLICATION FIGURE
    416. . SOUTH KOREA METERING PUMP MARKET ANALYSIS BY TYPE FIGURE
    417. . SOUTH KOREA METERING PUMP MARKET ANALYSIS BY END USE INDUSTRY FIGURE
    418. . SOUTH KOREA METERING PUMP MARKET ANALYSIS BY PUMP CAPACITY FIGURE
    419. . SOUTH KOREA METERING PUMP MARKET ANALYSIS BY REGIONAL FIGURE
    420. . MALAYSIA METERING PUMP MARKET ANALYSIS BY APPLICATION FIGURE
    421. . MALAYSIA METERING PUMP MARKET ANALYSIS BY TYPE FIGURE
    422. . MALAYSIA METERING PUMP MARKET ANALYSIS BY END USE INDUSTRY FIGURE
    423. . MALAYSIA METERING PUMP MARKET ANALYSIS BY PUMP CAPACITY FIGURE
    424. . MALAYSIA METERING PUMP MARKET ANALYSIS BY REGIONAL FIGURE
    425. . THAILAND METERING PUMP MARKET ANALYSIS BY APPLICATION FIGURE
    426. . THAILAND METERING PUMP MARKET ANALYSIS BY TYPE FIGURE
    427. . THAILAND METERING PUMP MARKET ANALYSIS BY END USE INDUSTRY FIGURE
    428. . THAILAND METERING PUMP MARKET ANALYSIS BY PUMP CAPACITY FIGURE
    429. . THAILAND METERING PUMP MARKET ANALYSIS BY REGIONAL FIGURE
    430. . INDONESIA METERING PUMP MARKET ANALYSIS BY APPLICATION FIGURE
    431. . INDONESIA METERING PUMP MARKET ANALYSIS BY TYPE FIGURE
    432. . INDONESIA METERING PUMP MARKET ANALYSIS BY END USE INDUSTRY FIGURE
    433. . INDONESIA METERING PUMP MARKET ANALYSIS BY PUMP CAPACITY FIGURE
    434. . INDONESIA METERING PUMP MARKET ANALYSIS BY REGIONAL FIGURE
    435. . REST OF APAC METERING PUMP MARKET ANALYSIS BY APPLICATION FIGURE
    436. . REST OF APAC METERING PUMP MARKET ANALYSIS BY TYPE FIGURE
    437. . REST OF APAC METERING PUMP MARKET ANALYSIS BY END USE INDUSTRY FIGURE
    438. . REST OF APAC METERING PUMP MARKET ANALYSIS BY PUMP CAPACITY FIGURE
    439. . REST OF APAC METERING PUMP MARKET ANALYSIS BY REGIONAL FIGURE
    440. . SOUTH AMERICA METERING PUMP MARKET ANALYSIS FIGURE
    441. . BRAZIL METERING PUMP MARKET ANALYSIS BY APPLICATION FIGURE
    442. . BRAZIL METERING PUMP MARKET ANALYSIS BY TYPE FIGURE
    443. . BRAZIL METERING PUMP MARKET ANALYSIS BY END USE INDUSTRY FIGURE
    444. . BRAZIL METERING PUMP MARKET ANALYSIS BY PUMP CAPACITY FIGURE
    445. . BRAZIL METERING PUMP MARKET ANALYSIS BY REGIONAL FIGURE
    446. . MEXICO METERING PUMP MARKET ANALYSIS BY APPLICATION FIGURE
    447. . MEXICO METERING PUMP MARKET ANALYSIS BY TYPE FIGURE
    448. . MEXICO METERING PUMP MARKET ANALYSIS BY END USE INDUSTRY FIGURE
    449. . MEXICO METERING PUMP MARKET ANALYSIS BY PUMP CAPACITY FIGURE
    450. . MEXICO METERING PUMP MARKET ANALYSIS BY REGIONAL FIGURE
    451. . ARGENTINA METERING PUMP MARKET ANALYSIS BY APPLICATION FIGURE
    452. . ARGENTINA METERING PUMP MARKET ANALYSIS BY TYPE FIGURE
    453. . ARGENTINA METERING PUMP MARKET ANALYSIS BY END USE INDUSTRY FIGURE
    454. . ARGENTINA METERING PUMP MARKET ANALYSIS BY PUMP CAPACITY FIGURE
    455. . ARGENTINA METERING PUMP MARKET ANALYSIS BY REGIONAL FIGURE
    456. . REST OF SOUTH AMERICA METERING PUMP MARKET ANALYSIS BY APPLICATION FIGURE
    457. . REST OF SOUTH AMERICA METERING PUMP MARKET ANALYSIS BY TYPE FIGURE
    458. . REST OF SOUTH AMERICA METERING PUMP MARKET ANALYSIS BY END USE INDUSTRY FIGURE
    459. . REST OF SOUTH AMERICA METERING PUMP MARKET ANALYSIS BY PUMP CAPACITY FIGURE
    460. . REST OF SOUTH AMERICA METERING PUMP MARKET ANALYSIS BY REGIONAL FIGURE
    461. . MEA METERING PUMP MARKET ANALYSIS FIGURE
    462. . GCC COUNTRIES METERING PUMP MARKET ANALYSIS BY APPLICATION FIGURE
    463. . GCC COUNTRIES METERING PUMP MARKET ANALYSIS BY TYPE FIGURE
    464. . GCC COUNTRIES METERING PUMP MARKET ANALYSIS BY END USE INDUSTRY FIGURE
    465. . GCC COUNTRIES METERING PUMP MARKET ANALYSIS BY PUMP CAPACITY FIGURE
    466. . GCC COUNTRIES METERING PUMP MARKET ANALYSIS BY REGIONAL FIGURE
    467. . SOUTH AFRICA METERING PUMP MARKET ANALYSIS BY APPLICATION FIGURE
    468. . SOUTH AFRICA METERING PUMP MARKET ANALYSIS BY TYPE FIGURE
    469. . SOUTH AFRICA METERING PUMP MARKET ANALYSIS BY END USE INDUSTRY FIGURE
    470. . SOUTH AFRICA METERING PUMP MARKET ANALYSIS BY PUMP CAPACITY FIGURE
    471. . SOUTH AFRICA METERING PUMP MARKET ANALYSIS BY REGIONAL FIGURE
    472. . REST OF MEA METERING PUMP MARKET ANALYSIS BY APPLICATION FIGURE
    473. . REST OF MEA METERING PUMP MARKET ANALYSIS BY TYPE FIGURE
    474. . REST OF MEA METERING PUMP MARKET ANALYSIS BY END USE INDUSTRY FIGURE
    475. . REST OF MEA METERING PUMP MARKET ANALYSIS BY PUMP CAPACITY FIGURE
    476. . REST OF MEA METERING PUMP MARKET ANALYSIS BY REGIONAL FIGURE
    477. . KEY BUYING CRITERIA OF METERING PUMP MARKET FIGURE
    478. . RESEARCH PROCESS OF MRFR FIGURE
    479. . DRO ANALYSIS OF METERING PUMP MARKET FIGURE
    480. . DRIVERS IMPACT ANALYSIS: METERING PUMP MARKET FIGURE
    481. . RESTRAINTS IMPACT ANALYSIS: METERING PUMP MARKET FIGURE
    482. . SUPPLY / VALUE CHAIN: METERING PUMP MARKET FIGURE
    483. . METERING PUMP MARKET, BY APPLICATION, 2024 (% SHARE) FIGURE
    484. . METERING PUMP MARKET, BY APPLICATION, 2019 TO 2032 (USD Billions) FIGURE
    485. . METERING PUMP MARKET, BY TYPE, 2024 (% SHARE) FIGURE
    486. . METERING PUMP MARKET, BY TYPE, 2019 TO 2032 (USD Billions) FIGURE
    487. . METERING PUMP MARKET, BY END USE INDUSTRY, 2024 (% SHARE) FIGURE
    488. . METERING PUMP MARKET, BY END USE INDUSTRY, 2019 TO 2032 (USD Billions) FIGURE
    489. . METERING PUMP MARKET, BY PUMP CAPACITY, 2024 (% SHARE) FIGURE
    490. . METERING PUMP MARKET, BY PUMP CAPACITY, 2019 TO 2032 (USD Billions) FIGURE
    491. . METERING PUMP MARKET, BY REGIONAL, 2024 (% SHARE) FIGURE
    492. . METERING PUMP MARKET, BY REGIONAL, 2019 TO 2032 (USD Billions) FIGURE
    493. . BENCHMARKING OF MAJOR COMPETITORS
    494. List of Tables and Figures
      1. Table FIGURE 1. MARKET SYNOPSIS FIGURE 2. NORTH AMERICA METERING PUMP MARKET ANALYSIS FIGURE 3. US METERING PUMP MARKET ANALYSIS BY APPLICATION FIGURE 4. US METERING PUMP MARKET ANALYSIS BY TYPE FIGURE 5. US METERING PUMP MARKET ANALYSIS BY END USE INDUSTRY FIGURE 6. US METERING PUMP MARKET ANALYSIS BY PUMP CAPACITY FIGURE 7. US METERING PUMP MARKET ANALYSIS BY REGIONAL FIGURE 8. CANADA METERING PUMP MARKET ANALYSIS BY APPLICATION FIGURE 9. CANADA METERING PUMP MARKET ANALYSIS BY TYPE FIGURE 10. CANADA METERING PUMP MARKET ANALYSIS BY END USE INDUSTRY FIGURE 11. CANADA METERING PUMP MARKET ANALYSIS BY PUMP CAPACITY FIGURE 12. CANADA METERING PUMP MARKET ANALYSIS BY REGIONAL FIGURE 13. EUROPE METERING PUMP MARKET ANALYSIS FIGURE 14. GERMANY METERING PUMP MARKET ANALYSIS BY APPLICATION FIGURE 15. GERMANY METERING PUMP MARKET ANALYSIS BY TYPE FIGURE 16. GERMANY METERING PUMP MARKET ANALYSIS BY END USE INDUSTRY FIGURE 17. GERMANY METERING PUMP MARKET ANALYSIS BY PUMP CAPACITY FIGURE 18. GERMANY METERING PUMP MARKET ANALYSIS BY REGIONAL FIGURE 19. UK METERING PUMP MARKET ANALYSIS BY APPLICATION FIGURE 20. UK METERING PUMP MARKET ANALYSIS BY TYPE FIGURE 21. UK METERING PUMP MARKET ANALYSIS BY END USE INDUSTRY FIGURE 22. UK METERING PUMP MARKET ANALYSIS BY PUMP CAPACITY FIGURE 23. UK METERING PUMP MARKET ANALYSIS BY REGIONAL FIGURE 24. FRANCE METERING PUMP MARKET ANALYSIS BY APPLICATION FIGURE 25. FRANCE METERING PUMP MARKET ANALYSIS BY TYPE FIGURE 26. FRANCE METERING PUMP MARKET ANALYSIS BY END USE INDUSTRY FIGURE 27. FRANCE METERING PUMP MARKET ANALYSIS BY PUMP CAPACITY FIGURE 28. FRANCE METERING PUMP MARKET ANALYSIS BY REGIONAL FIGURE 29. RUSSIA METERING PUMP MARKET ANALYSIS BY APPLICATION FIGURE 30. RUSSIA METERING PUMP MARKET ANALYSIS BY TYPE FIGURE 31. RUSSIA METERING PUMP MARKET ANALYSIS BY END USE INDUSTRY FIGURE 32. RUSSIA METERING PUMP MARKET ANALYSIS BY PUMP CAPACITY FIGURE 33. RUSSIA METERING PUMP MARKET ANALYSIS BY REGIONAL FIGURE 34. ITALY METERING PUMP MARKET ANALYSIS BY APPLICATION FIGURE 35. ITALY METERING PUMP MARKET ANALYSIS BY TYPE FIGURE 36. ITALY METERING PUMP MARKET ANALYSIS BY END USE INDUSTRY FIGURE 37. ITALY METERING PUMP MARKET ANALYSIS BY PUMP CAPACITY FIGURE 38. ITALY METERING PUMP MARKET ANALYSIS BY REGIONAL FIGURE 39. SPAIN METERING PUMP MARKET ANALYSIS BY APPLICATION FIGURE 40. SPAIN METERING PUMP MARKET ANALYSIS BY TYPE FIGURE 41. SPAIN METERING PUMP MARKET ANALYSIS BY END USE INDUSTRY FIGURE 42. SPAIN METERING PUMP MARKET ANALYSIS BY PUMP CAPACITY FIGURE 43. SPAIN METERING PUMP MARKET ANALYSIS BY REGIONAL FIGURE 44. REST OF EUROPE METERING PUMP MARKET ANALYSIS BY APPLICATION FIGURE 45. REST OF EUROPE METERING PUMP MARKET ANALYSIS BY TYPE FIGURE 46. REST OF EUROPE METERING PUMP MARKET ANALYSIS BY END USE INDUSTRY FIGURE 47. REST OF EUROPE METERING PUMP MARKET ANALYSIS BY PUMP CAPACITY FIGURE 48. REST OF EUROPE METERING PUMP MARKET ANALYSIS BY REGIONAL FIGURE 49. APAC METERING PUMP MARKET ANALYSIS FIGURE 50. CHINA METERING PUMP MARKET ANALYSIS BY APPLICATION FIGURE 51. CHINA METERING PUMP MARKET ANALYSIS BY TYPE FIGURE 52. CHINA METERING PUMP MARKET ANALYSIS BY END USE INDUSTRY FIGURE 53. CHINA METERING PUMP MARKET ANALYSIS BY PUMP CAPACITY FIGURE 54. CHINA METERING PUMP MARKET ANALYSIS BY REGIONAL FIGURE 55. INDIA METERING PUMP MARKET ANALYSIS BY APPLICATION FIGURE 56. INDIA METERING PUMP MARKET ANALYSIS BY TYPE FIGURE 57. INDIA METERING PUMP MARKET ANALYSIS BY END USE INDUSTRY FIGURE 58. INDIA METERING PUMP MARKET ANALYSIS BY PUMP CAPACITY FIGURE 59. INDIA METERING PUMP MARKET ANALYSIS BY REGIONAL FIGURE 60. JAPAN METERING PUMP MARKET ANALYSIS BY APPLICATION FIGURE 61. JAPAN METERING PUMP MARKET ANALYSIS BY TYPE FIGURE 62. JAPAN METERING PUMP MARKET ANALYSIS BY END USE INDUSTRY FIGURE 63. JAPAN METERING PUMP MARKET ANALYSIS BY PUMP CAPACITY FIGURE 64. JAPAN METERING PUMP MARKET ANALYSIS BY REGIONAL FIGURE 65. SOUTH KOREA METERING PUMP MARKET ANALYSIS BY APPLICATION FIGURE 66. SOUTH KOREA METERING PUMP MARKET ANALYSIS BY TYPE FIGURE 67. SOUTH KOREA METERING PUMP MARKET ANALYSIS BY END USE INDUSTRY FIGURE 68. SOUTH KOREA METERING PUMP MARKET ANALYSIS BY PUMP CAPACITY FIGURE 69. SOUTH KOREA METERING PUMP MARKET ANALYSIS BY REGIONAL FIGURE 70. MALAYSIA METERING PUMP MARKET ANALYSIS BY APPLICATION FIGURE 71. MALAYSIA METERING PUMP MARKET ANALYSIS BY TYPE FIGURE 72. MALAYSIA METERING PUMP MARKET ANALYSIS BY END USE INDUSTRY FIGURE 73. MALAYSIA METERING PUMP MARKET ANALYSIS BY PUMP CAPACITY FIGURE 74. MALAYSIA METERING PUMP MARKET ANALYSIS BY REGIONAL FIGURE 75. THAILAND METERING PUMP MARKET ANALYSIS BY APPLICATION FIGURE 76. THAILAND METERING PUMP MARKET ANALYSIS BY TYPE FIGURE 77. THAILAND METERING PUMP MARKET ANALYSIS BY END USE INDUSTRY FIGURE 78. THAILAND METERING PUMP MARKET ANALYSIS BY PUMP CAPACITY FIGURE 79. THAILAND METERING PUMP MARKET ANALYSIS BY REGIONAL FIGURE 80. INDONESIA METERING PUMP MARKET ANALYSIS BY APPLICATION FIGURE 81. INDONESIA METERING PUMP MARKET ANALYSIS BY TYPE FIGURE 82. INDONESIA METERING PUMP MARKET ANALYSIS BY END USE INDUSTRY FIGURE 83. INDONESIA METERING PUMP MARKET ANALYSIS BY PUMP CAPACITY FIGURE 84. INDONESIA METERING PUMP MARKET ANALYSIS BY REGIONAL FIGURE 85. REST OF APAC METERING PUMP MARKET ANALYSIS BY APPLICATION FIGURE 86. REST OF APAC METERING PUMP MARKET ANALYSIS BY TYPE FIGURE 87. REST OF APAC METERING PUMP MARKET ANALYSIS BY END USE INDUSTRY FIGURE 88. REST OF APAC METERING PUMP MARKET ANALYSIS BY PUMP CAPACITY FIGURE 89. REST OF APAC METERING PUMP MARKET ANALYSIS BY REGIONAL FIGURE 90. SOUTH AMERICA METERING PUMP MARKET ANALYSIS FIGURE 91. BRAZIL METERING PUMP MARKET ANALYSIS BY APPLICATION FIGURE 92. BRAZIL METERING PUMP MARKET ANALYSIS BY TYPE FIGURE 93. BRAZIL METERING PUMP MARKET ANALYSIS BY END USE INDUSTRY FIGURE 94. BRAZIL METERING PUMP MARKET ANALYSIS BY PUMP CAPACITY FIGURE 95. BRAZIL METERING PUMP MARKET ANALYSIS BY REGIONAL FIGURE 96. MEXICO METERING PUMP MARKET ANALYSIS BY APPLICATION FIGURE 97. MEXICO METERING PUMP MARKET ANALYSIS BY TYPE FIGURE 98. MEXICO METERING PUMP MARKET ANALYSIS BY END USE INDUSTRY FIGURE 99. MEXICO METERING PUMP MARKET ANALYSIS BY PUMP CAPACITY FIGURE 100. MEXICO METERING PUMP MARKET ANALYSIS BY REGIONAL FIGURE 101. ARGENTINA METERING PUMP MARKET ANALYSIS BY APPLICATION FIGURE 102. ARGENTINA METERING PUMP MARKET ANALYSIS BY TYPE FIGURE 103. ARGENTINA METERING PUMP MARKET ANALYSIS BY END USE INDUSTRY FIGURE 104. ARGENTINA METERING PUMP MARKET ANALYSIS BY PUMP CAPACITY FIGURE 105. ARGENTINA METERING PUMP MARKET ANALYSIS BY REGIONAL FIGURE 106. REST OF SOUTH AMERICA METERING PUMP MARKET ANALYSIS BY APPLICATION FIGURE 107. REST OF SOUTH AMERICA METERING PUMP MARKET ANALYSIS BY TYPE FIGURE 108. REST OF SOUTH AMERICA METERING PUMP MARKET ANALYSIS BY END USE INDUSTRY FIGURE 109. REST OF SOUTH AMERICA METERING PUMP MARKET ANALYSIS BY PUMP CAPACITY FIGURE 110. REST OF SOUTH AMERICA METERING PUMP MARKET ANALYSIS BY REGIONAL FIGURE 111. MEA METERING PUMP MARKET ANALYSIS FIGURE 112. GCC COUNTRIES METERING PUMP MARKET ANALYSIS BY APPLICATION FIGURE 113. GCC COUNTRIES METERING PUMP MARKET ANALYSIS BY TYPE FIGURE 114. GCC COUNTRIES METERING PUMP MARKET ANALYSIS BY END USE INDUSTRY FIGURE 115. GCC COUNTRIES METERING PUMP MARKET ANALYSIS BY PUMP CAPACITY FIGURE 116. GCC COUNTRIES METERING PUMP MARKET ANALYSIS BY REGIONAL FIGURE 117. SOUTH AFRICA METERING PUMP MARKET ANALYSIS BY APPLICATION FIGURE 118. SOUTH AFRICA METERING PUMP MARKET ANALYSIS BY TYPE FIGURE 119. SOUTH AFRICA METERING PUMP MARKET ANALYSIS BY END USE INDUSTRY FIGURE 120. SOUTH AFRICA METERING PUMP MARKET ANALYSIS BY PUMP CAPACITY FIGURE 121. SOUTH AFRICA METERING PUMP MARKET ANALYSIS BY REGIONAL FIGURE 122. REST OF MEA METERING PUMP MARKET ANALYSIS BY APPLICATION FIGURE 123. REST OF MEA METERING PUMP MARKET ANALYSIS BY TYPE FIGURE 124. REST OF MEA METERING PUMP MARKET ANALYSIS BY END USE INDUSTRY FIGURE 125. REST OF MEA METERING PUMP MARKET ANALYSIS BY PUMP CAPACITY FIGURE 126. REST OF MEA METERING PUMP MARKET ANALYSIS BY REGIONAL FIGURE 127. KEY BUYING CRITERIA OF METERING PUMP MARKET FIGURE 128. RESEARCH PROCESS OF MRFR FIGURE 129. DRO ANALYSIS OF METERING PUMP MARKET FIGURE 130. DRIVERS IMPACT ANALYSIS: METERING PUMP MARKET FIGURE 131. RESTRAINTS IMPACT ANALYSIS: METERING PUMP MARKET FIGURE 132. SUPPLY / VALUE CHAIN: METERING PUMP MARKET FIGURE 133. METERING PUMP MARKET, BY APPLICATION, 2024 (% SHARE) FIGURE 134. METERING PUMP MARKET, BY APPLICATION, 2019 TO 2032 (USD Billions) FIGURE 135. METERING PUMP MARKET, BY TYPE, 2024 (% SHARE) FIGURE 136. METERING PUMP MARKET, BY TYPE, 2019 TO 2032 (USD Billions) FIGURE 137. METERING PUMP MARKET, BY END USE INDUSTRY, 2024 (% SHARE) FIGURE 138. METERING PUMP MARKET, BY END USE INDUSTRY, 2019 TO 2032 (USD Billions) FIGURE 139. METERING PUMP MARKET, BY PUMP CAPACITY, 2024 (% SHARE) FIGURE 140. METERING PUMP MARKET, BY PUMP CAPACITY, 2019 TO 2032 (USD Billions) FIGURE 141. METERING PUMP MARKET, BY REGIONAL, 2024 (% SHARE) FIGURE 142. METERING PUMP MARKET, BY REGIONAL, 2019 TO 2032 (USD Billions) FIGURE 143. BENCHMARKING OF MAJOR COMPETITORS
    495. Table FIGURE 1. MARKET SYNOPSIS FIGURE 2. NORTH AMERICA METERING PUMP MARKET ANALYSIS FIGURE 3. US METERING PUMP MARKET ANALYSIS BY APPLICATION FIGURE 4. US METERING PUMP MARKET ANALYSIS BY TYPE FIGURE 5. US METERING PUMP MARKET ANALYSIS BY END USE INDUSTRY FIGURE 6. US METERING PUMP MARKET ANALYSIS BY PUMP CAPACITY FIGURE 7. US METERING PUMP MARKET ANALYSIS BY REGIONAL FIGURE 8. CANADA METERING PUMP MARKET ANALYSIS BY APPLICATION FIGURE 9. CANADA METERING PUMP MARKET ANALYSIS BY TYPE FIGURE 10. CANADA METERING PUMP MARKET ANALYSIS BY END USE INDUSTRY FIGURE 11. CANADA METERING PUMP MARKET ANALYSIS BY PUMP CAPACITY FIGURE 12. CANADA METERING PUMP MARKET ANALYSIS BY REGIONAL FIGURE 13. EUROPE METERING PUMP MARKET ANALYSIS FIGURE 14. GERMANY METERING PUMP MARKET ANALYSIS BY APPLICATION FIGURE 15. GERMANY METERING PUMP MARKET ANALYSIS BY TYPE FIGURE 16. GERMANY METERING PUMP MARKET ANALYSIS BY END USE INDUSTRY FIGURE 17. GERMANY METERING PUMP MARKET ANALYSIS BY PUMP CAPACITY FIGURE 18. GERMANY METERING PUMP MARKET ANALYSIS BY REGIONAL FIGURE 19. UK METERING PUMP MARKET ANALYSIS BY APPLICATION FIGURE 20. UK METERING PUMP MARKET ANALYSIS BY TYPE FIGURE 21. UK METERING PUMP MARKET ANALYSIS BY END USE INDUSTRY FIGURE 22. UK METERING PUMP MARKET ANALYSIS BY PUMP CAPACITY FIGURE 23. UK METERING PUMP MARKET ANALYSIS BY REGIONAL FIGURE 24. FRANCE METERING PUMP MARKET ANALYSIS BY APPLICATION FIGURE 25. FRANCE METERING PUMP MARKET ANALYSIS BY TYPE FIGURE 26. FRANCE METERING PUMP MARKET ANALYSIS BY END USE INDUSTRY FIGURE 27. FRANCE METERING PUMP MARKET ANALYSIS BY PUMP CAPACITY FIGURE 28. FRANCE METERING PUMP MARKET ANALYSIS BY REGIONAL FIGURE 29. RUSSIA METERING PUMP MARKET ANALYSIS BY APPLICATION FIGURE 30. RUSSIA METERING PUMP MARKET ANALYSIS BY TYPE FIGURE 31. RUSSIA METERING PUMP MARKET ANALYSIS BY END USE INDUSTRY FIGURE 32. RUSSIA METERING PUMP MARKET ANALYSIS BY PUMP CAPACITY FIGURE 33. RUSSIA METERING PUMP MARKET ANALYSIS BY REGIONAL FIGURE 34. ITALY METERING PUMP MARKET ANALYSIS BY APPLICATION FIGURE 35. ITALY METERING PUMP MARKET ANALYSIS BY TYPE FIGURE 36. ITALY METERING PUMP MARKET ANALYSIS BY END USE INDUSTRY FIGURE 37. ITALY METERING PUMP MARKET ANALYSIS BY PUMP CAPACITY FIGURE 38. ITALY METERING PUMP MARKET ANALYSIS BY REGIONAL FIGURE 39. SPAIN METERING PUMP MARKET ANALYSIS BY APPLICATION FIGURE 40. SPAIN METERING PUMP MARKET ANALYSIS BY TYPE FIGURE 41. SPAIN METERING PUMP MARKET ANALYSIS BY END USE INDUSTRY FIGURE 42. SPAIN METERING PUMP MARKET ANALYSIS BY PUMP CAPACITY FIGURE 43. SPAIN METERING PUMP MARKET ANALYSIS BY REGIONAL FIGURE 44. REST OF EUROPE METERING PUMP MARKET ANALYSIS BY APPLICATION FIGURE 45. REST OF EUROPE METERING PUMP MARKET ANALYSIS BY TYPE FIGURE 46. REST OF EUROPE METERING PUMP MARKET ANALYSIS BY END USE INDUSTRY FIGURE 47. REST OF EUROPE METERING PUMP MARKET ANALYSIS BY PUMP CAPACITY FIGURE 48. REST OF EUROPE METERING PUMP MARKET ANALYSIS BY REGIONAL FIGURE 49. APAC METERING PUMP MARKET ANALYSIS FIGURE 50. CHINA METERING PUMP MARKET ANALYSIS BY APPLICATION FIGURE 51. CHINA METERING PUMP MARKET ANALYSIS BY TYPE FIGURE 52. CHINA METERING PUMP MARKET ANALYSIS BY END USE INDUSTRY FIGURE 53. CHINA METERING PUMP MARKET ANALYSIS BY PUMP CAPACITY FIGURE 54. CHINA METERING PUMP MARKET ANALYSIS BY REGIONAL FIGURE 55. INDIA METERING PUMP MARKET ANALYSIS BY APPLICATION FIGURE 56. INDIA METERING PUMP MARKET ANALYSIS BY TYPE FIGURE 57. INDIA METERING PUMP MARKET ANALYSIS BY END USE INDUSTRY FIGURE 58. INDIA METERING PUMP MARKET ANALYSIS BY PUMP CAPACITY FIGURE 59. INDIA METERING PUMP MARKET ANALYSIS BY REGIONAL FIGURE 60. JAPAN METERING PUMP MARKET ANALYSIS BY APPLICATION FIGURE 61. JAPAN METERING PUMP MARKET ANALYSIS BY TYPE FIGURE 62. JAPAN METERING PUMP MARKET ANALYSIS BY END USE INDUSTRY FIGURE 63. JAPAN METERING PUMP MARKET ANALYSIS BY PUMP CAPACITY FIGURE 64. JAPAN METERING PUMP MARKET ANALYSIS BY REGIONAL FIGURE 65. SOUTH KOREA METERING PUMP MARKET ANALYSIS BY APPLICATION FIGURE 66. SOUTH KOREA METERING PUMP MARKET ANALYSIS BY TYPE FIGURE 67. SOUTH KOREA METERING PUMP MARKET ANALYSIS BY END USE INDUSTRY FIGURE 68. SOUTH KOREA METERING PUMP MARKET ANALYSIS BY PUMP CAPACITY FIGURE 69. SOUTH KOREA METERING PUMP MARKET ANALYSIS BY REGIONAL FIGURE 70. MALAYSIA METERING PUMP MARKET ANALYSIS BY APPLICATION FIGURE 71. MALAYSIA METERING PUMP MARKET ANALYSIS BY TYPE FIGURE 72. MALAYSIA METERING PUMP MARKET ANALYSIS BY END USE INDUSTRY FIGURE 73. MALAYSIA METERING PUMP MARKET ANALYSIS BY PUMP CAPACITY FIGURE 74. MALAYSIA METERING PUMP MARKET ANALYSIS BY REGIONAL FIGURE 75. THAILAND METERING PUMP MARKET ANALYSIS BY APPLICATION FIGURE 76. THAILAND METERING PUMP MARKET ANALYSIS BY TYPE FIGURE 77. THAILAND METERING PUMP MARKET ANALYSIS BY END USE INDUSTRY FIGURE 78. THAILAND METERING PUMP MARKET ANALYSIS BY PUMP CAPACITY FIGURE 79. THAILAND METERING PUMP MARKET ANALYSIS BY REGIONAL FIGURE 80. INDONESIA METERING PUMP MARKET ANALYSIS BY APPLICATION FIGURE 81. INDONESIA METERING PUMP MARKET ANALYSIS BY TYPE FIGURE 82. INDONESIA METERING PUMP MARKET ANALYSIS BY END USE INDUSTRY FIGURE 83. INDONESIA METERING PUMP MARKET ANALYSIS BY PUMP CAPACITY FIGURE 84. INDONESIA METERING PUMP MARKET ANALYSIS BY REGIONAL FIGURE 85. REST OF APAC METERING PUMP MARKET ANALYSIS BY APPLICATION FIGURE 86. REST OF APAC METERING PUMP MARKET ANALYSIS BY TYPE FIGURE 87. REST OF APAC METERING PUMP MARKET ANALYSIS BY END USE INDUSTRY FIGURE 88. REST OF APAC METERING PUMP MARKET ANALYSIS BY PUMP CAPACITY FIGURE 89. REST OF APAC METERING PUMP MARKET ANALYSIS BY REGIONAL FIGURE 90. SOUTH AMERICA METERING PUMP MARKET ANALYSIS FIGURE 91. BRAZIL METERING PUMP MARKET ANALYSIS BY APPLICATION FIGURE 92. BRAZIL METERING PUMP MARKET ANALYSIS BY TYPE FIGURE 93. BRAZIL METERING PUMP MARKET ANALYSIS BY END USE INDUSTRY FIGURE 94. BRAZIL METERING PUMP MARKET ANALYSIS BY PUMP CAPACITY FIGURE 95. BRAZIL METERING PUMP MARKET ANALYSIS BY REGIONAL FIGURE 96. MEXICO METERING PUMP MARKET ANALYSIS BY APPLICATION FIGURE 97. MEXICO METERING PUMP MARKET ANALYSIS BY TYPE FIGURE 98. MEXICO METERING PUMP MARKET ANALYSIS BY END USE INDUSTRY FIGURE 99. MEXICO METERING PUMP MARKET ANALYSIS BY PUMP CAPACITY FIGURE 100. MEXICO METERING PUMP MARKET ANALYSIS BY REGIONAL FIGURE 101. ARGENTINA METERING PUMP MARKET ANALYSIS BY APPLICATION FIGURE 102. ARGENTINA METERING PUMP MARKET ANALYSIS BY TYPE FIGURE 103. ARGENTINA METERING PUMP MARKET ANALYSIS BY END USE INDUSTRY FIGURE 104. ARGENTINA METERING PUMP MARKET ANALYSIS BY PUMP CAPACITY FIGURE 105. ARGENTINA METERING PUMP MARKET ANALYSIS BY REGIONAL FIGURE 106. REST OF SOUTH AMERICA METERING PUMP MARKET ANALYSIS BY APPLICATION FIGURE 107. REST OF SOUTH AMERICA METERING PUMP MARKET ANALYSIS BY TYPE FIGURE 108. REST OF SOUTH AMERICA METERING PUMP MARKET ANALYSIS BY END USE INDUSTRY FIGURE 109. REST OF SOUTH AMERICA METERING PUMP MARKET ANALYSIS BY PUMP CAPACITY FIGURE 110. REST OF SOUTH AMERICA METERING PUMP MARKET ANALYSIS BY REGIONAL FIGURE 111. MEA METERING PUMP MARKET ANALYSIS FIGURE 112. GCC COUNTRIES METERING PUMP MARKET ANALYSIS BY APPLICATION FIGURE 113. GCC COUNTRIES METERING PUMP MARKET ANALYSIS BY TYPE FIGURE 114. GCC COUNTRIES METERING PUMP MARKET ANALYSIS BY END USE INDUSTRY FIGURE 115. GCC COUNTRIES METERING PUMP MARKET ANALYSIS BY PUMP CAPACITY FIGURE 116. GCC COUNTRIES METERING PUMP MARKET ANALYSIS BY REGIONAL FIGURE 117. SOUTH AFRICA METERING PUMP MARKET ANALYSIS BY APPLICATION FIGURE 118. SOUTH AFRICA METERING PUMP MARKET ANALYSIS BY TYPE FIGURE 119. SOUTH AFRICA METERING PUMP MARKET ANALYSIS BY END USE INDUSTRY FIGURE 120. SOUTH AFRICA METERING PUMP MARKET ANALYSIS BY PUMP CAPACITY FIGURE 121. SOUTH AFRICA METERING PUMP MARKET ANALYSIS BY REGIONAL FIGURE 122. REST OF MEA METERING PUMP MARKET ANALYSIS BY APPLICATION FIGURE 123. REST OF MEA METERING PUMP MARKET ANALYSIS BY TYPE FIGURE 124. REST OF MEA METERING PUMP MARKET ANALYSIS BY END USE INDUSTRY FIGURE 125. REST OF MEA METERING PUMP MARKET ANALYSIS BY PUMP CAPACITY FIGURE 126. REST OF MEA METERING PUMP MARKET ANALYSIS BY REGIONAL FIGURE 127. KEY BUYING CRITERIA OF METERING PUMP MARKET FIGURE 128. RESEARCH PROCESS OF MRFR FIGURE 129. DRO ANALYSIS OF METERING PUMP MARKET FIGURE 130. DRIVERS IMPACT ANALYSIS: METERING PUMP MARKET FIGURE 131. RESTRAINTS IMPACT ANALYSIS: METERING PUMP MARKET FIGURE 132. SUPPLY / VALUE CHAIN: METERING PUMP MARKET FIGURE 133. METERING PUMP MARKET, BY APPLICATION, 2024 (% SHARE) FIGURE 134. METERING PUMP MARKET, BY APPLICATION, 2019 TO 2032 (USD Billions) FIGURE 135. METERING PUMP MARKET, BY TYPE, 2024 (% SHARE) FIGURE 136. METERING PUMP MARKET, BY TYPE, 2019 TO 2032 (USD Billions) FIGURE 137. METERING PUMP MARKET, BY END USE INDUSTRY, 2024 (% SHARE) FIGURE 138. METERING PUMP MARKET, BY END USE INDUSTRY, 2019 TO 2032 (USD Billions) FIGURE 139. METERING PUMP MARKET, BY PUMP CAPACITY, 2024 (% SHARE) FIGURE 140. METERING PUMP MARKET, BY PUMP CAPACITY, 2019 TO 2032 (USD Billions) FIGURE 141. METERING PUMP MARKET, BY REGIONAL, 2024 (% SHARE) FIGURE 142. METERING PUMP MARKET, BY REGIONAL, 2019 TO 2032 (USD Billions) FIGURE 143. BENCHMARKING OF MAJOR COMPETITORS

    Metering Pump Market Segmentation

    Metering Pump Market By Application (USD Billion, 2019-2032)

    Water Treatment

    Chemicals Processing

    Food and Beverage

    Pharmaceuticals

    Oil and Gas

    Metering Pump Market By Type (USD Billion, 2019-2032)

    Diaphragm Pumps

    Peristaltic Pumps

    Gear Pumps

    Piston Pumps

    Metering Pump Market By End Use Industry (USD Billion, 2019-2032)

    Chemical Industry

    Water and Wastewater Management

    Pharmaceutical Industry

    Food and Beverage Industry

    Metering Pump Market By Pump Capacity (USD Billion, 2019-2032)

    Less than 5 LPH

    5 to 20 LPH

    20 to 100 LPH

    More than 100 LPH

    Metering Pump Market By Regional (USD Billion, 2019-2032)

    North America

    Europe

    South America

    Asia Pacific

    Middle East and Africa

    Metering Pump Market Regional Outlook (USD Billion, 2019-2032)

    North America Outlook (USD Billion, 2019-2032)

    North America Metering Pump Market by Application Type

    Water Treatment

    Chemicals Processing

    Food and Beverage

    Pharmaceuticals

    Oil and Gas

    North America Metering Pump Market by Type

    Diaphragm Pumps

    Peristaltic Pumps

    Gear Pumps

    Piston Pumps

    North America Metering Pump Market by End Use Industry Type

    Chemical Industry

    Water and Wastewater Management

    Pharmaceutical Industry

    Food and Beverage Industry

    North America Metering Pump Market by Pump Capacity Type

    Less than 5 LPH

    5 to 20 LPH

    20 to 100 LPH

    More than 100 LPH

    North America Metering Pump Market by Regional Type

    US

    Canada

    US Outlook (USD Billion, 2019-2032)

    US Metering Pump Market by Application Type

    Water Treatment

    Chemicals Processing

    Food and Beverage

    Pharmaceuticals

    Oil and Gas

    US Metering Pump Market by Type

    Diaphragm Pumps

    Peristaltic Pumps

    Gear Pumps

    Piston Pumps

    US Metering Pump Market by End Use Industry Type

    Chemical Industry

    Water and Wastewater Management

    Pharmaceutical Industry

    Food and Beverage Industry

    US Metering Pump Market by Pump Capacity Type

    Less than 5 LPH

    5 to 20 LPH

    20 to 100 LPH

    More than 100 LPH

    CANADA Outlook (USD Billion, 2019-2032)

    CANADA Metering Pump Market by Application Type

    Water Treatment

    Chemicals Processing

    Food and Beverage

    Pharmaceuticals

    Oil and Gas

    CANADA Metering Pump Market by Type

    Diaphragm Pumps

    Peristaltic Pumps

    Gear Pumps

    Piston Pumps

    CANADA Metering Pump Market by End Use Industry Type

    Chemical Industry

    Water and Wastewater Management

    Pharmaceutical Industry

    Food and Beverage Industry

    CANADA Metering Pump Market by Pump Capacity Type

    Less than 5 LPH

    5 to 20 LPH

    20 to 100 LPH

    More than 100 LPH
    Europe Outlook (USD Billion, 2019-2032)

    Europe Metering Pump Market by Application Type

    Water Treatment

    Chemicals Processing

    Food and Beverage

    Pharmaceuticals

    Oil and Gas

    Europe Metering Pump Market by Type

    Diaphragm Pumps

    Peristaltic Pumps

    Gear Pumps

    Piston Pumps

    Europe Metering Pump Market by End Use Industry Type

    Chemical Industry

    Water and Wastewater Management

    Pharmaceutical Industry

    Food and Beverage Industry

    Europe Metering Pump Market by Pump Capacity Type

    Less than 5 LPH

    5 to 20 LPH

    20 to 100 LPH

    More than 100 LPH

    Europe Metering Pump Market by Regional Type

    Germany

    UK

    France

    Russia

    Italy

    Spain

    Rest of Europe

    GERMANY Outlook (USD Billion, 2019-2032)

    GERMANY Metering Pump Market by Application Type

    Water Treatment

    Chemicals Processing

    Food and Beverage

    Pharmaceuticals

    Oil and Gas

    GERMANY Metering Pump Market by Type

    Diaphragm Pumps

    Peristaltic Pumps

    Gear Pumps

    Piston Pumps

    GERMANY Metering Pump Market by End Use Industry Type

    Chemical Industry

    Water and Wastewater Management

    Pharmaceutical Industry

    Food and Beverage Industry

    GERMANY Metering Pump Market by Pump Capacity Type

    Less than 5 LPH

    5 to 20 LPH

    20 to 100 LPH

    More than 100 LPH

    UK Outlook (USD Billion, 2019-2032)

    UK Metering Pump Market by Application Type

    Water Treatment

    Chemicals Processing

    Food and Beverage

    Pharmaceuticals

    Oil and Gas

    UK Metering Pump Market by Type

    Diaphragm Pumps

    Peristaltic Pumps

    Gear Pumps

    Piston Pumps

    UK Metering Pump Market by End Use Industry Type

    Chemical Industry

    Water and Wastewater Management

    Pharmaceutical Industry

    Food and Beverage Industry

    UK Metering Pump Market by Pump Capacity Type

    Less than 5 LPH

    5 to 20 LPH

    20 to 100 LPH

    More than 100 LPH

    FRANCE Outlook (USD Billion, 2019-2032)

    FRANCE Metering Pump Market by Application Type

    Water Treatment

    Chemicals Processing

    Food and Beverage

    Pharmaceuticals

    Oil and Gas

    FRANCE Metering Pump Market by Type

    Diaphragm Pumps

    Peristaltic Pumps

    Gear Pumps

    Piston Pumps

    FRANCE Metering Pump Market by End Use Industry Type

    Chemical Industry

    Water and Wastewater Management

    Pharmaceutical Industry

    Food and Beverage Industry

    FRANCE Metering Pump Market by Pump Capacity Type

    Less than 5 LPH

    5 to 20 LPH

    20 to 100 LPH

    More than 100 LPH

    RUSSIA Outlook (USD Billion, 2019-2032)

    RUSSIA Metering Pump Market by Application Type

    Water Treatment

    Chemicals Processing

    Food and Beverage

    Pharmaceuticals

    Oil and Gas

    RUSSIA Metering Pump Market by Type

    Diaphragm Pumps

    Peristaltic Pumps

    Gear Pumps

    Piston Pumps

    RUSSIA Metering Pump Market by End Use Industry Type

    Chemical Industry

    Water and Wastewater Management

    Pharmaceutical Industry

    Food and Beverage Industry

    RUSSIA Metering Pump Market by Pump Capacity Type

    Less than 5 LPH

    5 to 20 LPH

    20 to 100 LPH

    More than 100 LPH

    ITALY Outlook (USD Billion, 2019-2032)

    ITALY Metering Pump Market by Application Type

    Water Treatment

    Chemicals Processing

    Food and Beverage

    Pharmaceuticals

    Oil and Gas

    ITALY Metering Pump Market by Type

    Diaphragm Pumps

    Peristaltic Pumps

    Gear Pumps

    Piston Pumps

    ITALY Metering Pump Market by End Use Industry Type

    Chemical Industry

    Water and Wastewater Management

    Pharmaceutical Industry

    Food and Beverage Industry

    ITALY Metering Pump Market by Pump Capacity Type

    Less than 5 LPH

    5 to 20 LPH

    20 to 100 LPH

    More than 100 LPH

    SPAIN Outlook (USD Billion, 2019-2032)

    SPAIN Metering Pump Market by Application Type

    Water Treatment

    Chemicals Processing

    Food and Beverage

    Pharmaceuticals

    Oil and Gas

    SPAIN Metering Pump Market by Type

    Diaphragm Pumps

    Peristaltic Pumps

    Gear Pumps

    Piston Pumps

    SPAIN Metering Pump Market by End Use Industry Type

    Chemical Industry

    Water and Wastewater Management

    Pharmaceutical Industry

    Food and Beverage Industry

    SPAIN Metering Pump Market by Pump Capacity Type

    Less than 5 LPH

    5 to 20 LPH

    20 to 100 LPH

    More than 100 LPH

    REST OF EUROPE Outlook (USD Billion, 2019-2032)

    REST OF EUROPE Metering Pump Market by Application Type

    Water Treatment

    Chemicals Processing

    Food and Beverage

    Pharmaceuticals

    Oil and Gas

    REST OF EUROPE Metering Pump Market by Type

    Diaphragm Pumps

    Peristaltic Pumps

    Gear Pumps

    Piston Pumps

    REST OF EUROPE Metering Pump Market by End Use Industry Type

    Chemical Industry

    Water and Wastewater Management

    Pharmaceutical Industry

    Food and Beverage Industry

    REST OF EUROPE Metering Pump Market by Pump Capacity Type

    Less than 5 LPH

    5 to 20 LPH

    20 to 100 LPH

    More than 100 LPH

    APAC Outlook (USD Billion, 2019-2032)

    APAC Metering Pump Market by Application Type

    Water Treatment

    Chemicals Processing

    Food and Beverage

    Pharmaceuticals

    Oil and Gas

    APAC Metering Pump Market by Type

    Diaphragm Pumps

    Peristaltic Pumps

    Gear Pumps

    Piston Pumps

    APAC Metering Pump Market by End Use Industry Type

    Chemical Industry

    Water and Wastewater Management

    Pharmaceutical Industry

    Food and Beverage Industry

    APAC Metering Pump Market by Pump Capacity Type

    Less than 5 LPH

    5 to 20 LPH

    20 to 100 LPH

    More than 100 LPH

    APAC Metering Pump Market by Regional Type

    China

    India

    Japan

    South Korea

    Malaysia

    Thailand

    Indonesia

    Rest of APAC

    CHINA Outlook (USD Billion, 2019-2032)

    CHINA Metering Pump Market by Application Type

    Water Treatment

    Chemicals Processing

    Food and Beverage

    Pharmaceuticals

    Oil and Gas

    CHINA Metering Pump Market by Type

    Diaphragm Pumps

    Peristaltic Pumps

    Gear Pumps

    Piston Pumps

    CHINA Metering Pump Market by End Use Industry Type

    Chemical Industry

    Water and Wastewater Management

    Pharmaceutical Industry

    Food and Beverage Industry

    CHINA Metering Pump Market by Pump Capacity Type

    Less than 5 LPH

    5 to 20 LPH

    20 to 100 LPH

    More than 100 LPH

    INDIA Outlook (USD Billion, 2019-2032)

    INDIA Metering Pump Market by Application Type

    Water Treatment

    Chemicals Processing

    Food and Beverage

    Pharmaceuticals

    Oil and Gas

    INDIA Metering Pump Market by Type

    Diaphragm Pumps

    Peristaltic Pumps

    Gear Pumps

    Piston Pumps

    INDIA Metering Pump Market by End Use Industry Type

    Chemical Industry

    Water and Wastewater Management

    Pharmaceutical Industry

    Food and Beverage Industry

    INDIA Metering Pump Market by Pump Capacity Type

    Less than 5 LPH

    5 to 20 LPH

    20 to 100 LPH

    More than 100 LPH

    JAPAN Outlook (USD Billion, 2019-2032)

    JAPAN Metering Pump Market by Application Type

    Water Treatment

    Chemicals Processing

    Food and Beverage

    Pharmaceuticals

    Oil and Gas

    JAPAN Metering Pump Market by Type

    Diaphragm Pumps

    Peristaltic Pumps

    Gear Pumps

    Piston Pumps

    JAPAN Metering Pump Market by End Use Industry Type

    Chemical Industry

    Water and Wastewater Management

    Pharmaceutical Industry

    Food and Beverage Industry

    JAPAN Metering Pump Market by Pump Capacity Type

    Less than 5 LPH

    5 to 20 LPH

    20 to 100 LPH

    More than 100 LPH

    SOUTH KOREA Outlook (USD Billion, 2019-2032)

    SOUTH KOREA Metering Pump Market by Application Type

    Water Treatment

    Chemicals Processing

    Food and Beverage

    Pharmaceuticals

    Oil and Gas

    SOUTH KOREA Metering Pump Market by Type

    Diaphragm Pumps

    Peristaltic Pumps

    Gear Pumps

    Piston Pumps

    SOUTH KOREA Metering Pump Market by End Use Industry Type

    Chemical Industry

    Water and Wastewater Management

    Pharmaceutical Industry

    Food and Beverage Industry

    SOUTH KOREA Metering Pump Market by Pump Capacity Type

    Less than 5 LPH

    5 to 20 LPH

    20 to 100 LPH

    More than 100 LPH

    MALAYSIA Outlook (USD Billion, 2019-2032)

    MALAYSIA Metering Pump Market by Application Type

    Water Treatment

    Chemicals Processing

    Food and Beverage

    Pharmaceuticals

    Oil and Gas

    MALAYSIA Metering Pump Market by Type

    Diaphragm Pumps

    Peristaltic Pumps

    Gear Pumps

    Piston Pumps

    MALAYSIA Metering Pump Market by End Use Industry Type

    Chemical Industry

    Water and Wastewater Management

    Pharmaceutical Industry

    Food and Beverage Industry

    MALAYSIA Metering Pump Market by Pump Capacity Type

    Less than 5 LPH

    5 to 20 LPH

    20 to 100 LPH

    More than 100 LPH

    THAILAND Outlook (USD Billion, 2019-2032)

    THAILAND Metering Pump Market by Application Type

    Water Treatment

    Chemicals Processing

    Food and Beverage

    Pharmaceuticals

    Oil and Gas

    THAILAND Metering Pump Market by Type

    Diaphragm Pumps

    Peristaltic Pumps

    Gear Pumps

    Piston Pumps

    THAILAND Metering Pump Market by End Use Industry Type

    Chemical Industry

    Water and Wastewater Management

    Pharmaceutical Industry

    Food and Beverage Industry

    THAILAND Metering Pump Market by Pump Capacity Type

    Less than 5 LPH

    5 to 20 LPH

    20 to 100 LPH

    More than 100 LPH

    INDONESIA Outlook (USD Billion, 2019-2032)

    INDONESIA Metering Pump Market by Application Type

    Water Treatment

    Chemicals Processing

    Food and Beverage

    Pharmaceuticals

    Oil and Gas

    INDONESIA Metering Pump Market by Type

    Diaphragm Pumps

    Peristaltic Pumps

    Gear Pumps

    Piston Pumps

    INDONESIA Metering Pump Market by End Use Industry Type

    Chemical Industry

    Water and Wastewater Management

    Pharmaceutical Industry

    Food and Beverage Industry

    INDONESIA Metering Pump Market by Pump Capacity Type

    Less than 5 LPH

    5 to 20 LPH

    20 to 100 LPH

    More than 100 LPH

    REST OF APAC Outlook (USD Billion, 2019-2032)

    REST OF APAC Metering Pump Market by Application Type

    Water Treatment

    Chemicals Processing

    Food and Beverage

    Pharmaceuticals

    Oil and Gas

    REST OF APAC Metering Pump Market by Type

    Diaphragm Pumps

    Peristaltic Pumps

    Gear Pumps

    Piston Pumps

    REST OF APAC Metering Pump Market by End Use Industry Type

    Chemical Industry

    Water and Wastewater Management

    Pharmaceutical Industry

    Food and Beverage Industry

    REST OF APAC Metering Pump Market by Pump Capacity Type

    Less than 5 LPH

    5 to 20 LPH

    20 to 100 LPH

    More than 100 LPH

    South America Outlook (USD Billion, 2019-2032)

    South America Metering Pump Market by Application Type

    Water Treatment

    Chemicals Processing

    Food and Beverage

    Pharmaceuticals

    Oil and Gas

    South America Metering Pump Market by Type

    Diaphragm Pumps

    Peristaltic Pumps

    Gear Pumps

    Piston Pumps

    South America Metering Pump Market by End Use Industry Type

    Chemical Industry

    Water and Wastewater Management

    Pharmaceutical Industry

    Food and Beverage Industry

    South America Metering Pump Market by Pump Capacity Type

    Less than 5 LPH

    5 to 20 LPH

    20 to 100 LPH

    More than 100 LPH

    South America Metering Pump Market by Regional Type

    Brazil

    Mexico

    Argentina

    Rest of South America

    BRAZIL Outlook (USD Billion, 2019-2032)

    BRAZIL Metering Pump Market by Application Type

    Water Treatment

    Chemicals Processing

    Food and Beverage

    Pharmaceuticals

    Oil and Gas

    BRAZIL Metering Pump Market by Type

    Diaphragm Pumps

    Peristaltic Pumps

    Gear Pumps

    Piston Pumps

    BRAZIL Metering Pump Market by End Use Industry Type

    Chemical Industry

    Water and Wastewater Management

    Pharmaceutical Industry

    Food and Beverage Industry

    BRAZIL Metering Pump Market by Pump Capacity Type

    Less than 5 LPH

    5 to 20 LPH

    20 to 100 LPH

    More than 100 LPH

    MEXICO Outlook (USD Billion, 2019-2032)

    MEXICO Metering Pump Market by Application Type

    Water Treatment

    Chemicals Processing

    Food and Beverage

    Pharmaceuticals

    Oil and Gas

    MEXICO Metering Pump Market by Type

    Diaphragm Pumps

    Peristaltic Pumps

    Gear Pumps

    Piston Pumps

    MEXICO Metering Pump Market by End Use Industry Type

    Chemical Industry

    Water and Wastewater Management

    Pharmaceutical Industry

    Food and Beverage Industry

    MEXICO Metering Pump Market by Pump Capacity Type

    Less than 5 LPH

    5 to 20 LPH

    20 to 100 LPH

    More than 100 LPH

    ARGENTINA Outlook (USD Billion, 2019-2032)

    ARGENTINA Metering Pump Market by Application Type

    Water Treatment

    Chemicals Processing

    Food and Beverage

    Pharmaceuticals

    Oil and Gas

    ARGENTINA Metering Pump Market by Type

    Diaphragm Pumps

    Peristaltic Pumps

    Gear Pumps

    Piston Pumps

    ARGENTINA Metering Pump Market by End Use Industry Type

    Chemical Industry

    Water and Wastewater Management

    Pharmaceutical Industry

    Food and Beverage Industry

    ARGENTINA Metering Pump Market by Pump Capacity Type

    Less than 5 LPH

    5 to 20 LPH

    20 to 100 LPH

    More than 100 LPH

    REST OF SOUTH AMERICA Outlook (USD Billion, 2019-2032)

    REST OF SOUTH AMERICA Metering Pump Market by Application Type

    Water Treatment

    Chemicals Processing

    Food and Beverage

    Pharmaceuticals

    Oil and Gas

    REST OF SOUTH AMERICA Metering Pump Market by Type

    Diaphragm Pumps

    Peristaltic Pumps

    Gear Pumps

    Piston Pumps

    REST OF SOUTH AMERICA Metering Pump Market by End Use Industry Type

    Chemical Industry

    Water and Wastewater Management

    Pharmaceutical Industry

    Food and Beverage Industry

    REST OF SOUTH AMERICA Metering Pump Market by Pump Capacity Type

    Less than 5 LPH

    5 to 20 LPH

    20 to 100 LPH

    More than 100 LPH

    MEA Outlook (USD Billion, 2019-2032)

    MEA Metering Pump Market by Application Type

    Water Treatment

    Chemicals Processing

    Food and Beverage

    Pharmaceuticals

    Oil and Gas

    MEA Metering Pump Market by Type

    Diaphragm Pumps

    Peristaltic Pumps

    Gear Pumps

    Piston Pumps

    MEA Metering Pump Market by End Use Industry Type

    Chemical Industry

    Water and Wastewater Management

    Pharmaceutical Industry

    Food and Beverage Industry

    MEA Metering Pump Market by Pump Capacity Type

    Less than 5 LPH

    5 to 20 LPH

    20 to 100 LPH

    More than 100 LPH

    MEA Metering Pump Market by Regional Type

    GCC Countries

    South Africa

    Rest of MEA

    GCC COUNTRIES Outlook (USD Billion, 2019-2032)

    GCC COUNTRIES Metering Pump Market by Application Type

    Water Treatment

    Chemicals Processing

    Food and Beverage

    Pharmaceuticals

    Oil and Gas

    GCC COUNTRIES Metering Pump Market by Type

    Diaphragm Pumps

    Peristaltic Pumps

    Gear Pumps

    Piston Pumps

    GCC COUNTRIES Metering Pump Market by End Use Industry Type

    Chemical Industry

    Water and Wastewater Management

    Pharmaceutical Industry

    Food and Beverage Industry

    GCC COUNTRIES Metering Pump Market by Pump Capacity Type

    Less than 5 LPH

    5 to 20 LPH

    20 to 100 LPH

    More than 100 LPH

    SOUTH AFRICA Outlook (USD Billion, 2019-2032)

    SOUTH AFRICA Metering Pump Market by Application Type

    Water Treatment

    Chemicals Processing

    Food and Beverage

    Pharmaceuticals

    Oil and Gas

    SOUTH AFRICA Metering Pump Market by Type

    Diaphragm Pumps

    Peristaltic Pumps

    Gear Pumps

    Piston Pumps

    SOUTH AFRICA Metering Pump Market by End Use Industry Type

    Chemical Industry

    Water and Wastewater Management

    Pharmaceutical Industry

    Food and Beverage Industry

    SOUTH AFRICA Metering Pump Market by Pump Capacity Type

    Less than 5 LPH

    5 to 20 LPH

    20 to 100 LPH

    More than 100 LPH

    REST OF MEA Outlook (USD Billion, 2019-2032)

    REST OF MEA Metering Pump Market by Application Type

    Water Treatment

    Chemicals Processing

    Food and Beverage

    Pharmaceuticals

    Oil and Gas

    REST OF MEA Metering Pump Market by Type

    Diaphragm Pumps

    Peristaltic Pumps

    Gear Pumps

    Piston Pumps

    REST OF MEA Metering Pump Market by End Use Industry Type

    Chemical Industry

    Water and Wastewater Management

    Pharmaceutical Industry

    Food and Beverage Industry

    REST OF MEA Metering Pump Market by Pump Capacity Type

    Less than 5 LPH

    5 to 20 LPH

    20 to 100 LPH

    More than 100 LPH


    Infographic

    Free Sample Request

    Kindly complete the form below to receive a free sample of this Report

    Get Free Sample

    Customer Strories

    “I am very pleased with how market segments have been defined in a relevant way for my purposes (such as "Portable Freezers & refrigerators" and "last-mile"). In general the report is well structured. Thanks very much for your efforts.”

    Victoria Milne

    Founder
    Case Study
    Chemicals and Materials