• Cat-intel
  • MedIntelliX
  • Resources
  • About Us
  • Hero Background
    English
    Chinese
    French
    Japanese
    Korean
    German
    Spanish

    Marine Internet of Things Market Analysis

    ID: MRFR/A&D/9110-HCR
    172 Pages
    Swapnil Palwe
    October 2025

    Marine Internet of Things Market Research Report Information by Component (Sensing Devices, Network Connectivity, IoT Platforms, and IT Solutions & Services), Application (Route & Operation Optimization, Asset Tracking, and Equipment Monitoring), Ship Type (Commercial and Defense), and Region—Forecast till 2035

    Share:
    Download PDF ×

    We do not share your information with anyone. However, we may send you emails based on your report interest from time to time. You may contact us at any time to opt-out.

    Marine Internet of Things Market Infographic
    $ 4,950.0
    $ 5,950.0
    $ 7,250.0

    Market Analysis

    In-depth Analysis of Marine Internet of Things Market Industry Landscape

    To revolutionize the maritime sector, the marine internet of thing (IoT) market has been leading in terms of the integration of smart technology and connectivity that boosts efficiency, safety as well as operational capabilities at sea. The market dynamics are influenced by increasing acceptance of IoT solutions across different maritime sectors among them shipping, offshore exploration, and naval operations. Through sensors, data analysis and connectivity marine IoT collects real-time information from ships and other equipment which in turn influences Maritime operations and decision-making.

    Among several aspects driving the market dynamics of Marine IoT is an industry focus on cost containment measures and improved operational efficiencies. Ship performance can be measured through onboard sensors providing insights on factors such as fuel consumption patterns navigation efficiency engine performance as well as equipment health. Therefore, the market meets these needs with advanced IoT platforms that allow ship owners; operators and regulators to maximize efficiency in their vessels, reduce costs for entire fleet management.

    Market trends defining Marine IoT are highly affected by technological advancements in sensors and communication technology. Sensor miniaturization developments in conjunction with low-power wireless protocols or satellite networks has resulted to emergence of tiny energy-efficient devices for use on ships (compact maritime devices). In this regard, providers have made a lot of progress by combining these sophisticated technologies into its marine-based IoT products so that they can be used for purposes like real time monitoring or remote diagnostics.

    Marine regulations regarding safety and environment significantly contribute to shaping the dynamics of Marine IoT Market. The maritime sector experiences strict regulatory systems concerning safety emissions as well as environmental pollution. Thus vessel managers enjoy regulatory compliance because they are provided with tools to check out its air quality control program’s impact on gas emissions, monitor navigational routes within sensitive ecological zones plus guaranteeing safe procedures within their premises using the marine platform. The response offered through the market entails issuance of longtime platforms for conformity with international rules governing shipping thus making it easier for companies to integrate their existing systems into new compliance platforms.

    Market dynamics are driven by the need for improved situational awareness and navigation ability in marine IoT. IoT assists vessel operators with real-time weather monitoring, route optimization, and collision avoidance to enhance the safety of ships. Consequently, this market provides devices that are integrated with these navigation systems plus other weather gadgets as well as communication networks so that they can give users up-to-date information which is vital for decision-making while avoiding risks on sea.

    Data security concerns in the maritime industry shape Marine IoT Market developments significantly due to cyber-crimes committed against shipping vessels. Ships are increasingly becoming more connected and dependent upon Iot devices hence there is a great need for maintaining confidentiality and integrity of maritime data. That is why strict measures such as encrypted communications involving secure device management policies have been put in place by the markets to ensure that its integrity remains intact. As a result, marine IoT solutions have gained credibility leading to their widespread adoption throughout the entire maritime ecosystem.

    Expansion of global shipping activities coupled with the demand for real-time connection drives market dynamics of Marine IoT. Shipping routes change; offshore operations extend and naval capabilities become more advanced prompting for highly reliable scalable IOT solutions. Thus international variation in demands has necessitated flexible marine based platforms which can operate at sea or be supported by various types of installations such as off-shore structures or harbors globally wherever they may be located in order to cater global connectivity requirements within maritime systems.

    Marine IoT market dynamics are influenced by collaborations and partnerships among maritime technology providers, satellite communication companies and regulatory bodies. Their goal is to create standardized solutions that can be easily integrated with other IoT technologies in the marine ecosystem. With open standards as well as a collaborative market focus, Marine IoT can scale up and be adopted widely, making sure there is a connected maritime industry."

    Market Summary

    As per Market Research Future Analysis, the Marine Internet of Things (IoT) market is valued at USD 689.1 Billion and is projected to grow at a CAGR of 17.1% from 2024 to 2032. The market is driven by the digitization and automation of the maritime supply chain, increased seaborne trade, and rising defense expenditures. The maritime tourism industry and advancements in hybrid propulsion technology further contribute to market growth. However, the COVID-19 pandemic has negatively impacted growth projections, particularly in the defense sector, leading to a slower growth rate in 2021 and 2022. The demand for advanced IoT devices to improve vessel efficiency is expected to bolster growth in the coming years.

    Key Market Trends & Highlights

    Key trends influencing the Marine IoT market include technological advancements and increasing adoption across various applications.

    • Market Size: USD 689.1 Billion; CAGR: 17.1% from 2024 to 2032. Asset Tracking segment expected to grow at the highest CAGR during the forecast period. North America accounted for the largest market share in 2020, driven by military expenditure. Asia-Pacific projected to register the highest CAGR, fueled by defense spending in China and India.

    Market Size & Forecast

    Market Size USD 689.1 Billion
    Forecast Growth Rate 17.1% CAGR (2024-2032)
    Expected Growth Rate (2021-2027) 6.2%
    Largest Regional Market Share in 2020 North America

    Major Players

    <p>Cisco Systems, Inc. (US), Marine Digital GmbH (Germany), Vodafone Group Plc (UK), Ericsson AB (Sweden), Orange Business Services (France), Wartsila Oyj Abp (Finland), <a href="https://en.wikipedia.org/wiki/Accenture">Accenture Plc </a>(Ireland), Dualog AS (Norway), Wilhelmsen Holding ASA (Norway), NTT Group (Japan)</p>

    Market Trends

    <p>The integration of IoT technologies in marine operations appears to enhance efficiency and safety, while also promoting sustainable practices across the maritime industry.</p>

    U.S. Department of Transportation

    Marine Internet of Things Market Market Drivers

    Market Growth Visualization

    Increasing Demand for Real-Time Data

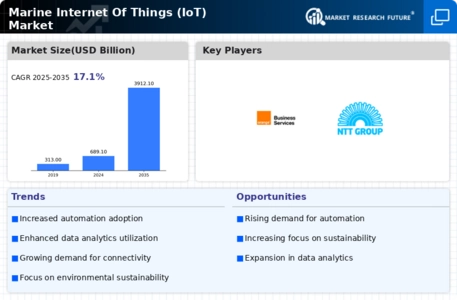
    The Global Marine Internet Of Things (IoT) Market Industry experiences a surge in demand for real-time data analytics, which enhances operational efficiency and decision-making processes. As maritime operations become increasingly complex, stakeholders seek to leverage IoT technologies to monitor vessel performance, fuel consumption, and cargo conditions in real-time. This trend is evidenced by the projected market growth from 689.1 USD Billion in 2024 to an anticipated 3912.1 USD Billion by 2035, reflecting a compound annual growth rate (CAGR) of 17.1% from 2025 to 2035. Such advancements not only optimize resource utilization but also contribute to improved safety and compliance in maritime operations.

    Advancements in Connectivity Technologies

    The Global Marine Internet Of Things (IoT) Market Industry benefits from advancements in connectivity technologies, such as satellite communications and 5G networks. These innovations facilitate seamless data transmission between vessels and shore-based operations, enabling real-time monitoring and control. Enhanced connectivity is crucial for applications like predictive maintenance, where data from onboard sensors can be analyzed to prevent equipment failures. As connectivity improves, the potential for IoT adoption in maritime operations expands, leading to greater efficiency and cost savings. This trend aligns with the overall market growth trajectory, as stakeholders recognize the value of reliable and fast communication in optimizing maritime operations.

    Regulatory Compliance and Safety Standards

    The Global Marine Internet Of Things (IoT) Market Industry is significantly influenced by stringent regulatory compliance and safety standards imposed by maritime authorities. Governments worldwide are increasingly mandating the adoption of IoT solutions to ensure vessel safety, environmental protection, and efficient resource management. For instance, the International Maritime Organization has established guidelines that encourage the integration of IoT technologies for monitoring emissions and enhancing navigational safety. This regulatory push is likely to drive investments in IoT infrastructure, as companies strive to meet compliance requirements while also capitalizing on the operational efficiencies that IoT offers.

    Growing Investment in Smart Shipping Solutions

    The Global Marine Internet Of Things (IoT) Market Industry is witnessing a growing investment in smart shipping solutions, driven by the need for enhanced operational efficiency and cost reduction. Companies are increasingly adopting IoT technologies to automate processes, monitor fleet performance, and improve supply chain visibility. This trend is supported by the projected market growth, with estimates indicating a rise from 689.1 USD Billion in 2024 to 3912.1 USD Billion by 2035. The adoption of smart shipping solutions not only streamlines operations but also enhances competitiveness in a rapidly evolving maritime landscape.

    Sustainability Initiatives in Maritime Operations

    The Global Marine Internet Of Things (IoT) Market Industry is increasingly shaped by sustainability initiatives aimed at reducing the environmental impact of maritime operations. Companies are adopting IoT solutions to monitor emissions, optimize fuel consumption, and enhance waste management practices. For example, IoT-enabled systems can track fuel usage in real-time, allowing for adjustments that minimize carbon footprints. This focus on sustainability not only aligns with global environmental goals but also appeals to consumers and investors who prioritize eco-friendly practices. As a result, the integration of IoT technologies is likely to accelerate, contributing to the overall growth of the market.

    Market Segment Insights

    Regional Insights

    Key Companies in the Marine Internet of Things Market market include

    Industry Developments

    On Mar.09, 2023, Magellan X (Singapore), a leading digital solutions provider, announced the development of disruptive industrial Internet of Things (IIoT) and AI platforms to help maritime and other heavy industries meet their ESG sustainability goals. The tech firm's three disruptive digital solutions are designed to capture the deficit gap by capturing real-time, certifiable data, using IIoT, and producing actionable AI analytics.

    On Dec.01, 2022, Zamil Offshore announced that it is set to deploy internet-of-things (IoT) infrastructure on 60 vessels. Following its agreement with Inmarsat, the offshore services major will roll out its advanced IoT system to assist in the performance optimization of vessels in the Gulf. The system will be deployed on Inmarsat's Fleet Connect & Fleet Data items and other vessels to help identify effective methods to meet optimum vessel performance expectations set by Saudi Aramco.

    On Dec.08, 2021, Wartsila Voyage announced a strategic partnership with Microsoft to industrialize marine IoT. The company is set to provide industrialized IoT for shipping through a scalable cyber-secure platform integrated with Microsoft Azure IoT Edge. Intelligent Edge technology will help the shipping industry fulfill its decarbonization goals.

    On Oct.27, 2021, HMM, South Korea's flagship liner operator, announced that it is set to pilot Internet of Things (IoT) technology for refrigerated and frozen shipping containers. IoT enables the pinpointing of the real-time location of reefers and changes in humidity, temperature, carbon dioxide (CO2), and vibration. Refrigerated and frozen containers need to maintain a constant temperature to their destination.

    On Oct.01, 2020, Taiwanese bulk carrier, U-Ming Marine Transport Corporation (U-MING) announced a partnership with Ericsson to develop an IoT fleet management platform. U-MING aims to digitize its fleet performance management through intelligent IoT connectivity. This innovative fleet performance management platform (FPM) will benefit the company with increased efficiency, greater safety, reduced costs, and lower environmental risks

    • December 2020 – Ericsson launched Mesh Networks, which it claims makes next-generation mobile connectivity the go-to choose for enterprise connectivity across the sea.
    • June 2020 – The China Navigation Company (CNCo) has partnered with Dualog to test its maritime-optimized file and folder replication service designed to simplify the collection and distribution of large data volumes between ship and shore.


    Future Outlook

    Marine Internet of Things Market Future Outlook

    <p>The Marine Internet of Things (IoT) Market is projected to grow at a 17.1% CAGR from 2024 to 2035, driven by advancements in connectivity, automation, and data analytics.</p>

    New opportunities lie in:

    • <p>Develop integrated IoT solutions for real-time vessel monitoring and predictive maintenance. Leverage AI-driven analytics to enhance operational efficiency and reduce costs. Create cybersecurity frameworks tailored for marine IoT applications to ensure data integrity.</p>

    <p>By 2035, the Marine IoT Market is expected to be a robust sector, reflecting substantial growth and innovation.</p>

    Market Segmentation

    Report Scope

    {"0"=>{"market_size"=>""}, "1"=>{"cagr"=>"6.2% (2021–2027)"}, "2"=>{"base_year"=>"2020"}, "3"=>{"forecast_period"=>"2021-2027"}, "4"=>{"historical_data"=>"2019"}, "5"=>{"forecast_units"=>"Value (USD Million)"}, "6"=>{"report_coverage"=>"Revenue Forecast, Competitive Landscape, Growth Factors, and Trends"}, "7"=>{"segments_covered"=>"Component, Application, and Ship Type"}, "8"=>{"geographies_covered"=>""}, "9"=>{"key_vendors"=>"Cisco Systems, Inc., Marine Digital GmbH, Vodafone Group Plc, Ericsson AB, Orange Business Services, Wartsila Oyj Abp, Accenture Plc, Dualog AS, Wilhelmsen Holding ASA, and NTT Group."}, "10"=>{"key_market_opportunities"=>""}, "11"=>{"key_market_drivers"=>""}}

    Market Highlights

    Author

    Swapnil Palwe
    Team Lead - Research

    She holds an experience of about 6+ years in market research and business consulting, working under the spectrum of information communication technology, telecommunications and semiconductor domains. aarti conceptualizes and implements a scalable business strategy and provides strategic leadership to the clients. her expertise lies in market estimation, competitive intelligence, pipeline analysis, customer assessment, etc.

    Leave a Comment

    Latest Comments

    John Doe
    john@example.com

    This is a great article! Really helped me understand the topic better.

    Posted on July 23, 2025, 10:15 AM
    Jane Smith
    jane@domain.com

    Thanks for sharing this. I’ve bookmarked it for later reference.

    Posted on July 22, 2025, 7:45 PM

    FAQs

    How big is the Marine Internet Of Things (IoT) Market

    Marine Internet Of Things (IoT) Market Grow at a CAGR Of 17.1% by 2020 -2030

    Which are the top players involved in Marine Internet Of Things (IoT) business?

    Cisco Systems, Inc. (US),Marine Digital GmbH (Germany),Vodafone Group Plc (UK),Ericsson AB (Sweden),Orange Business Services (France),Wartsila Oyj Abp (Finland),Accenture Plc (Ireland),Dualog AS (Norway),Wilhelmsen Holding ASA (Norway),NTT Group (Japan)

    Which regions is predicted to held the highest share in the Marine Internet Of Things (IoT) market?

    According to Recent Study North America Accounted for the Largest Market Share

    Which segments are covered in Internet Of Things (IoT) market report?

    According MRFR Latest Study Component, Application, and Ship Type this are Internet Of Things (IoT) market

    1. --- 'Table of Contents
    2. Executive Summary
      1. Market Attractiveness Analysis
        1. Global Marine Internet of ThingsMarket, byComponent
        2. Global Marine Internet of Things Market, byApplication
        3. Global Marine Internet of Things Market, byShip Type
        4. Global Marine Internet of Things Market, byRegion
    3. Market Introduction
      1. Market Definition
      2. Scope of the Study
      3. Market Structure
      4. Key Buying Criteria
      5. Market Factor Indicator Analysis
    4. Research Methodology
      1. Research Process
      2. Primary Research
      3. Secondary Research
      4. Market Size Estimation
      5. Forecast Model
      6. List of Assumptions
    5. Market Insights
    6. Market Dynamics
      1. Introduction
      2. Drivers
        1. Increase in Seaborne Trade Globally
        2. Growing Maritime Tourism Industry
        3. Increasing Defense Expenditure
        4. Drivers Impact Analysis
      3. Restraint
        1. Vulnerable to Cyberattacks
        2. High Initial Investment
      4. Opportunities
        1. Use of Renewable Sources of Energy
        2. Advancements in Hybrid Propulsion Technology
      5. Market/Technological Trends
      6. Patent Trends
      7. Regulatory Landscape/Standards
    7. Market Factor Analysis
      1. Value Chain/Supply Chain Analysis
        1. R&D
        2. Manufacturing
        3. Distribution & Sales
        4. Post-Sales Monitoring
      2. Porter’s Five Forces Analysis
        1. Threat of New Entrants
        2. Bargaining Power of Buyers
        3. Threat of Substitutes
        4. Segment Rivalry
        5. Bargaining Power of Supplies
    8. Global Marine Internet of Things Market, by Component
      1. Introduction
      2. Sensing Devices
      3. Network Connectivity
      4. IoT Platforms
      5. IT Solutions & Services
    9. Global Marine Internet of Things Market, by Application
      1. Introduction
      2. Route & Operation Optimization
      3. Asset Tracking
      4. Equipment Monitoring
    10. Global Marine Internet of Things Market, by Ship Type
      1. Introduction
      2. Commercial
        1. Cargo Vessels
        2. Passenger Vessels
        3. Others
      3. Defense
        1. Destroyers
        2. Destroyers
        3. Frigates
        4. Corvettes
        5. Offshore Support Vessels (OSV)
        6. Aircraft Carriers
        7. Submarines
    11. Global Marine Internet of Things Market, by Region
      1. Introduction
      2. North America
        1. US
        2. Canada
      3. Europe
        1. UK
        2. Germany
        3. France
        4. Italy
        5. Rest of Europe
      4. Asia-Pacific
        1. China
        2. Japan
        3. India
        4. Australia
        5. Rest of Asia-Pacific
      5. Middle East & Africa
        1. Saudi Arabia
        2. UAE
        3. Rest of Middle East & Africa
      6. Latin America
        1. Brazil
        2. Rest of Latin America
    12. Competitive Landscape
      1. Competitive Overview
      2. Competitor Dashboard
      3. Major Growth Key Strategies in the Global Marine Internet of Things Market
      4. Competitive Benchmarking
      5. Market Share Analysis
      6. Leading Player in terms of the Number of Developments in the Global Marine Internet of Things Market
      7. Key Developments & Growth Strategies
        1. New Product/Service ApplicationLaunch
        2. Merger & Acquisition
        3. Joint Ventures
    13. Company Profiles
      1. Key Market Players
    14. (Company overview, financial updates, products & service offered, key developments, SWOT analysis, and key strategies to be provided for all the listed companies)
      1. Cisco Systems, Inc.
        1. Marine Digital GmbH
        2. Vodafone Group Plc
        3. Ericsson AB
        4. Orange Business Services
        5. Wartsila OyjAbp
        6. Accenture Plc
        7. Dualog AS
        8. Wilhelmsen Holding ASA
        9. NTT Group
    15. Appendix
      1. References
      2. Related Reports
      3. List of Abbreviation 
    16. List of Tables and Figures
      1. List of Tables
      2. TABLE 1 LIST OF ASSUMPTIONS
      3. TABLE 2 MAJOR PATENTS GRANTED FOR MARINE INTERNET OF THINGS (2015–2020)
      4. TABLE 3 COMPONENT: GLOBAL MARINE INTERNET OF THINGS MARKET, 2020–2030 (USD MILLION)
      5. TABLE 4 APPLICATION: GLOBAL MARINE INTERNET OF THINGS MARKET, 2020–2030 (USD MILLION)
      6. TABLE 5 SHIP TYPE: GLOBAL MARINE INTERNET OF THINGS MARKET, 2020–2030(USD MILLION)
      7. TABLE 6 GLOBAL MARINE INTERNET OF THINGS MARKET, BY REGION, 2020–2030 (USD MILLION)
      8. TABLE 7 NORTH AMERICA: MARINE INTERNET OF THINGS MARKET, BY COUNTRY, 2020–2030(USD MILLION)
      9. TABLE 8 NORTH AMERICA: MARINE INTERNET OF THINGS MARKET, BY COMPONENT, 2020–2030 (USD MILLION)
      10. TABLE 9 NORTH AMERICA: MARINE INTERNET OF THINGS MARKET, BY APPLICATION, 2020–2030 (USD MILLION)
      11. TABLE 10 NORTH AMERICA: MARINE INTERNET OF THINGS MARKET, BY SHIP TYPE, 2020–2030 (USD MILLION)
      12. TABLE 11 US: MARINE INTERNET OF THINGS MARKET, BY COMPONENT, 2020–2030 (USD MILLION)
      13. TABLE 12 US: MARINE INTERNET OF THINGS MARKET, BY APPLICATION, 2020–2030 (USD MILLION)
      14. TABLE 13 US: MARINE INTERNET OF THINGS MARKET, BY SHIP TYPE, 2020–2030 (USD MILLION)
      15. TABLE 14 CANADA: MARINE INTERNET OF THINGS MARKET, BY COMPONENT, 2020–2030 (USD MILLION)
      16. TABLE 15 CANADA: MARINE INTERNET OF THINGS MARKET, BY APPLICATION, 2020–2030 (USD MILLION)
      17. TABLE 16 CANADA: MARINE INTERNET OF THINGS MARKET, BY SHIP TYPE, 2020–2030 (USD MILLION)
      18. TABLE 17 EUROPE: MARINE INTERNET OF THINGS MARKET, BY COUNTRY, 2020–2030 (USD MILLION)
      19. TABLE 18 EUROPE: MARINE INTERNET OF THINGS MARKET, BY COMPONENT, 2020–2030 (USD MILLION)
      20. TABLE 19 EUROPE: MARINE INTERNET OF THINGS MARKET, BY APPLICATION, 2020–2030 (USD MILLION)
      21. TABLE 20 EUROPE: MARINE INTERNET OF THINGS MARKET, BY SHIP TYPE, 2020–2030 (USD MILLION)
      22. TABLE 21 UK: MARINE INTERNET OF THINGS MARKET, BY COMPONENT, 2020–2030 (USD MILLION)
      23. TABLE 22 UK: MARINE INTERNET OF THINGS MARKET, BY APPLICATION, 2020–2030 (USD MILLION)
      24. TABLE 23 UK: MARINE INTERNET OF THINGS MARKET, BY SHIP TYPE, 2020–2030 (USD MILLION)
      25. TABLE 24 GERMANY: MARINE INTERNET OF THINGS MARKET, BY COMPONENT, 2020–2030 (USD MILLION)
      26. TABLE 25 GERMANY: MARINE INTERNET OF THINGS MARKET, BY APPLICATION, 2020–2030 (USD MILLION)
      27. TABLE 26 GERMANY: MARINE INTERNET OF THINGS MARKET, BY SHIP TYPE, 2020–2030 (USD MILLION)
      28. TABLE 27 FRANCE: MARINE INTERNET OF THINGS MARKET, BY COMPONENT, 2020–2030 (USD MILLION)
      29. TABLE 28 FRANCE: MARINE INTERNET OF THINGS MARKET, BY APPLICATION, 2020–2030 (USD MILLION)
      30. TABLE 29 FRANCE: MARINE INTERNET OF THINGS MARKET, BY SHIP TYPE, 2020–2030 (USD MILLION)
      31. TABLE 30 ITALY: MARINE INTERNET OF THINGS MARKET, BY COMPONENT, 2020–2030 (USD MILLION)
      32. TABLE 31 ITALY: MARINE INTERNET OF THINGS MARKET, BY APPLICATION, 2020–2030 (USD MILLION)
      33. TABLE 32 ITALY: MARINE INTERNET OF THINGS MARKET, BY SHIP TYPE, 2020–2030 (USD MILLION)
      34. TABLE 33 REST OF EUROPE: MARINE INTERNET OF THINGS MARKET, BY COMPONENT, 2020–2030 (USD MILLION)
      35. TABLE 34 REST OF EUROPE: MARINE INTERNET OF THINGS MARKET, BY APPLICATION, 2020–2030 (USD MILLION)
      36. TABLE 35 REST OF EUROPE: MARINE INTERNET OF THINGS MARKET, BY SHIP TYPE, 2020–2030 (USD MILLION)
      37. TABLE 36 ASIA-PACIFIC: MARINE INTERNET OF THINGS MARKET, BY COUNTRY, 2020–2030 (USD MILLION)
      38. TABLE 37 ASIA-PACIFIC: MARINE INTERNET OF THINGS MARKET, BY COMPONENT, 2020–2030 (USD MILLION)
      39. TABLE 38 ASIA-PACIFIC: MARINE INTERNET OF THINGS MARKET, BY APPLICATION, 2020–2030 (USD MILLION)
      40. TABLE 39 ASIA-PACIFIC: MARINE INTERNET OF THINGS MARKET, BY SHIP TYPE, 2020–2030 (USD MILLION)
      41. TABLE 40 CHINA: MARINE INTERNET OF THINGS MARKET, BY COMPONENT, 2020–2030 (USD MILLION)
      42. TABLE 41 CHINA: MARINE INTERNET OF THINGS MARKET, BY APPLICATION, 2020–2030 (USD MILLION)
      43. TABLE 42 CHINA: MARINE INTERNET OF THINGS MARKET, BY SHIP TYPE, 2020–2030 (USD MILLION)
      44. TABLE 43 INDIA: MARINE INTERNET OF THINGS MARKET, BY COMPONENT, 2020–2030 (USD MILLION)
      45. TABLE 44 INDIA: MARINE INTERNET OF THINGS MARKET, BY APPLICATION, 2020–2030 (USD MILLION)
      46. TABLE 45 INDIA: MARINE INTERNET OF THINGS MARKET, BY SHIP TYPE, 2020–2030 (USD MILLION)
      47. TABLE 46 JAPAN: MARINE INTERNET OF THINGS MARKET, BY COMPONENT, 2020–2030(USD MILLION)
      48. TABLE 47 JAPAN: MARINE INTERNET OF THINGS MARKET, BY APPLICATION, 2020–2030 (USD MILLION)
      49. TABLE 48 JAPAN: MARINE INTERNET OF THINGS MARKET, BY SHIP TYPE, 2020–2030 (USD MILLION)
      50. TABLE 49 AUSTRALIA: MARINE INTERNET OF THINGS MARKET, BY COMPONENT, 2020–2030 (USD MILLION)
      51. TABLE 50 AUSTRALIA: MARINE INTERNET OF THINGS MARKET, BY APPLICATION, 2020–2030 (USD MILLION)
      52. TABLE 51 AUSTRALIA: MARINE INTERNET OF THINGS MARKET, BY SHIP TYPE, 2020–2030 (USD MILLION)
      53. TABLE 52 REST OF ASIA-PACIFIC: MARINE INTERNET OF THINGS MARKET, BY COMPONENT, 2020–2030 (USD MILLION)
      54. TABLE 53 REST OF ASIA-PACIFIC: MARINE INTERNET OF THINGS MARKET, BY APPLICATION, 2020–2030 (USD MILLION)
      55. TABLE 54 REST OF ASIA-PACIFIC: MARINE INTERNET OF THINGS MARKET, BY SHIP TYPE, 2020–2030 (USD MILLION)
      56. TABLE 55 MIDDLE EAST & AFRICA: MARINE INTERNET OF THINGS MARKET, BY COUNTRY, 2020–2030 (USD MILLION)
      57. TABLE 56 MIDDLE EAST & AFRICA: MARINE INTERNET OF THINGS MARKET, BY COMPONENT, 2020–2030 (USD MILLION)
      58. TABLE 57 MIDDLE EAST & AFRICA: MARINE INTERNET OF THINGS MARKET, BY APPLICATION, 2020–2030 (USD MILLION)
      59. TABLE 58 MIDDLE EAST & AFRICA: MARINE INTERNET OF THINGS MARKET, BY SHIP TYPE, 2020–2030 (USD MILLION)
      60. TABLE 59 SAUDI ARABIA: MARINE INTERNET OF THINGS MARKET, BY COMPONENT, 2020–2030 (USD MILLION)
      61. TABLE 60 SAUDI ARABIA: MARINE INTERNET OF THINGS MARKET, BY APPLICATION, 2020–2030 (USD MILLION)
      62. TABLE 61 SAUDI ARABIA: MARINE INTERNET OF THINGS MARKET, BY SHIP TYPE, 2020–2030 (USD MILLION)
      63. TABLE 62 UAE: MARINE INTERNET OF THINGS MARKET, BY COMPONENT, 2020–2030 (USD MILLION)
      64. TABLE 63 UAE: MARINE INTERNET OF THINGS MARKET, BY APPLICATION, 2020–2030 (USD MILLION)
      65. TABLE 64 UAE: MARINE INTERNET OF THINGS MARKET, BY SHIP TYPE, 2020–2030 (USD MILLION)
      66. TABLE 65 REST OF THE MIDDLE EAST & AFRICA: MARINE INTERNET OF THINGS MARKET, BY COMPONENT, 2020–2030 (USD MILLION)
      67. TABLE 66 REST OF THE MIDDLE EAST & AFRICA: MARINE INTERNET OF THINGS MARKET, BY APPLICATION, 2020–2030 (USD MILLION)
      68. TABLE 67 REST OF THE MIDDLE EAST & AFRICA: MARINE INTERNET OF THINGS MARKET, BY SHIP TYPE, 2020–2030 (USD MILLION)
      69. TABLE 68 LATIN AMERICA: MARINE INTERNET OF THINGS MARKET, BY COUNTRY, 2020–2030 (USD MILLION)
      70. TABLE 69 LATIN AMERICA: MARINE INTERNET OF THINGS MARKET, BY COMPONENT, 2020–2030 (USD MILLION)
      71. TABLE 70 LATIN AMERICA: MARINE INTERNET OF THINGS MARKET, BY APPLICATION, 2020–2030 (USD MILLION)
      72. TABLE 71 LATIN AMERICA: MARINE INTERNET OF THINGS MARKET, BY SHIP TYPE, 2020–2030 (USD MILLION)
      73. TABLE 72 BRAZIL: MARINE INTERNET OF THINGS MARKET, BY COMPONENT, 2020–2030 (USD MILLION)
      74. TABLE 73 BRAZIL: MARINE INTERNET OF THINGS MARKET, BY APPLICATION, 2020–2030 (USD MILLION)
      75. TABLE 74 BRAZIL: MARINE INTERNET OF THINGS MARKET, BY SHIP TYPE, 2020–2030 (USD MILLION)
      76. TABLE 75 REST OF LATIN AMERICA: MARINE INTERNET OF THINGS MARKET, BY COMPONENT, 2020–2030 (USD MILLION)
      77. TABLE 76 REST OF LATIN AMERICA: MARINE INTERNET OF THINGS MARKET, BY APPLICATION,2020–2030 (USD MILLION)
      78. TABLE 77 REST OF LATIN AMERICA: MARINE INTERNET OF THINGS MARKET, BY FREQUENCY-BAND, 2020–2030 (USD MILLION)
      79. TABLE 78 THE MOST ACTIVE PLAYERS IN THE GLOBAL MARINE INTERNET OF THINGS MARKET
      80. TABLE 79 CONTRACTS & AGREEMENTS
      81. TABLE 80 MERGERS & ACQUISITIONS
      82. TABLE 81 PRODUCT DEVELOPMENTS
      83. TABLE 82 EXPANSIONS & INVESTMENTS
      84. TABLE 83 JOINT VENTURES & PARTNERSHIPS   List of Figures
      85. FIGURE 1 MARKET SYNOPSIS
      86. FIGURE 2 GLOBAL MARINE INTERNET OF THINGS MARKET: MARKET ATTRACTIVENESS ANALYSIS
      87. FIGURE 3 GLOBAL MARINE INTERNET OF THINGS MARKET ANALYSIS, BY COMPONENT
      88. FIGURE 4 GLOBAL MARINE INTERNET OF THINGS MARKET ANALYSIS, BY APPLICATION
      89. FIGURE 5 GLOBAL MARINE INTERNET OF THINGS MARKET ANALYSIS, BY SHIP TYPE
      90. FIGURE 6 GLOBAL MARINE INTERNET OF THINGS MARKET ANALYSIS, BY REGION
      91. FIGURE 7 GLOBAL MARINE INTERNET OF THINGS MARKET: MARKET STRUCTURE
      92. FIGURE 8 KEY BUYING CRITERIA FOR MARINE COMPONENTS
      93. FIGURE 9 RESEARCH PROCESS OF MRFR
      94. FIGURE 10 NORTH AMERICA: MARKET SIZE & MARKET SHARE, BY COUNTRY, 2020 VS 2030
      95. FIGURE 11 EUROPE: MARKET SIZE & MARKET SHARE, BY COUNTRY, 2020 VS 2030
      96. FIGURE 12 ASIA-PACIFIC: MARKET SIZE & MARKET SHARE, BY COUNTRY, 2020 VS 2030
      97. FIGURE 13 MIDDLE EAST & AFRICA: MARKET SIZE & MARKET SHARE, BY COUNTRY, 2020 VS 2030
      98. FIGURE 14 LATIN AMERICA: MARKET SIZE & MARKET SHARE, BY REGION, 2020 VS 2030
      99. FIGURE 15 MARKET DYNAMICS OVERVIEW
      100. FIGURE 16 DRIVERS IMPACT ANALYSIS: GLOBAL MARINE INTERNET OF THINGS MARKET
      101. FIGURE 17 CHALLENGES IMPACT ANALYSIS: GLOBAL MARINE INTERNET OF THINGS MARKET
      102. FIGURE 18 PORTER’S FIVE FORCES ANALYSIS OF THE GLOBAL MARINE INTERNET OF THINGS MARKET
      103. FIGURE 19 SUPPLY CHAIN: GLOBAL MARINE INTERNET OF THINGS MARKET
      104. FIGURE 20 GLOBAL MARINE INTERNET OF THINGS MARKET SHARE, BY COMPONENT, 2020 (% SHARE)
      105. FIGURE 21 GLOBAL MARINE INTERNET OF THINGS MARKET SHARE, BY SHIP TYPE, 2020 (% SHARE)
      106. FIGURE 22 GLOBAL MARINE INTERNET OF THINGS MARKET SHARE, BY REGION, 2020 (% SHARE)
      107. FIGURE 23 NORTH AMERICA: MARINE INTERNET OF THINGS MARKET SHARE, BY COUNTRY, 2020 (% SHARE)
      108. FIGURE 24 EUROPE: MARINE INTERNET OF THINGS MARKET SHARE, BY COUNTRY, 2020 (% SHARE)
      109. FIGURE 25 ASIA-PACIFIC: MARINE INTERNET OF THINGS MARKET SHARE, BY COUNTRY, 2020 (% SHARE)
      110. FIGURE 26 MIDDLE EAST & AFRICA: MARINE INTERNET OF THINGS MARKET SHARE, BY COUNTRY, 2020 (% SHARE)
      111. FIGURE 27 LATIN AMERICA: MARINE INTERNET OF THINGS MARKET SHARE, BY COUNTRY, 2020 (% SHARE)
      112. FIGURE 28 COMPETITOR DASHBOARD: GLOBAL MARINE INTERNET OF THINGS MARKET
      113. FIGURE 29 CAPITAL MARKET RATIO AND FINANCIAL MATRIX
      114. FIGURE 30 CONTRACTS & AGREEMENTS: THE MAJOR STRATEGY ADOPTED BY KEY PLAYERS IN THE GLOBAL MARINE INTERNET OF THINGS MARKET
      115. FIGURE 31 BENCHMARKING OF MAJOR COMPETITORS
      116. FIGURE 32 MAJOR MANUFACTURERS MARKET SHARE ANALYSIS, 2020'

    Marine Internet of Things Market Segmentation

    Market Segmentation Overview

    • Detailed segmentation data will be available in the full report
    • Comprehensive analysis by multiple parameters
    • Regional and country-level breakdowns
    • Market size forecasts by segment
    Infographic

    Free Sample Request

    Kindly complete the form below to receive a free sample of this Report

    Get Free Sample

    Customer Strories

    “I am very pleased with how market segments have been defined in a relevant way for my purposes (such as "Portable Freezers & refrigerators" and "last-mile"). In general the report is well structured. Thanks very much for your efforts.”

    Victoria Milne

    Founder
    Case Study
    Chemicals and Materials