• Cat-intel
  • MedIntelliX
  • Resources
  • About Us
  • Request Free Sample ×

    Kindly complete the form below to receive a free sample of this Report

    Leading companies partner with us for data-driven Insights

    clients tt-cursor

    Magic Wall Interactive Surfaces Market

    ID: MRFR/ICT/0606-HCR
    110 Pages
    Aarti Dhapte
    September 2025

    Magic Wall Interactive Surfaces Market Research Report: By Application (Advertising, Education, Entertainment, Retail, Healthcare), By End Use (Commercial, Residential, Institutional), By Technology (Touch Technology, Gesture Technology, Projection Technology), By Component (Hardware, Software, Services) and By Regional (North America, Europe, South America, Asia Pacific, Middle East and Africa) - Forecast to 2032

    Share:
    Download PDF ×

    We do not share your information with anyone. However, we may send you emails based on your report interest from time to time. You may contact us at any time to opt-out.

    Magic Wall Interactive Surfaces Market Research Report - Forecast to 2032 Infographic
    Purchase Options
    $ 4,950.0
    $ 5,950.0
    $ 7,250.0
    Table of Contents

    Magic Wall Interactive Surfaces Market Summary

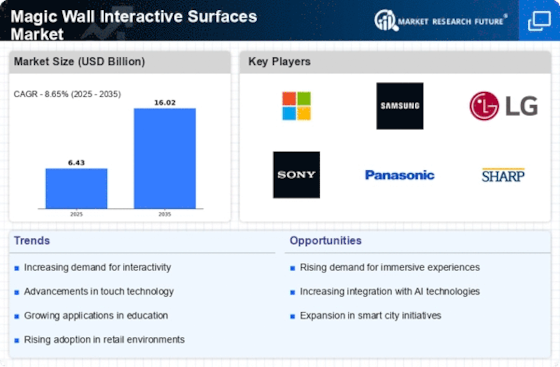
    The Global Magic Wall Interactive Surfaces Market is projected to grow significantly from 6.45 USD Billion in 2024 to 16.0 USD Billion by 2035.

    Key Market Trends & Highlights

    Magic Wall Interactive Surfaces Key Trends and Highlights

    • The market is expected to experience a compound annual growth rate of 8.64% from 2025 to 2035.
    • By 2035, the market valuation is anticipated to reach 16.0 USD Billion, indicating robust growth potential.
    • In 2024, the market is valued at 6.45 USD Billion, reflecting a strong foundation for future expansion.
    • Growing adoption of interactive technology due to increasing demand for immersive experiences is a major market driver.

    Market Size & Forecast

    2024 Market Size 6.45 (USD Billion)
    2035 Market Size 16.0 (USD Billion)
    CAGR (2025-2035) 8.64%

    Major Players

    LG Electronics, Panasonic, Cisco Systems, ViewSonic, MMD Monitors, Innolux Corporation, Sharp Corporation, MultiTouch, Samsung Electronics, NEC, Obscura Digital, Microsoft, TouchJet, Evoke Studio, Sony

    Magic Wall Interactive Surfaces Market Trends

    The Global Magic Wall Interactive Surfaces Market is experiencing significant growth driven by advancements in technology and increasing demand for engaging user experiences. The rise of smart city initiatives and the integration of interactive surfaces in retail, education, and entertainment sectors are substantial contributors to market expansion. Businesses are keen on enhancing user interaction and customer engagement, which has led to the rapid adoption of these interactive solutions.

    Moreover, the growing trend of remote collaboration and online education has accelerated the need for interactive displays that can facilitate better communication and learning experiences.There are numerous opportunities for companies within this market as they look to new applications and technology. The use of augmented reality and AI-enriched interactive surfaces creates opportunities to reach new customer groups. There is also space for developing specialized solutions for a given market segment which can help a company to compete.

    The requirements for intuitive and easy-to-use interfaces constantly force suppliers to come up with new ideas so that great experiences become commonplace in many environments. Lately, there has been a distinct focus on the areas of sustainability, with many active plans to produce more green products and services.

    This trend is reshaping designs and materials used in the production of interactive surfaces. The emphasis on touchless technology is also growing, with many consumers seeking options that minimize physical contact, especially in the wake of global health concerns. As such, businesses must remain agile and responsive to changing consumer behaviors and technological advancements to thrive in this dynamic environment. Overall, the landscape for magic wall interactive surfaces reflects a blend of creativity, technology, and a focus on enhancing user engagement across multiple sectors.

    Fig 1: Magic Wall Interactive Surfaces Market Overview

    The increasing integration of interactive surfaces in educational and corporate environments suggests a transformative shift towards more engaging and collaborative experiences.

    U.S. Department of Education

    Magic Wall Interactive Surfaces Market Drivers

    Market Growth Charts

    Enhanced User Experience

    The Global Magic Wall Interactive Surfaces Market Industry is driven by the need for enhanced user experiences across various sectors. Businesses are recognizing the importance of engaging customers through interactive technologies that provide memorable experiences. For instance, museums and exhibitions are utilizing interactive surfaces to create immersive displays that captivate visitors. This focus on user experience is likely to encourage more organizations to invest in interactive surfaces, thereby contributing to the overall growth of the market.

    Technological Advancements

    The Global Magic Wall Interactive Surfaces Market Industry is experiencing rapid technological advancements that enhance user interaction and engagement. Innovations in touch-sensitive technologies, projection mapping, and augmented reality are driving the development of more sophisticated interactive surfaces. For instance, the integration of artificial intelligence into these surfaces allows for personalized user experiences, which is increasingly appealing to businesses and educational institutions. As a result, the market is projected to grow from 6.45 USD Billion in 2024 to 16.0 USD Billion by 2035, reflecting a compound annual growth rate of 8.64% from 2025 to 2035.

    Growth in Retail Applications

    The Global Magic Wall Interactive Surfaces Market Industry is benefiting from the growing adoption of interactive surfaces in retail environments. Retailers are leveraging these technologies to create immersive shopping experiences that attract customers and enhance brand engagement. Interactive displays allow consumers to explore products in a dynamic manner, leading to increased sales and customer satisfaction. For instance, major retail chains are implementing interactive walls to showcase promotions and product information. This trend is expected to drive substantial growth in the market, as retailers seek innovative solutions to differentiate themselves in a competitive landscape.

    Increasing Demand in Education

    The Global Magic Wall Interactive Surfaces Market Industry is witnessing a surge in demand within the education sector. Educational institutions are increasingly adopting interactive surfaces to facilitate engaging learning environments. These surfaces enable collaborative learning and interactive presentations, which enhance student participation and retention. For example, schools and universities are utilizing these technologies for interactive lectures and group projects. This trend is likely to contribute significantly to the market's growth, as educational budgets are increasingly allocated towards innovative teaching tools, further solidifying the market's expansion.

    Rising Interest in Smart Cities

    The Global Magic Wall Interactive Surfaces Market Industry is also influenced by the rising interest in smart city initiatives. Urban planners and local governments are increasingly incorporating interactive surfaces into public spaces to enhance citizen engagement and information dissemination. These surfaces can display real-time data, maps, and community information, fostering a more connected urban environment. As cities strive to improve public services and citizen interaction, the demand for such technologies is likely to grow, further propelling the market forward.

    Market Segment Insights

    Get more detailed insights about Magic Wall Interactive Surfaces Market Research Report - Forecast to 2032

    Regional Insights

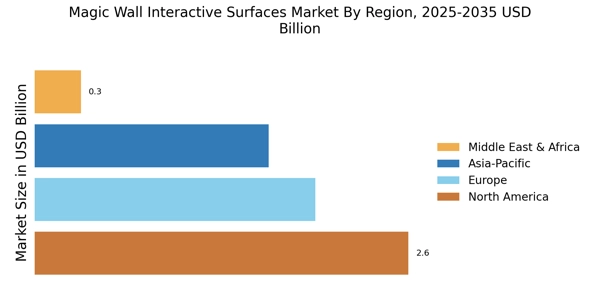
    The Global Magic Wall Interactive Surfaces Market showcases a strong regional presence, with North America leading the way as a dominant force, holding a market valuation of 2.15 USD Billion in 2023 and projected to rise to 4.45 USD Billion by 2032. This region plays a pivotal role due to its technological advancements and high adoption rate of interactive surfaces in various applications.

    Europe follows, with a valuation of 1.68 USD Billion in 2023, growing to 3.45 USD Billion, signifying significant interest in interactive technologies across a variety of sectors.The APAC region, valued at 1.52 USD Billion in 2023, is expected to reach 3.1 USD Billion, reflecting its increasing investment in digital solutions and interactive displays. In South America, the market stands at 0.4 USD Billion in 2023 and is projected to climb to 0.85 USD Billion, indicating growing interest yet remaining a smaller portion of the overall market.

    Lastly, the MEA region begins at 0.17 USD Billion in 2023 and is expected to expand to 0.65 USD Billion, showcasing the potential for growth as interactive surfaces gain traction in this emerging market.These regional insights highlight the varied levels of market maturity and the opportunities that exist in expanding the Global Magic Wall Interactive Surfaces Market revenue through strategic investments and innovations.

    Fig 3: Magic Wall Interactive Surfaces Market Regional Insights

    Magic Wall Interactive Surfaces Market Regional Insights

    Source: Primary Research, Secondary Research, Market Research Future Database and Analyst Review

    Key Players and Competitive Insights

    The Global Magic Wall Interactive Surfaces Market is a rapidly evolving sector characterized by innovative technologies that enhance user experience and engagement. This market encompasses a variety of products designed to deliver interactive solutions, enabling users to interact with digital content in a more intuitive manner. With the proliferation of smart devices and the increasing demand for visually engaging displays in both commercial and residential sectors, competition is intensifying among key players. The market is marked by significant advancements in touch and gesture recognition technologies, display quality and connectivity features.

    Consequently, companies strive to differentiate their products through unique features, superior performance, and enhanced customer support services. As market dynamics continue to shift, understanding the competitive landscape becomes crucial for stakeholders aiming to capitalize on emerging opportunities.LG Electronics has established a noteworthy presence in the Global Magic Wall Interactive Surfaces Market, leveraging its historical expertise in display technology to craft innovative interactive solutions. The company is recognized for its superior engineering, driving advancements in both hardware and software that cater to diverse user needs.

    LG Electronics prioritizes cutting-edge display quality, incorporating OLED and high-resolution screens that enhance the visual appeal of its interactive surfaces. The brand’s commitment to research and development ensures the integration of the latest digital technologies into its offerings, thus solidifying its competitive edge.

    Furthermore, LG's strategic alliances and partnerships across various sectors broaden its market reach, allowing it to tap into new customer bases while consistently enhancing user experiences through tailored solutions.Panasonic also plays a significant role in the Global Magic Wall Interactive Surfaces Market, bringing a wealth of experience in electronic systems and advanced technology to the forefront of this competitive landscape. The company's focus on creating robust, user-friendly interactive surfaces aligns with the growing demand for effective communication tools in educational and corporate environments. Panasonic emphasizes reliability and durability in its product designs, which appeal to customers who seek long-lasting investments.

    Additionally, the integration of sophisticated technologies such as multi-touch capabilities and AI-driven features positions Panasonic favorably against competitors. The company’s operational agility allows it to respond swiftly to evolving market demands, further enhancing its appeal. By focusing on delivering interactive experiences that facilitate collaboration and engagement, Panasonic continues to maintain a strong foothold in this dynamic market segment.

    Key Companies in the Magic Wall Interactive Surfaces Market market include

    Industry Developments

    The Global Magic Wall Interactive Surfaces Market is witnessing significant developments, particularly from key players such as LG Electronics, Panasonic, and Samsung Electronics. LG Electronics recently showcased advanced interactive LED solutions that enhance user engagement, while Panasonic is focusing on integrating AI capabilities in their interactive surfaces to cater to smart environments. Cisco Systems is advancing collaboration technologies, which support enhanced interactive wall applications in corporate settings. ViewSonic and MMD Monitors are launching innovative display technologies that increase interactivity and user experience. Sharp Corporation continues to innovate with high-resolution displays suited for educational and corporate applications.

    Notably, there have been discussions in the market about mergers and acquisitions, though specific recent transactions involving these companies have not been publicly disclosed. The market is also experiencing a growth surge as advancements in technology increase the adoption of interactive surfaces in various sectors, particularly education, corporate, and entertainment, thereby impacting overall market valuation positively. The continuous evolution of interactive technologies and collaborations among leading firms suggests a promising trajectory for the market moving forward.

    Future Outlook

    Magic Wall Interactive Surfaces Market Future Outlook

    The Magic Wall Interactive Surfaces Market is projected to grow at an 8.64% CAGR from 2024 to 2035, driven by technological advancements and increasing demand for interactive solutions.

    New opportunities lie in:

    • Develop tailored solutions for educational institutions to enhance interactive learning experiences.
    • Leverage augmented reality features to create immersive marketing displays for retail environments.
    • Invest in partnerships with tech firms to integrate AI capabilities into interactive surfaces.

    By 2035, the market is expected to reach a robust position, reflecting substantial growth and innovation.

    Market Segmentation

    Magic Wall Interactive Surfaces Market End Use Outlook

    • Commercial
    • Residential
    • Institutional

    Magic Wall Interactive Surfaces Market Regional Outlook

    • North America
    • Europe
    • South America
    • Asia Pacific
    • Middle East and Africa

    Magic Wall Interactive Surfaces Market Component Outlook

    • Hardware
    • Software
    • Services

    Magic Wall Interactive Surfaces Market Technology Outlook

    • Touch Technology
    • Gesture Technology
    • Projection Technology

    Magic Wall Interactive Surfaces Market Application Outlook

    • Advertising
    • Education
    • Entertainment
    • Retail
    • Healthcare

    Report Scope

    Attribute/Metric Details
    Market Size 2022 5.45 (USD Billion)
    Market Size 2023 5.92 (USD Billion)
    Market Size 2032 12.5 (USD Billion)
    Compound Annual Growth Rate (CAGR) 8.65% (2024 - 2032)
    Report Coverage Revenue Forecast, Competitive Landscape, Growth Factors, and Trends
    Base Year 2023
    Market Forecast Period 2024 - 2032
    Historical Data 2019 - 2023
    Market Forecast Units USD Billion
    Key Companies Profiled LG Electronics, Panasonic, Cisco Systems, ViewSonic, MMD Monitors, Innolux Corporation, Sharp Corporation, MultiTouch, Samsung Electronics, NEC, Obscura Digital, Microsoft, TouchJet, Evoke Studio, Sony
    Segments Covered Application, End Use, Technology, Component, Regional
    Key Market Opportunities Increased demand for immersive experiences, Expanding adoption in the education sector, Growth in retail interactive displays, Rising interest in smart homes, Integration with AR/VR technologies
    Key Market Dynamics growing adoption in retail, increasing demand for immersive experiences, advancements in display technology, the rise of interactive advertising, expansion in the education sector
    Countries Covered North America, Europe, APAC, South America, MEA

    Market Highlights

    Author
    Aarti Dhapte
    Team Lead - Research

    She holds an experience of about 6+ years in Market Research and Business Consulting, working under the spectrum of Information Communication Technology, Telecommunications and Semiconductor domains. Aarti conceptualizes and implements a scalable business strategy and provides strategic leadership to the clients. Her expertise lies in market estimation, competitive intelligence, pipeline analysis, customer assessment, etc.

    Leave a Comment

    FAQs

    What is the projected market size for the Global Magic Wall Interactive Surfaces Market in 2032?

    The Global Magic Wall Interactive Surfaces Market is expected to reach a valuation of 12.5 USD Billion by 2032.

    What was the market size of the Global Magic Wall Interactive Surfaces Market in 2023?

    In 2023, the Global Magic Wall Interactive Surfaces Market was valued at 5.92 USD Billion.

    What is the expected compound annual growth rate (CAGR) for the Global Magic Wall Interactive Surfaces Market from 2024 to 2032?

    The market is expected to grow at a CAGR of 8.65% from 2024 to 2032.

    Which region holds the largest market share for Global Magic Wall Interactive Surfaces in 2023?

    North America held the largest market share, valued at 2.15 USD Billion in 2023.

    How much is the Advertising segment of the Global Magic Wall Interactive Surfaces Market valued in 2032?

    The Advertising segment is projected to be valued at 2.45 USD Billion in 2032.

    What will be the market size for the Education application within the Global Magic Wall Interactive Surfaces Market in 2032?

    The Education application is expected to reach a market size of 3.1 USD Billion by 2032.

    Who are some of the key players in the Global Magic Wall Interactive Surfaces Market?

    Key players include LG Electronics, Panasonic, Cisco Systems, and Samsung Electronics, among others.

    What is the expected market size for the Entertainment segment by 2032?

    The Entertainment segment is expected to be valued at 3.7 USD Billion in 2032.

    What is the projected market size for the Healthcare application of the Global Magic Wall Interactive Surfaces Market in 2032?

    The Healthcare application is projected to reach 2.25 USD Billion in market size by 2032.

    How is the market for Global Magic Wall Interactive Surfaces expected to grow in the APAC region by 2032?

    The APAC region is expected to see a market size of 3.1 USD Billion by 2032.

    1. 'Table
    2. of Contents
    3. EXECUTIVE SUMMARY
      1. Market
    4. Overview
      1. Key Findings
      2. Market Segmentation
      3. Competitive Landscape
    5. Challenges and Opportunities
      1. Future Outlook
    6. MARKET INTRODUCTION
      1. Definition
      2. Scope of the study
        1. Research
    7. Objective
      1. Assumption
        1. Limitations
    8. RESEARCH METHODOLOGY
    9. Overview
      1. Data Mining
      2. Secondary Research
      3. Primary Research
    10. Primary Interviews and Information Gathering Process
      1. Breakdown of Primary Respondents
      2. Forecasting Model
      3. Market Size Estimation
        1. Bottom-Up Approach
    11. Top-Down Approach
      1. Data Triangulation
      2. Validation
    12. MARKET DYNAMICS
      1. Overview
      2. Drivers
      3. Restraints
      4. Opportunities
    13. MARKET FACTOR ANALYSIS
      1. Value chain Analysis
    14. Porter''s Five Forces Analysis
      1. Bargaining Power of Suppliers
    15. Bargaining Power of Buyers
      1. Threat of New Entrants
        1. Threat
    16. of Substitutes
      1. Intensity of Rivalry
      2. COVID-19 Impact Analysis
        1. Market Impact Analysis
        2. Regional Impact
        3. Opportunity
    17. and Threat Analysis
    18. Magic Wall Interactive Surfaces Market,
    19. BY Application (USD Billion)
      1. Advertising
      2. Education
      3. Entertainment
      4. Retail
      5. Healthcare
    20. Magic Wall Interactive Surfaces Market,
    21. BY End Use (USD Billion)
      1. Commercial
      2. Residential
      3. Institutional
    22. Magic Wall Interactive Surfaces Market, BY Technology (USD Billion)
      1. Touch Technology
      2. Gesture Technology
      3. Projection Technology
    23. Magic Wall Interactive Surfaces Market, BY Component (USD Billion)
      1. Hardware
      2. Software
      3. Services
    24. Magic Wall Interactive Surfaces
    25. Market, BY Regional (USD Billion)
      1. North America
        1. US
        2. Canada
      2. Europe
        1. Germany
        2. UK
        3. France
        4. Russia
        5. Italy
        6. Spain
        7. Rest of Europe
      3. APAC
        1. China
        2. India
        3. Japan
        4. South Korea
        5. Malaysia
        6. Thailand
        7. Indonesia
        8. Rest of APAC
      4. South America
    26. Brazil
      1. Mexico
        1. Argentina
        2. Rest of South America
      2. MEA
        1. GCC Countries
        2. South Africa
    27. Rest of MEA
    28. Competitive Landscape
      1. Overview
      2. Competitive
    29. Analysis
      1. Market share Analysis
      2. Major Growth Strategy in the Magic
    30. Wall Interactive Surfaces Market
      1. Competitive Benchmarking
      2. Leading
    31. Players in Terms of Number of Developments in the Magic Wall Interactive Surfaces
    32. Market
      1. Key developments and growth strategies
        1. New Product Launch/Service
    33. Deployment
      1. Merger & Acquisitions
        1. Joint Ventures
    34. Major Players Financial Matrix
      1. Sales and Operating Income
        1. Major
    35. Players R&D Expenditure. 2023
    36. Company Profiles
      1. LG Electronics
        1. Financial Overview
        2. Products Offered
        3. Key
    37. Developments
      1. SWOT Analysis
        1. Key Strategies
    38. Panasonic
      1. Financial Overview
        1. Products Offered
        2. Key
    39. Developments
      1. SWOT Analysis
        1. Key Strategies
    40. Cisco Systems
      1. Financial Overview
        1. Products Offered
    41. Key Developments
      1. SWOT Analysis
        1. Key Strategies
    42. ViewSonic
      1. Financial Overview
        1. Products Offered
        2. Key
    43. Developments
      1. SWOT Analysis
        1. Key Strategies
    44. MMD Monitors
      1. Financial Overview
        1. Products Offered
    45. Key Developments
      1. SWOT Analysis
        1. Key Strategies
    46. Innolux Corporation
      1. Financial Overview
        1. Products Offered
    47. Key Developments
      1. SWOT Analysis
        1. Key Strategies
    48. Sharp Corporation
      1. Financial Overview
        1. Products Offered
    49. Key Developments
      1. SWOT Analysis
        1. Key Strategies
    50. MultiTouch
      1. Financial Overview
        1. Products Offered
    51. Key Developments
      1. SWOT Analysis
        1. Key Strategies
    52. Samsung Electronics
      1. Financial Overview
        1. Products Offered
    53. Key Developments
      1. SWOT Analysis
        1. Key Strategies
    54. NEC
      1. Financial Overview
        1. Products Offered
    55. Key Developments
      1. SWOT Analysis
        1. Key Strategies
    56. Obscura Digital
      1. Financial Overview
        1. Products Offered
    57. Key Developments
      1. SWOT Analysis
        1. Key Strategies
    58. Microsoft
      1. Financial Overview
        1. Products Offered
    59. Key Developments
      1. SWOT Analysis
        1. Key Strategies
    60. TouchJet
      1. Financial Overview
        1. Products Offered
    61. Key Developments
      1. SWOT Analysis
        1. Key Strategies
    62. Evoke Studio
      1. Financial Overview
        1. Products Offered
    63. Key Developments
      1. SWOT Analysis
        1. Key Strategies
    64. Sony
      1. Financial Overview
        1. Products Offered
    65. Key Developments
      1. SWOT Analysis
        1. Key Strategies
      2. References
      3. Related Reports
    66. LIST OF ASSUMPTIONS
    67. Market SIZE ESTIMATES & FORECAST, BY APPLICATION, 2019-2032 (USD Billions)
    68. North America Magic Wall Interactive Surfaces Market SIZE ESTIMATES & FORECAST,
    69. BY END USE, 2019-2032 (USD Billions)
    70. Surfaces Market SIZE ESTIMATES & FORECAST, BY TECHNOLOGY, 2019-2032 (USD Billions)
    71. & FORECAST, BY COMPONENT, 2019-2032 (USD Billions)
    72. Interactive Surfaces Market SIZE ESTIMATES & FORECAST, BY REGIONAL, 2019-2032
    73. (USD Billions)
    74. & FORECAST, BY APPLICATION, 2019-2032 (USD Billions)
    75. Surfaces Market SIZE ESTIMATES & FORECAST, BY END USE, 2019-2032 (USD Billions)
    76. FORECAST, BY TECHNOLOGY, 2019-2032 (USD Billions)
    77. Surfaces Market SIZE ESTIMATES & FORECAST, BY COMPONENT, 2019-2032 (USD Billions)
    78. FORECAST, BY REGIONAL, 2019-2032 (USD Billions)
    79. Surfaces Market SIZE ESTIMATES & FORECAST, BY APPLICATION, 2019-2032 (USD Billions)
    80. & FORECAST, BY END USE, 2019-2032 (USD Billions)
    81. Surfaces Market SIZE ESTIMATES & FORECAST, BY TECHNOLOGY, 2019-2032 (USD Billions)
    82. & FORECAST, BY COMPONENT, 2019-2032 (USD Billions)
    83. Surfaces Market SIZE ESTIMATES & FORECAST, BY REGIONAL, 2019-2032 (USD Billions)
    84. & FORECAST, BY APPLICATION, 2019-2032 (USD Billions)
    85. Surfaces Market SIZE ESTIMATES & FORECAST, BY END USE, 2019-2032 (USD Billions)
    86. & FORECAST, BY TECHNOLOGY, 2019-2032 (USD Billions)
    87. Surfaces Market SIZE ESTIMATES & FORECAST, BY COMPONENT, 2019-2032 (USD Billions)
    88. & FORECAST, BY REGIONAL, 2019-2032 (USD Billions)
    89. Surfaces Market SIZE ESTIMATES & FORECAST, BY APPLICATION, 2019-2032 (USD Billions)
    90. & FORECAST, BY END USE, 2019-2032 (USD Billions)
    91. Surfaces Market SIZE ESTIMATES & FORECAST, BY TECHNOLOGY, 2019-2032 (USD Billions)
    92. & FORECAST, BY COMPONENT, 2019-2032 (USD Billions)
    93. Surfaces Market SIZE ESTIMATES & FORECAST, BY REGIONAL, 2019-2032 (USD Billions)
    94. FORECAST, BY APPLICATION, 2019-2032 (USD Billions)
    95. Surfaces Market SIZE ESTIMATES & FORECAST, BY END USE, 2019-2032 (USD Billions)
    96. FORECAST, BY TECHNOLOGY, 2019-2032 (USD Billions)
    97. Surfaces Market SIZE ESTIMATES & FORECAST, BY COMPONENT, 2019-2032 (USD Billions)
    98. FORECAST, BY REGIONAL, 2019-2032 (USD Billions)
    99. Surfaces Market SIZE ESTIMATES & FORECAST, BY APPLICATION, 2019-2032 (USD Billions)
    100. & FORECAST, BY END USE, 2019-2032 (USD Billions)
    101. Surfaces Market SIZE ESTIMATES & FORECAST, BY TECHNOLOGY, 2019-2032 (USD Billions)
    102. & FORECAST, BY COMPONENT, 2019-2032 (USD Billions)
    103. Surfaces Market SIZE ESTIMATES & FORECAST, BY REGIONAL, 2019-2032 (USD Billions)
    104. & FORECAST, BY APPLICATION, 2019-2032 (USD Billions)
    105. Surfaces Market SIZE ESTIMATES & FORECAST, BY END USE, 2019-2032 (USD Billions)
    106. & FORECAST, BY TECHNOLOGY, 2019-2032 (USD Billions)
    107. Surfaces Market SIZE ESTIMATES & FORECAST, BY COMPONENT, 2019-2032 (USD Billions)
    108. & FORECAST, BY REGIONAL, 2019-2032 (USD Billions)
    109. Surfaces Market SIZE ESTIMATES & FORECAST, BY APPLICATION, 2019-2032 (USD Billions)
    110. FORECAST, BY END USE, 2019-2032 (USD Billions)
    111. Surfaces Market SIZE ESTIMATES & FORECAST, BY TECHNOLOGY, 2019-2032 (USD Billions)
    112. FORECAST, BY COMPONENT, 2019-2032 (USD Billions)
    113. Surfaces Market SIZE ESTIMATES & FORECAST, BY REGIONAL, 2019-2032 (USD Billions)
    114. FORECAST, BY APPLICATION, 2019-2032 (USD Billions)
    115. Surfaces Market SIZE ESTIMATES & FORECAST, BY END USE, 2019-2032 (USD Billions)
    116. FORECAST, BY TECHNOLOGY, 2019-2032 (USD Billions)
    117. Surfaces Market SIZE ESTIMATES & FORECAST, BY COMPONENT, 2019-2032 (USD Billions)
    118. FORECAST, BY REGIONAL, 2019-2032 (USD Billions)
    119. Wall Interactive Surfaces Market SIZE ESTIMATES & FORECAST, BY APPLICATION,
    120. 2032 (USD Billions)
    121. Surfaces Market SIZE ESTIMATES & FORECAST, BY END USE, 2019-2032 (USD Billions)
    122. & FORECAST, BY TECHNOLOGY, 2019-2032 (USD Billions)
    123. Wall Interactive Surfaces Market SIZE ESTIMATES & FORECAST, BY COMPONENT, 2019-2032
    124. (USD Billions)
    125. SIZE ESTIMATES & FORECAST, BY REGIONAL, 2019-2032 (USD Billions)
    126. APAC Magic Wall Interactive Surfaces Market SIZE ESTIMATES & FORECAST, BY
    127. APPLICATION, 2019-2032 (USD Billions)
    128. Surfaces Market SIZE ESTIMATES & FORECAST, BY END USE, 2019-2032 (USD Billions)
    129. FORECAST, BY TECHNOLOGY, 2019-2032 (USD Billions)
    130. Surfaces Market SIZE ESTIMATES & FORECAST, BY COMPONENT, 2019-2032 (USD Billions)
    131. FORECAST, BY REGIONAL, 2019-2032 (USD Billions)
    132. Surfaces Market SIZE ESTIMATES & FORECAST, BY APPLICATION, 2019-2032 (USD Billions)
    133. FORECAST, BY END USE, 2019-2032 (USD Billions)
    134. Surfaces Market SIZE ESTIMATES & FORECAST, BY TECHNOLOGY, 2019-2032 (USD Billions)
    135. FORECAST, BY COMPONENT, 2019-2032 (USD Billions)
    136. Surfaces Market SIZE ESTIMATES & FORECAST, BY REGIONAL, 2019-2032 (USD Billions)
    137. FORECAST, BY APPLICATION, 2019-2032 (USD Billions)
    138. Surfaces Market SIZE ESTIMATES & FORECAST, BY END USE, 2019-2032 (USD Billions)
    139. FORECAST, BY TECHNOLOGY, 2019-2032 (USD Billions)
    140. Surfaces Market SIZE ESTIMATES & FORECAST, BY COMPONENT, 2019-2032 (USD Billions)
    141. FORECAST, BY REGIONAL, 2019-2032 (USD Billions)
    142. Surfaces Market SIZE ESTIMATES & FORECAST, BY APPLICATION, 2019-2032 (USD Billions)
    143. FORECAST, BY END USE, 2019-2032 (USD Billions)
    144. Surfaces Market SIZE ESTIMATES & FORECAST, BY TECHNOLOGY, 2019-2032 (USD Billions)
    145. FORECAST, BY COMPONENT, 2019-2032 (USD Billions)
    146. Surfaces Market SIZE ESTIMATES & FORECAST, BY REGIONAL, 2019-2032 (USD Billions)
    147. & FORECAST, BY APPLICATION, 2019-2032 (USD Billions)
    148. Interactive Surfaces Market SIZE ESTIMATES & FORECAST, BY END USE, 2019-2032
    149. (USD Billions)
    150. SIZE ESTIMATES & FORECAST, BY TECHNOLOGY, 2019-2032 (USD Billions)
    151. South Korea Magic Wall Interactive Surfaces Market SIZE ESTIMATES & FORECAST,
    152. BY COMPONENT, 2019-2032 (USD Billions)
    153. Surfaces Market SIZE ESTIMATES & FORECAST, BY REGIONAL, 2019-2032 (USD Billions)
    154. & FORECAST, BY APPLICATION, 2019-2032 (USD Billions)
    155. Interactive Surfaces Market SIZE ESTIMATES & FORECAST, BY END USE, 2019-2032
    156. (USD Billions)
    157. ESTIMATES & FORECAST, BY TECHNOLOGY, 2019-2032 (USD Billions)
    158. Malaysia Magic Wall Interactive Surfaces Market SIZE ESTIMATES & FORECAST, BY
    159. COMPONENT, 2019-2032 (USD Billions)
    160. Surfaces Market SIZE ESTIMATES & FORECAST, BY REGIONAL, 2019-2032 (USD Billions)
    161. & FORECAST, BY APPLICATION, 2019-2032 (USD Billions)
    162. Interactive Surfaces Market SIZE ESTIMATES & FORECAST, BY END USE, 2019-2032
    163. (USD Billions)
    164. ESTIMATES & FORECAST, BY TECHNOLOGY, 2019-2032 (USD Billions)
    165. Thailand Magic Wall Interactive Surfaces Market SIZE ESTIMATES & FORECAST, BY
    166. COMPONENT, 2019-2032 (USD Billions)
    167. Surfaces Market SIZE ESTIMATES & FORECAST, BY REGIONAL, 2019-2032 (USD Billions)
    168. & FORECAST, BY APPLICATION, 2019-2032 (USD Billions)
    169. Interactive Surfaces Market SIZE ESTIMATES & FORECAST, BY END USE, 2019-2032
    170. (USD Billions)
    171. ESTIMATES & FORECAST, BY TECHNOLOGY, 2019-2032 (USD Billions)
    172. Indonesia Magic Wall Interactive Surfaces Market SIZE ESTIMATES & FORECAST,
    173. BY COMPONENT, 2019-2032 (USD Billions)
    174. Surfaces Market SIZE ESTIMATES & FORECAST, BY REGIONAL, 2019-2032 (USD Billions)
    175. & FORECAST, BY APPLICATION, 2019-2032 (USD Billions)
    176. Interactive Surfaces Market SIZE ESTIMATES & FORECAST, BY END USE, 2019-2032
    177. (USD Billions)
    178. SIZE ESTIMATES & FORECAST, BY TECHNOLOGY, 2019-2032 (USD Billions)
    179. Rest of APAC Magic Wall Interactive Surfaces Market SIZE ESTIMATES & FORECAST,
    180. BY COMPONENT, 2019-2032 (USD Billions)
    181. Surfaces Market SIZE ESTIMATES & FORECAST, BY REGIONAL, 2019-2032 (USD Billions)
    182. & FORECAST, BY APPLICATION, 2019-2032 (USD Billions)
    183. Wall Interactive Surfaces Market SIZE ESTIMATES & FORECAST, BY END USE, 2019-2032
    184. (USD Billions)
    185. SIZE ESTIMATES & FORECAST, BY TECHNOLOGY, 2019-2032 (USD Billions)
    186. South America Magic Wall Interactive Surfaces Market SIZE ESTIMATES & FORECAST,
    187. BY COMPONENT, 2019-2032 (USD Billions)
    188. Surfaces Market SIZE ESTIMATES & FORECAST, BY REGIONAL, 2019-2032 (USD Billions)
    189. & FORECAST, BY APPLICATION, 2019-2032 (USD Billions)
    190. Surfaces Market SIZE ESTIMATES & FORECAST, BY END USE, 2019-2032 (USD Billions)
    191. & FORECAST, BY TECHNOLOGY, 2019-2032 (USD Billions)
    192. Surfaces Market SIZE ESTIMATES & FORECAST, BY COMPONENT, 2019-2032 (USD Billions)
    193. & FORECAST, BY REGIONAL, 2019-2032 (USD Billions)
    194. Surfaces Market SIZE ESTIMATES & FORECAST, BY APPLICATION, 2019-2032 (USD Billions)
    195. & FORECAST, BY END USE, 2019-2032 (USD Billions)
    196. Surfaces Market SIZE ESTIMATES & FORECAST, BY TECHNOLOGY, 2019-2032 (USD Billions)
    197. & FORECAST, BY COMPONENT, 2019-2032 (USD Billions)
    198. Surfaces Market SIZE ESTIMATES & FORECAST, BY REGIONAL, 2019-2032 (USD Billions)
    199. & FORECAST, BY APPLICATION, 2019-2032 (USD Billions)
    200. Interactive Surfaces Market SIZE ESTIMATES & FORECAST, BY END USE, 2019-2032
    201. (USD Billions)
    202. SIZE ESTIMATES & FORECAST, BY TECHNOLOGY, 2019-2032 (USD Billions)
    203. Argentina Magic Wall Interactive Surfaces Market SIZE ESTIMATES & FORECAST,
    204. BY COMPONENT, 2019-2032 (USD Billions)
    205. Surfaces Market SIZE ESTIMATES & FORECAST, BY REGIONAL, 2019-2032 (USD Billions)
    206. SIZE ESTIMATES & FORECAST, BY APPLICATION, 2019-2032 (USD Billions)
    207. Rest of South America Magic Wall Interactive Surfaces Market SIZE ESTIMATES
    208. & FORECAST, BY END USE, 2019-2032 (USD Billions)
    209. Magic Wall Interactive Surfaces Market SIZE ESTIMATES & FORECAST, BY TECHNOLOGY,
    210. 2032 (USD Billions)
    211. Surfaces Market SIZE ESTIMATES & FORECAST, BY COMPONENT, 2019-2032 (USD Billions)
    212. SIZE ESTIMATES & FORECAST, BY REGIONAL, 2019-2032 (USD Billions)
    213. MEA Magic Wall Interactive Surfaces Market SIZE ESTIMATES & FORECAST, BY
    214. APPLICATION, 2019-2032 (USD Billions)
    215. Surfaces Market SIZE ESTIMATES & FORECAST, BY END USE, 2019-2032 (USD Billions)
    216. FORECAST, BY TECHNOLOGY, 2019-2032 (USD Billions)
    217. Surfaces Market SIZE ESTIMATES & FORECAST, BY COMPONENT, 2019-2032 (USD Billions)
    218. FORECAST, BY REGIONAL, 2019-2032 (USD Billions)
    219. Wall Interactive Surfaces Market SIZE ESTIMATES & FORECAST, BY APPLICATION,
    220. 2032 (USD Billions)
    221. Surfaces Market SIZE ESTIMATES & FORECAST, BY END USE, 2019-2032 (USD Billions)
    222. & FORECAST, BY TECHNOLOGY, 2019-2032 (USD Billions)
    223. Wall Interactive Surfaces Market SIZE ESTIMATES & FORECAST, BY COMPONENT, 2019-2032
    224. (USD Billions)
    225. SIZE ESTIMATES & FORECAST, BY REGIONAL, 2019-2032 (USD Billions)
    226. South Africa Magic Wall Interactive Surfaces Market SIZE ESTIMATES & FORECAST,
    227. BY APPLICATION, 2019-2032 (USD Billions)
    228. Wall Interactive Surfaces Market SIZE ESTIMATES & FORECAST, BY END USE, 2019-2032
    229. (USD Billions)
    230. SIZE ESTIMATES & FORECAST, BY TECHNOLOGY, 2019-2032 (USD Billions)
    231. South Africa Magic Wall Interactive Surfaces Market SIZE ESTIMATES & FORECAST,
    232. BY COMPONENT, 2019-2032 (USD Billions)
    233. Surfaces Market SIZE ESTIMATES & FORECAST, BY REGIONAL, 2019-2032 (USD Billions)
    234. & FORECAST, BY APPLICATION, 2019-2032 (USD Billions)
    235. Interactive Surfaces Market SIZE ESTIMATES & FORECAST, BY END USE, 2019-2032
    236. (USD Billions)
    237. SIZE ESTIMATES & FORECAST, BY TECHNOLOGY, 2019-2032 (USD Billions)
    238. Rest of MEA Magic Wall Interactive Surfaces Market SIZE ESTIMATES & FORECAST,
    239. BY COMPONENT, 2019-2032 (USD Billions)
    240. Surfaces Market SIZE ESTIMATES & FORECAST, BY REGIONAL, 2019-2032 (USD Billions)
    241. ACQUISITION/PARTNERSHIP
    242. NORTH AMERICA MAGIC WALL INTERACTIVE SURFACES MARKET ANALYSIS
    243. US MAGIC WALL INTERACTIVE SURFACES MARKET ANALYSIS BY APPLICATION
    244. US MAGIC WALL INTERACTIVE SURFACES MARKET ANALYSIS BY END USE
    245. US MAGIC WALL INTERACTIVE SURFACES MARKET ANALYSIS BY TECHNOLOGY
    246. US MAGIC WALL INTERACTIVE SURFACES MARKET ANALYSIS BY COMPONENT
    247. US MAGIC WALL INTERACTIVE SURFACES MARKET ANALYSIS BY REGIONAL
    248. CANADA MAGIC WALL INTERACTIVE SURFACES MARKET ANALYSIS BY APPLICATION
    249. CANADA MAGIC WALL INTERACTIVE SURFACES MARKET ANALYSIS BY END USE
    250. CANADA MAGIC WALL INTERACTIVE SURFACES MARKET ANALYSIS BY TECHNOLOGY
    251. CANADA MAGIC WALL INTERACTIVE SURFACES MARKET ANALYSIS BY COMPONENT
    252. CANADA MAGIC WALL INTERACTIVE SURFACES MARKET ANALYSIS BY REGIONAL
    253. EUROPE MAGIC WALL INTERACTIVE SURFACES MARKET ANALYSIS
    254. INTERACTIVE SURFACES MARKET ANALYSIS BY APPLICATION
    255. INTERACTIVE SURFACES MARKET ANALYSIS BY END USE
    256. INTERACTIVE SURFACES MARKET ANALYSIS BY TECHNOLOGY
    257. INTERACTIVE SURFACES MARKET ANALYSIS BY COMPONENT
    258. INTERACTIVE SURFACES MARKET ANALYSIS BY REGIONAL
    259. SURFACES MARKET ANALYSIS BY APPLICATION
    260. SURFACES MARKET ANALYSIS BY END USE
    261. SURFACES MARKET ANALYSIS BY TECHNOLOGY
    262. SURFACES MARKET ANALYSIS BY COMPONENT
    263. SURFACES MARKET ANALYSIS BY REGIONAL
    264. SURFACES MARKET ANALYSIS BY APPLICATION
    265. SURFACES MARKET ANALYSIS BY END USE
    266. SURFACES MARKET ANALYSIS BY TECHNOLOGY
    267. SURFACES MARKET ANALYSIS BY COMPONENT
    268. SURFACES MARKET ANALYSIS BY REGIONAL
    269. SURFACES MARKET ANALYSIS BY APPLICATION
    270. SURFACES MARKET ANALYSIS BY END USE
    271. SURFACES MARKET ANALYSIS BY TECHNOLOGY
    272. SURFACES MARKET ANALYSIS BY COMPONENT
    273. SURFACES MARKET ANALYSIS BY REGIONAL
    274. SURFACES MARKET ANALYSIS BY APPLICATION
    275. SURFACES MARKET ANALYSIS BY END USE
    276. SURFACES MARKET ANALYSIS BY TECHNOLOGY
    277. SURFACES MARKET ANALYSIS BY COMPONENT
    278. SURFACES MARKET ANALYSIS BY REGIONAL
    279. SURFACES MARKET ANALYSIS BY APPLICATION
    280. SURFACES MARKET ANALYSIS BY END USE
    281. SURFACES MARKET ANALYSIS BY TECHNOLOGY
    282. SURFACES MARKET ANALYSIS BY COMPONENT
    283. SURFACES MARKET ANALYSIS BY REGIONAL
    284. INTERACTIVE SURFACES MARKET ANALYSIS BY APPLICATION
    285. WALL INTERACTIVE SURFACES MARKET ANALYSIS BY END USE
    286. WALL INTERACTIVE SURFACES MARKET ANALYSIS BY TECHNOLOGY
    287. WALL INTERACTIVE SURFACES MARKET ANALYSIS BY COMPONENT
    288. WALL INTERACTIVE SURFACES MARKET ANALYSIS BY REGIONAL
    289. SURFACES MARKET ANALYSIS
    290. MARKET ANALYSIS BY APPLICATION
    291. MARKET ANALYSIS BY END USE
    292. MARKET ANALYSIS BY TECHNOLOGY
    293. MARKET ANALYSIS BY COMPONENT
    294. MARKET ANALYSIS BY REGIONAL
    295. MARKET ANALYSIS BY APPLICATION
    296. MARKET ANALYSIS BY END USE
    297. MARKET ANALYSIS BY TECHNOLOGY
    298. MARKET ANALYSIS BY COMPONENT
    299. MARKET ANALYSIS BY REGIONAL
    300. MARKET ANALYSIS BY APPLICATION
    301. MARKET ANALYSIS BY END USE
    302. MARKET ANALYSIS BY TECHNOLOGY
    303. MARKET ANALYSIS BY COMPONENT
    304. MARKET ANALYSIS BY REGIONAL
    305. MARKET ANALYSIS BY APPLICATION
    306. MARKET ANALYSIS BY END USE
    307. MARKET ANALYSIS BY TECHNOLOGY
    308. MARKET ANALYSIS BY COMPONENT
    309. MARKET ANALYSIS BY REGIONAL
    310. MARKET ANALYSIS BY APPLICATION
    311. MARKET ANALYSIS BY END USE
    312. MARKET ANALYSIS BY TECHNOLOGY
    313. MARKET ANALYSIS BY COMPONENT
    314. MARKET ANALYSIS BY REGIONAL
    315. MARKET ANALYSIS BY APPLICATION
    316. MARKET ANALYSIS BY END USE
    317. MARKET ANALYSIS BY TECHNOLOGY
    318. MARKET ANALYSIS BY COMPONENT
    319. MARKET ANALYSIS BY REGIONAL
    320. MARKET ANALYSIS BY APPLICATION
    321. MARKET ANALYSIS BY END USE
    322. MARKET ANALYSIS BY TECHNOLOGY
    323. MARKET ANALYSIS BY COMPONENT
    324. MARKET ANALYSIS BY REGIONAL
    325. MARKET ANALYSIS BY APPLICATION
    326. MARKET ANALYSIS BY END USE
    327. MARKET ANALYSIS BY TECHNOLOGY
    328. MARKET ANALYSIS BY COMPONENT
    329. MARKET ANALYSIS BY REGIONAL
    330. SURFACES MARKET ANALYSIS
    331. MARKET ANALYSIS BY APPLICATION
    332. MARKET ANALYSIS BY END USE
    333. MARKET ANALYSIS BY TECHNOLOGY
    334. MARKET ANALYSIS BY COMPONENT
    335. MARKET ANALYSIS BY REGIONAL
    336. MARKET ANALYSIS BY APPLICATION
    337. MARKET ANALYSIS BY END USE
    338. MARKET ANALYSIS BY TECHNOLOGY
    339. MARKET ANALYSIS BY COMPONENT
    340. MARKET ANALYSIS BY REGIONAL
    341. MARKET ANALYSIS BY APPLICATION
    342. MARKET ANALYSIS BY END USE
    343. MARKET ANALYSIS BY TECHNOLOGY
    344. MARKET ANALYSIS BY COMPONENT
    345. MARKET ANALYSIS BY REGIONAL
    346. SURFACES MARKET ANALYSIS BY APPLICATION
    347. WALL INTERACTIVE SURFACES MARKET ANALYSIS BY END USE
    348. MAGIC WALL INTERACTIVE SURFACES MARKET ANALYSIS BY TECHNOLOGY
    349. REST OF SOUTH AMERICA MAGIC WALL INTERACTIVE SURFACES MARKET ANALYSIS BY COMPONENT
    350. ANALYSIS BY REGIONAL
    351. BY APPLICATION
    352. ANALYSIS BY END USE
    353. ANALYSIS BY TECHNOLOGY
    354. SURFACES MARKET ANALYSIS BY COMPONENT
    355. INTERACTIVE SURFACES MARKET ANALYSIS BY REGIONAL
    356. WALL INTERACTIVE SURFACES MARKET ANALYSIS BY APPLICATION
    357. WALL INTERACTIVE SURFACES MARKET ANALYSIS BY END USE
    358. WALL INTERACTIVE SURFACES MARKET ANALYSIS BY TECHNOLOGY
    359. WALL INTERACTIVE SURFACES MARKET ANALYSIS BY COMPONENT
    360. WALL INTERACTIVE SURFACES MARKET ANALYSIS BY REGIONAL
    361. WALL INTERACTIVE SURFACES MARKET ANALYSIS BY APPLICATION
    362. WALL INTERACTIVE SURFACES MARKET ANALYSIS BY END USE
    363. WALL INTERACTIVE SURFACES MARKET ANALYSIS BY TECHNOLOGY
    364. WALL INTERACTIVE SURFACES MARKET ANALYSIS BY COMPONENT
    365. WALL INTERACTIVE SURFACES MARKET ANALYSIS BY REGIONAL
    366. OF MAGIC WALL INTERACTIVE SURFACES MARKET
    367. MRFR
    368. DRIVERS IMPACT ANALYSIS: MAGIC WALL INTERACTIVE SURFACES MARKET
    369. RESTRAINTS IMPACT ANALYSIS: MAGIC WALL INTERACTIVE SURFACES MARKET
    370. SUPPLY / VALUE CHAIN: MAGIC WALL INTERACTIVE SURFACES MARKET
    371. MAGIC WALL INTERACTIVE SURFACES MARKET, BY APPLICATION, 2024 (% SHARE)
    372. MAGIC WALL INTERACTIVE SURFACES MARKET, BY APPLICATION, 2019 TO 2032 (USD Billions)
    373. SHARE)
    374. (USD Billions)
    375. (% SHARE)
    376. TO 2032 (USD Billions)
    377. BY COMPONENT, 2024 (% SHARE)
    378. BY COMPONENT, 2019 TO 2032 (USD Billions)
    379. SURFACES MARKET, BY REGIONAL, 2024 (% SHARE)
    380. SURFACES MARKET, BY REGIONAL, 2019 TO 2032 (USD Billions)
    381. COMPETITORS '

    Magic Wall Interactive Surfaces Market Segmentation


    • Magic Wall Interactive Surfaces Market By Application (USD Billion, 2019-2032)

      • Advertising

      • Education

      • Entertainment

      • Retail

      • Healthcare

    • Magic Wall Interactive Surfaces Market By End Use (USD Billion, 2019-2032)

      • Commercial

      • Residential

      • Institutional

    • Magic Wall Interactive Surfaces Market By Technology (USD Billion, 2019-2032)

      • Touch Technology

      • Gesture Technology

      • Projection Technology

    • Magic Wall Interactive Surfaces Market By Component (USD Billion, 2019-2032)

      • Hardware

      • Software

      • Services

    • Magic Wall Interactive Surfaces Market By Regional (USD Billion, 2019-2032)

      • North America

      • Europe

      • South America

      • Asia Pacific

      • Middle East and Africa

    Magic Wall Interactive Surfaces Market Regional Outlook (USD Billion, 2019-2032)


    • North America Outlook (USD Billion, 2019-2032)

      • North America Magic Wall Interactive Surfaces Market by Application Type

        • Advertising

        • Education

        • Entertainment

        • Retail

        • Healthcare

      • North America Magic Wall Interactive Surfaces Market by End Use Type

        • Commercial

        • Residential

        • Institutional

      • North America Magic Wall Interactive Surfaces Market by Technology Type

        • Touch Technology

        • Gesture Technology

        • Projection Technology

      • North America Magic Wall Interactive Surfaces Market by Component Type

        • Hardware

        • Software

        • Services

      • North America Magic Wall Interactive Surfaces Market by Regional Type

        • US

        • Canada

      • US Outlook (USD Billion, 2019-2032)

      • US Magic Wall Interactive Surfaces Market by Application Type

        • Advertising

        • Education

        • Entertainment

        • Retail

        • Healthcare

      • US Magic Wall Interactive Surfaces Market by End Use Type

        • Commercial

        • Residential

        • Institutional

      • US Magic Wall Interactive Surfaces Market by Technology Type

        • Touch Technology

        • Gesture Technology

        • Projection Technology

      • US Magic Wall Interactive Surfaces Market by Component Type

        • Hardware

        • Software

        • Services

      • CANADA Outlook (USD Billion, 2019-2032)

      • CANADA Magic Wall Interactive Surfaces Market by Application Type

        • Advertising

        • Education

        • Entertainment

        • Retail

        • Healthcare

      • CANADA Magic Wall Interactive Surfaces Market by End Use Type

        • Commercial

        • Residential

        • Institutional

      • CANADA Magic Wall Interactive Surfaces Market by Technology Type

        • Touch Technology

        • Gesture Technology

        • Projection Technology

      • CANADA Magic Wall Interactive Surfaces Market by Component Type

        • Hardware

        • Software

        • Services

    • Europe Outlook (USD Billion, 2019-2032)

      • Europe Magic Wall Interactive Surfaces Market by Application Type

        • Advertising

        • Education

        • Entertainment

        • Retail

        • Healthcare

      • Europe Magic Wall Interactive Surfaces Market by End Use Type

        • Commercial

        • Residential

        • Institutional

      • Europe Magic Wall Interactive Surfaces Market by Technology Type

        • Touch Technology

        • Gesture Technology

        • Projection Technology

      • Europe Magic Wall Interactive Surfaces Market by Component Type

        • Hardware

        • Software

        • Services

      • Europe Magic Wall Interactive Surfaces Market by Regional Type

        • Germany

        • UK

        • France

        • Russia

        • Italy

        • Spain

        • Rest of Europe

      • GERMANY Outlook (USD Billion, 2019-2032)

      • GERMANY Magic Wall Interactive Surfaces Market by Application Type

        • Advertising

        • Education

        • Entertainment

        • Retail

        • Healthcare

      • GERMANY Magic Wall Interactive Surfaces Market by End Use Type

        • Commercial

        • Residential

        • Institutional

      • GERMANY Magic Wall Interactive Surfaces Market by Technology Type

        • Touch Technology

        • Gesture Technology

        • Projection Technology

      • GERMANY Magic Wall Interactive Surfaces Market by Component Type

        • Hardware

        • Software

        • Services

      • UK Outlook (USD Billion, 2019-2032)

      • UK Magic Wall Interactive Surfaces Market by Application Type

        • Advertising

        • Education

        • Entertainment

        • Retail

        • Healthcare

      • UK Magic Wall Interactive Surfaces Market by End Use Type

        • Commercial

        • Residential

        • Institutional

      • UK Magic Wall Interactive Surfaces Market by Technology Type

        • Touch Technology

        • Gesture Technology

        • Projection Technology

      • UK Magic Wall Interactive Surfaces Market by Component Type

        • Hardware

        • Software

        • Services

      • FRANCE Outlook (USD Billion, 2019-2032)

      • FRANCE Magic Wall Interactive Surfaces Market by Application Type

        • Advertising

        • Education

        • Entertainment

        • Retail

        • Healthcare

      • FRANCE Magic Wall Interactive Surfaces Market by End Use Type

        • Commercial

        • Residential

        • Institutional

      • FRANCE Magic Wall Interactive Surfaces Market by Technology Type

        • Touch Technology

        • Gesture Technology

        • Projection Technology

      • FRANCE Magic Wall Interactive Surfaces Market by Component Type

        • Hardware

        • Software

        • Services

      • RUSSIA Outlook (USD Billion, 2019-2032)

      • RUSSIA Magic Wall Interactive Surfaces Market by Application Type

        • Advertising

        • Education

        • Entertainment

        • Retail

        • Healthcare

      • RUSSIA Magic Wall Interactive Surfaces Market by End Use Type

        • Commercial

        • Residential

        • Institutional

      • RUSSIA Magic Wall Interactive Surfaces Market by Technology Type

        • Touch Technology

        • Gesture Technology

        • Projection Technology

      • RUSSIA Magic Wall Interactive Surfaces Market by Component Type

        • Hardware

        • Software

        • Services

      • ITALY Outlook (USD Billion, 2019-2032)

      • ITALY Magic Wall Interactive Surfaces Market by Application Type

        • Advertising

        • Education

        • Entertainment

        • Retail

        • Healthcare

      • ITALY Magic Wall Interactive Surfaces Market by End Use Type

        • Commercial

        • Residential

        • Institutional

      • ITALY Magic Wall Interactive Surfaces Market by Technology Type

        • Touch Technology

        • Gesture Technology

        • Projection Technology

      • ITALY Magic Wall Interactive Surfaces Market by Component Type

        • Hardware

        • Software

        • Services

      • SPAIN Outlook (USD Billion, 2019-2032)

      • SPAIN Magic Wall Interactive Surfaces Market by Application Type

        • Advertising

        • Education

        • Entertainment

        • Retail

        • Healthcare

      • SPAIN Magic Wall Interactive Surfaces Market by End Use Type

        • Commercial

        • Residential

        • Institutional

      • SPAIN Magic Wall Interactive Surfaces Market by Technology Type

        • Touch Technology

        • Gesture Technology

        • Projection Technology

      • SPAIN Magic Wall Interactive Surfaces Market by Component Type

        • Hardware

        • Software

        • Services

      • REST OF EUROPE Outlook (USD Billion, 2019-2032)

      • REST OF EUROPE Magic Wall Interactive Surfaces Market by Application Type

        • Advertising

        • Education

        • Entertainment

        • Retail

        • Healthcare

      • REST OF EUROPE Magic Wall Interactive Surfaces Market by End Use Type

        • Commercial

        • Residential

        • Institutional

      • REST OF EUROPE Magic Wall Interactive Surfaces Market by Technology Type

        • Touch Technology

        • Gesture Technology

        • Projection Technology

      • REST OF EUROPE Magic Wall Interactive Surfaces Market by Component Type

        • Hardware

        • Software

        • Services

    • APAC Outlook (USD Billion, 2019-2032)

      • APAC Magic Wall Interactive Surfaces Market by Application Type

        • Advertising

        • Education

        • Entertainment

        • Retail

        • Healthcare

      • APAC Magic Wall Interactive Surfaces Market by End Use Type

        • Commercial

        • Residential

        • Institutional

      • APAC Magic Wall Interactive Surfaces Market by Technology Type

        • Touch Technology

        • Gesture Technology

        • Projection Technology

      • APAC Magic Wall Interactive Surfaces Market by Component Type

        • Hardware

        • Software

        • Services

      • APAC Magic Wall Interactive Surfaces Market by Regional Type

        • China

        • India

        • Japan

        • South Korea

        • Malaysia

        • Thailand

        • Indonesia

        • Rest of APAC

      • CHINA Outlook (USD Billion, 2019-2032)

      • CHINA Magic Wall Interactive Surfaces Market by Application Type

        • Advertising

        • Education

        • Entertainment

        • Retail

        • Healthcare

      • CHINA Magic Wall Interactive Surfaces Market by End Use Type

        • Commercial

        • Residential

        • Institutional

      • CHINA Magic Wall Interactive Surfaces Market by Technology Type

        • Touch Technology

        • Gesture Technology

        • Projection Technology

      • CHINA Magic Wall Interactive Surfaces Market by Component Type

        • Hardware

        • Software

        • Services

      • INDIA Outlook (USD Billion, 2019-2032)

      • INDIA Magic Wall Interactive Surfaces Market by Application Type

        • Advertising

        • Education

        • Entertainment

        • Retail

        • Healthcare

      • INDIA Magic Wall Interactive Surfaces Market by End Use Type

        • Commercial

        • Residential

        • Institutional

      • INDIA Magic Wall Interactive Surfaces Market by Technology Type

        • Touch Technology

        • Gesture Technology

        • Projection Technology

      • INDIA Magic Wall Interactive Surfaces Market by Component Type

        • Hardware

        • Software

        • Services

      • JAPAN Outlook (USD Billion, 2019-2032)

      • JAPAN Magic Wall Interactive Surfaces Market by Application Type

        • Advertising

        • Education

        • Entertainment

        • Retail

        • Healthcare

      • JAPAN Magic Wall Interactive Surfaces Market by End Use Type

        • Commercial

        • Residential

        • Institutional

      • JAPAN Magic Wall Interactive Surfaces Market by Technology Type

        • Touch Technology

        • Gesture Technology

        • Projection Technology

      • JAPAN Magic Wall Interactive Surfaces Market by Component Type

        • Hardware

        • Software

        • Services

      • SOUTH KOREA Outlook (USD Billion, 2019-2032)

      • SOUTH KOREA Magic Wall Interactive Surfaces Market by Application Type

        • Advertising

        • Education

        • Entertainment

        • Retail

        • Healthcare

      • SOUTH KOREA Magic Wall Interactive Surfaces Market by End Use Type

        • Commercial

        • Residential

        • Institutional

      • SOUTH KOREA Magic Wall Interactive Surfaces Market by Technology Type

        • Touch Technology

        • Gesture Technology

        • Projection Technology

      • SOUTH KOREA Magic Wall Interactive Surfaces Market by Component Type

        • Hardware

        • Software

        • Services

      • MALAYSIA Outlook (USD Billion, 2019-2032)

      • MALAYSIA Magic Wall Interactive Surfaces Market by Application Type

        • Advertising

        • Education

        • Entertainment

        • Retail

        • Healthcare

      • MALAYSIA Magic Wall Interactive Surfaces Market by End Use Type

        • Commercial

        • Residential

        • Institutional

      • MALAYSIA Magic Wall Interactive Surfaces Market by Technology Type

        • Touch Technology

        • Gesture Technology

        • Projection Technology

      • MALAYSIA Magic Wall Interactive Surfaces Market by Component Type

        • Hardware

        • Software

        • Services

      • THAILAND Outlook (USD Billion, 2019-2032)

      • THAILAND Magic Wall Interactive Surfaces Market by Application Type

        • Advertising

        • Education

        • Entertainment

        • Retail

        • Healthcare

      • THAILAND Magic Wall Interactive Surfaces Market by End Use Type

        • Commercial

        • Residential

        • Institutional

      • THAILAND Magic Wall Interactive Surfaces Market by Technology Type

        • Touch Technology

        • Gesture Technology

        • Projection Technology

      • THAILAND Magic Wall Interactive Surfaces Market by Component Type

        • Hardware

        • Software

        • Services

      • INDONESIA Outlook (USD Billion, 2019-2032)

      • INDONESIA Magic Wall Interactive Surfaces Market by Application Type

        • Advertising

        • Education

        • Entertainment

        • Retail

        • Healthcare

      • INDONESIA Magic Wall Interactive Surfaces Market by End Use Type

        • Commercial

        • Residential

        • Institutional

      • INDONESIA Magic Wall Interactive Surfaces Market by Technology Type

        • Touch Technology

        • Gesture Technology

        • Projection Technology

      • INDONESIA Magic Wall Interactive Surfaces Market by Component Type

        • Hardware

        • Software

        • Services

      • REST OF APAC Outlook (USD Billion, 2019-2032)

      • REST OF APAC Magic Wall Interactive Surfaces Market by Application Type

        • Advertising

        • Education

        • Entertainment

        • Retail

        • Healthcare

      • REST OF APAC Magic Wall Interactive Surfaces Market by End Use Type

        • Commercial

        • Residential

        • Institutional

      • REST OF APAC Magic Wall Interactive Surfaces Market by Technology Type

        • Touch Technology

        • Gesture Technology

        • Projection Technology

      • REST OF APAC Magic Wall Interactive Surfaces Market by Component Type

        • Hardware

        • Software

        • Services

    • South America Outlook (USD Billion, 2019-2032)

      • South America Magic Wall Interactive Surfaces Market by Application Type

        • Advertising

        • Education

        • Entertainment

        • Retail

        • Healthcare

      • South America Magic Wall Interactive Surfaces Market by End Use Type

        • Commercial

        • Residential

        • Institutional

      • South America Magic Wall Interactive Surfaces Market by Technology Type

        • Touch Technology

        • Gesture Technology

        • Projection Technology

      • South America Magic Wall Interactive Surfaces Market by Component Type

        • Hardware

        • Software

        • Services

      • South America Magic Wall Interactive Surfaces Market by Regional Type

        • Brazil

        • Mexico

        • Argentina

        • Rest of South America

      • BRAZIL Outlook (USD Billion, 2019-2032)

      • BRAZIL Magic Wall Interactive Surfaces Market by Application Type

        • Advertising

        • Education

        • Entertainment

        • Retail

        • Healthcare

      • BRAZIL Magic Wall Interactive Surfaces Market by End Use Type

        • Commercial

        • Residential

        • Institutional

      • BRAZIL Magic Wall Interactive Surfaces Market by Technology Type

        • Touch Technology

        • Gesture Technology

        • Projection Technology

      • BRAZIL Magic Wall Interactive Surfaces Market by Component Type

        • Hardware

        • Software

        • Services

      • MEXICO Outlook (USD Billion, 2019-2032)

      • MEXICO Magic Wall Interactive Surfaces Market by Application Type

        • Advertising

        • Education

        • Entertainment

        • Retail

        • Healthcare

      • MEXICO Magic Wall Interactive Surfaces Market by End Use Type

        • Commercial

        • Residential

        • Institutional

      • MEXICO Magic Wall Interactive Surfaces Market by Technology Type

        • Touch Technology

        • Gesture Technology

        • Projection Technology

      • MEXICO Magic Wall Interactive Surfaces Market by Component Type

        • Hardware

        • Software

        • Services

      • ARGENTINA Outlook (USD Billion, 2019-2032)

      • ARGENTINA Magic Wall Interactive Surfaces Market by Application Type

        • Advertising

        • Education

        • Entertainment

        • Retail

        • Healthcare

      • ARGENTINA Magic Wall Interactive Surfaces Market by End Use Type

        • Commercial

        • Residential

        • Institutional

      • ARGENTINA Magic Wall Interactive Surfaces Market by Technology Type

        • Touch Technology

        • Gesture Technology

        • Projection Technology

      • ARGENTINA Magic Wall Interactive Surfaces Market by Component Type

        • Hardware

        • Software

        • Services

      • REST OF SOUTH AMERICA Outlook (USD Billion, 2019-2032)

      • REST OF SOUTH AMERICA Magic Wall Interactive Surfaces Market by Application Type

        • Advertising

        • Education

        • Entertainment

        • Retail

        • Healthcare

      • REST OF SOUTH AMERICA Magic Wall Interactive Surfaces Market by End Use Type

        • Commercial

        • Residential

        • Institutional

      • REST OF SOUTH AMERICA Magic Wall Interactive Surfaces Market by Technology Type

        • Touch Technology

        • Gesture Technology

        • Projection Technology

      • REST OF SOUTH AMERICA Magic Wall Interactive Surfaces Market by Component Type

        • Hardware

        • Software

        • Services

    • MEA Outlook (USD Billion, 2019-2032)

      • MEA Magic Wall Interactive Surfaces Market by Application Type

        • Advertising

        • Education

        • Entertainment

        • Retail

        • Healthcare

      • MEA Magic Wall Interactive Surfaces Market by End Use Type

        • Commercial

        • Residential

        • Institutional

      • MEA Magic Wall Interactive Surfaces Market by Technology Type

        • Touch Technology

        • Gesture Technology

        • Projection Technology

      • MEA Magic Wall Interactive Surfaces Market by Component Type

        • Hardware

        • Software

        • Services

      • MEA Magic Wall Interactive Surfaces Market by Regional Type

        • GCC Countries

        • South Africa

        • Rest of MEA

      • GCC COUNTRIES Outlook (USD Billion, 2019-2032)

      • GCC COUNTRIES Magic Wall Interactive Surfaces Market by Application Type

        • Advertising

        • Education

        • Entertainment

        • Retail

        • Healthcare

      • GCC COUNTRIES Magic Wall Interactive Surfaces Market by End Use Type

        • Commercial

        • Residential

        • Institutional

      • GCC COUNTRIES Magic Wall Interactive Surfaces Market by Technology Type

        • Touch Technology

        • Gesture Technology

        • Projection Technology

      • GCC COUNTRIES Magic Wall Interactive Surfaces Market by Component Type

        • Hardware

        • Software

        • Services

      • SOUTH AFRICA Outlook (USD Billion, 2019-2032)

      • SOUTH AFRICA Magic Wall Interactive Surfaces Market by Application Type

        • Advertising

        • Education

        • Entertainment

        • Retail

        • Healthcare

      • SOUTH AFRICA Magic Wall Interactive Surfaces Market by End Use Type

        • Commercial

        • Residential

        • Institutional

      • SOUTH AFRICA Magic Wall Interactive Surfaces Market by Technology Type

        • Touch Technology

        • Gesture Technology

        • Projection Technology

      • SOUTH AFRICA Magic Wall Interactive Surfaces Market by Component Type

        • Hardware

        • Software

        • Services

      • REST OF MEA Outlook (USD Billion, 2019-2032)

      • REST OF MEA Magic Wall Interactive Surfaces Market by Application Type

        • Advertising

        • Education

        • Entertainment

        • Retail

        • Healthcare

      • REST OF MEA Magic Wall Interactive Surfaces Market by End Use Type

        • Commercial

        • Residential

        • Institutional

      • REST OF MEA Magic Wall Interactive Surfaces Market by Technology Type

        • Touch Technology

        • Gesture Technology

        • Projection Technology

      • REST OF MEA Magic Wall Interactive Surfaces Market by Component Type

        • Hardware

        • Software

        • Services

    Magic Wall Interactive Surfaces Market Research Report - Forecast to 2032 Infographic
    Free Sample Request

    Kindly complete the form below to receive a free sample of this Report

    Customer Strories

    “I am very pleased with how market segments have been defined in a relevant way for my purposes (such as "Portable Freezers & refrigerators" and "last-mile"). In general the report is well structured. Thanks very much for your efforts.”

    Victoria Milne Founder
    Case Study

    Chemicals and Materials