×
  • Cat-intel
  • MedIntelliX
  • Resources
  • About Us
  • Hero Background
    English
    Chinese
    French
    Japanese
    Korean
    German
    Spanish

    Isopropyl Alcohol Market Share

    ID: MRFR/CnM/0572-HCR
    147 Pages
    Chitranshi Jaiswal
    October 2025

    Isopropyl Alcohol Market Research Report Information By Production Method (Indirect Hydration and Direct Hydration), Application (Solvents, Cleaning Agent, Intermediate, Disinfectants and others), End-Use Industry (Cosmetics & Personal Care, Pharmaceuticals, Paints & Coatings, Chemicals and others), And By Region (North America, Europe, Asia-Pacific, And Rest Of The World) – Market Fore...

    Share:
    Download PDF ×

    We do not share your information with anyone. However, we may send you emails based on your report interest from time to time. You may contact us at any time to opt-out.

    Isopropyl Alcohol Market Infographic
    Purchase Options

    Market Share

    Isopropyl Alcohol Market Share Analysis

    Market share positioning strategies in the Isopropyl Alcohol (IPA) market play a crucial role in determining the success and sustainability of companies operating within it. Various factors such as product quality, pricing, distribution channels, and marketing efforts contribute to establishing a competitive position in the market. One common strategy employed by companies is differentiation, where they focus on offering unique features or benefits that set their IPA products apart from competitors. This could involve emphasizing purity levels, manufacturing processes, or catering to specific industry needs such as pharmaceutical or electronics manufacturing. By differentiating their products, companies can target niche markets and command premium prices, thereby increasing their market share.

    Isopropyl alcohol chemical is including with multiple antimicrobial properties which are blended by 60% to 90% of chemical with 10% to 40% of water. This is perfectly purified and can work rapidly against several viruses, bacteria, and fungi.

    Another important strategy is cost leadership, wherein companies aim to become the lowest-cost producer in the IPA market. This involves optimizing production processes, sourcing raw materials efficiently, and achieving economies of scale. By offering competitive prices, companies can attract price-sensitive customers and gain market share from competitors who cannot match their cost structure. However, maintaining cost leadership requires continuous improvement and innovation to stay ahead of competitors and adapt to changing market conditions.

    Furthermore, companies may pursue a focused strategy by targeting specific market segments or geographic regions where they can achieve a dominant position. For example, a company might focus on supplying IPA to the healthcare industry or concentrate on expanding its presence in emerging markets with high demand growth. By focusing their resources and efforts, companies can establish a strong presence in their chosen segments and defend against competition more effectively.

    Collaboration and strategic partnerships also play a significant role in market share positioning strategies within the IPA market. Companies may form alliances with suppliers, distributors, or even competitors to enhance their market reach, access new technologies, or streamline their supply chain. Strategic partnerships can enable companies to leverage each other's strengths and resources, ultimately increasing their competitiveness and market share.

    Additionally, effective marketing and branding strategies are essential for companies looking to strengthen their market position in the IPA market. This includes building brand awareness, communicating product benefits, and establishing a positive reputation among customers and stakeholders. By investing in marketing activities such as advertising, promotions, and sponsorships, companies can influence consumer perceptions and preference for their IPA products over competitors'.

    Continuous innovation and product development are also critical for maintaining a competitive edge in the IPA market. Companies need to stay abreast of technological advancements, regulatory changes, and evolving customer needs to develop new and improved products. Whether it's developing environmentally friendly formulations, enhancing product purity, or introducing convenient packaging options, innovation can help companies differentiate themselves and capture market share from rivals.

    Lastly, effective distribution and sales strategies are crucial for ensuring market penetration and expanding customer reach. Companies must identify the most efficient distribution channels, whether it's through direct sales, wholesalers, or online platforms, to ensure their IPA products are readily available to customers. Moreover, providing excellent customer service and building strong relationships with distributors can enhance brand loyalty and drive repeat purchases, further solidifying a company's market position.

    Author
    Chitranshi Jaiswal
    Research Analyst Level I

    In her 3 years of experience in the market research field, she has handled critical cross-domain projects. She has an in-depth knowledge of market estimation & analysis, problem-solving, primary as well as secondary research, and team management.She holds an engineering degree and is an MBA professional from a well-known university, capable of evaluating the market and competitive conditions. An exceptional strategist with excellent communication skills and a passion for delivering cutting-edge & practical insights for the market. Proficient in multi-tasking, and can successfully deal with competing demands, while maintaining complete confidentiality. Generated business through active client and project development, networking, and high-quality responses. Her knowledge and skills have helped in making solid business decisions, securing funding from investors, and avoiding business failures.

    Leave a Comment

    FAQs

    What is the projected market valuation of the Isopropyl Alcohol Market by 2035?

    The Isopropyl Alcohol Market is projected to reach a valuation of 8.09 USD Billion by 2035.

    What was the market valuation of Isopropyl Alcohol in 2024?

    In 2024, the Isopropyl Alcohol Market was valued at 3.78 USD Billion.

    What is the expected CAGR for the Isopropyl Alcohol Market during the forecast period 2025 - 2035?

    The expected CAGR for the Isopropyl Alcohol Market during the forecast period 2025 - 2035 is 7.16%.

    Which production methods are utilized in the Isopropyl Alcohol Market?

    The Isopropyl Alcohol Market utilizes two primary production methods: Indirect Hydration and Direct Hydration.

    What are the key applications of Isopropyl Alcohol?

    Key applications of Isopropyl Alcohol include solvents, cleaning agents, intermediates, disinfectants, and others.

    How do the end-use segments of the Isopropyl Alcohol Market break down?

    End-use segments of the Isopropyl Alcohol Market include cosmetics & personal care, pharmaceuticals, paints & coatings, chemicals, and others.

    Market Summary

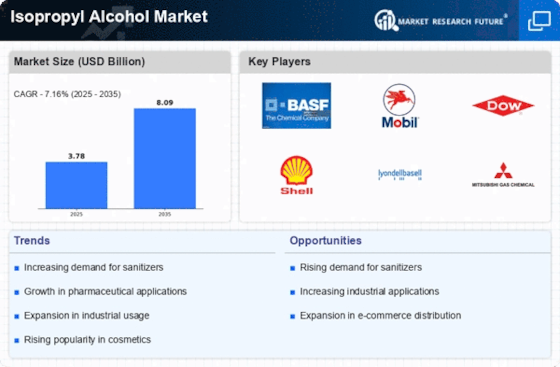
    As per MRFR analysis, the Isopropyl Alcohol Market Size was estimated at 3.78 USD Billion in 2024. The Isopropyl Alcohol industry is projected to grow from 4.051 USD Billion in 2025 to 8.09 USD Billion by 2035, exhibiting a compound annual growth rate (CAGR) of 7.16 during the forecast period 2025 - 2035.

    Key Market Trends & Highlights

    The Isopropyl Alcohol Market is experiencing robust growth driven by diverse applications and increasing demand across various sectors.

    • North America remains the largest market for isopropyl alcohol, driven by its extensive use in healthcare and industrial applications. The Asia-Pacific region is emerging as the fastest-growing market, fueled by rising consumer demand and expanding manufacturing capabilities. Indirect hydration continues to dominate the market, while direct hydration is witnessing rapid growth due to evolving production techniques. Key market drivers include the increasing use of isopropyl alcohol in personal care products and a surge in cleaning and disinfecting products.

    Market Size & Forecast

    2024 Market Size 3.78 (USD Billion)
    2035 Market Size 8.09 (USD Billion)
    CAGR (2025 - 2035) 7.16%
    Largest Regional Market Share in 2024 Asia Pacific

    Major Players

    <p>BASF SE (DE), ExxonMobil Chemical (US), Dow Inc. (US), Shell Chemicals (GB), LyondellBasell Industries (US), Mitsubishi Gas Chemical Company (JP), SABIC (SA), INEOS (GB), Eastman Chemical Company (US)</p>

    Market Trends

    The Isopropyl Alcohol Market is currently experiencing notable growth, driven by its diverse applications across various industries. This versatile solvent is utilized in pharmaceuticals, cosmetics, and cleaning products, among others. The increasing demand for sanitization and hygiene products has further propelled its usage, as consumers and businesses alike prioritize cleanliness. Additionally, the rise of e-commerce has facilitated the distribution of isopropyl alcohol, making it more accessible to end-users. As a result, manufacturers are adapting their production strategies to meet the evolving needs of the market, indicating a dynamic landscape. Moreover, sustainability concerns are influencing the Isopropyl Alcohol Market, as stakeholders seek eco-friendly alternatives and production methods. Companies are exploring renewable sources and innovative processes to reduce their environmental impact. This shift towards sustainability may reshape the competitive landscape, as businesses that prioritize green practices could gain a competitive edge. Overall, the Isopropyl Alcohol Market appears poised for continued expansion, with trends suggesting a blend of traditional applications and emerging sustainable practices that could redefine its future.

    Rising Demand in Healthcare

    The healthcare sector is increasingly relying on isopropyl alcohol for its antiseptic properties. This trend is likely to continue as hospitals and clinics prioritize infection control and patient safety. The versatility of isopropyl alcohol in various formulations enhances its appeal in medical applications.

    Sustainability Initiatives

    There is a growing emphasis on sustainable practices within the Isopropyl Alcohol Market. Companies are exploring bio-based production methods and eco-friendly alternatives to traditional processes. This shift may attract environmentally conscious consumers and businesses.

    E-commerce Growth

    The expansion of e-commerce platforms is transforming the distribution channels for isopropyl alcohol. Consumers are increasingly purchasing cleaning and sanitizing products online, which may lead to greater market accessibility and convenience.

    Isopropyl Alcohol Market Market Drivers

    Expansion in Industrial Applications

    The Isopropyl Alcohol Market is significantly influenced by its expanding applications across various industrial sectors. Industries such as automotive, electronics, and pharmaceuticals utilize isopropyl alcohol for cleaning, degreasing, and as a solvent in manufacturing processes. The increasing complexity of manufacturing processes and the need for high-purity solvents are driving this trend. For instance, in the electronics sector, isopropyl alcohol is essential for cleaning circuit boards and components, ensuring optimal performance. Market data indicates that the industrial segment is expected to witness robust growth, as companies seek efficient and effective cleaning solutions. This expansion in industrial applications is likely to bolster the demand for isopropyl alcohol, further solidifying its position within the Isopropyl Alcohol Market.

    Increasing Use in Personal Care Products

    The Isopropyl Alcohol Market is experiencing a notable rise in demand due to its incorporation in personal care products. This compound is widely utilized in cosmetics, skincare, and hair care formulations, serving as a solvent and antiseptic. The growing consumer awareness regarding hygiene and personal grooming is propelling manufacturers to include isopropyl alcohol in their products. According to recent data, the personal care segment is projected to account for a substantial share of the market, reflecting a trend towards premiumization and quality in consumer goods. As consumers increasingly prioritize health and wellness, the demand for isopropyl alcohol in this sector is likely to continue its upward trajectory, thereby enhancing the overall growth of the Isopropyl Alcohol Market.

    Technological Advancements in Production

    The Isopropyl Alcohol Market is witnessing a transformation due to technological advancements in production methods. Innovations in manufacturing processes, such as the development of more efficient catalytic processes, are enhancing the yield and purity of isopropyl alcohol. These advancements not only reduce production costs but also minimize environmental impact, aligning with sustainability goals. Furthermore, the introduction of bio-based isopropyl alcohol is gaining traction, appealing to environmentally conscious consumers and industries. Market data indicates that these technological improvements are likely to drive competitive pricing and increase accessibility, thereby expanding the market reach of isopropyl alcohol. As production technologies continue to evolve, the Isopropyl Alcohol Market is poised for significant growth.

    Rising Demand in the Pharmaceutical Sector

    The Isopropyl Alcohol Market is significantly bolstered by the increasing demand from the pharmaceutical sector. Isopropyl alcohol is widely used as a disinfectant and antiseptic in hospitals and clinics, contributing to infection control and patient safety. The ongoing advancements in healthcare and the rising prevalence of chronic diseases are driving the need for effective sanitization solutions. Recent statistics suggest that the pharmaceutical segment is projected to grow at a considerable rate, reflecting the heightened focus on hygiene and safety in medical environments. As healthcare providers continue to prioritize cleanliness, the demand for isopropyl alcohol is expected to rise, thereby enhancing its role in the Isopropyl Alcohol Market.

    Surge in Cleaning and Disinfecting Products

    The Isopropyl Alcohol Market is experiencing a surge in demand for cleaning and disinfecting products. The heightened awareness of cleanliness and hygiene in both residential and commercial spaces is driving consumers to seek effective cleaning solutions. Isopropyl alcohol is a key ingredient in many disinfectants, known for its efficacy against a wide range of pathogens. Recent market analysis suggests that the cleaning products segment is expected to grow substantially, as consumers increasingly prioritize health and safety in their environments. This trend is further supported by the rise of e-commerce platforms, which facilitate the easy availability of isopropyl alcohol-based cleaning products. As the demand for cleaning solutions continues to escalate, the Isopropyl Alcohol Market is likely to benefit from this growing consumer preference.

    Market Segment Insights

    By Production Method: Indirect Hydration (Largest) vs. Direct Hydration (Fastest-Growing)

    <p>In the Isopropyl Alcohol Market, the production methods are primarily categorized into Indirect Hydration and Direct Hydration. The Indirect Hydration method has emerged as the largest segment due to its established processes and efficiency in producing high-purity isopropyl alcohol. Conversely, Direct Hydration is witnessing robust growth, attracting attention for its cost-effectiveness and advancements in technology, which are making it increasingly viable for producers seeking to optimize their operations. The growth trends in the production methods indicate a significant shift towards Direct Hydration. This segment is benefiting from growing environmental concerns and a push for sustainable practices, as it often involves fewer processing steps and lower energy consumption. The ongoing innovations in catalyst development are also propelling the Direct Hydration method as a preferred choice among manufacturers looking to enhance yield while reducing operational costs.</p>

    <p>Indirect Hydration (Dominant) vs. Direct Hydration (Emerging)</p>

    <p>The Indirect Hydration method of isopropyl alcohol production stands as a dominant force in the market, characterized by its ability to deliver consistently high-purity alcohol through established chemical processes. It often involves the reaction of <a href="https://www.marketresearchfuture.com/reports/ethylene-propylene-diene-monomer-market-2767">propylene</a> with sulfuric acid, followed by hydrolysis, ensuring a reliable output for industrial applications. This method is particularly favored in sectors that require stringent purity standards. On the other hand, Direct Hydration, while currently emerging, is gaining traction as a competitive alternative. This method employs direct mixing of water and propylene in the presence of acid catalysts, leading to a more streamlined and energy-efficient process. As industries increasingly prioritize sustainability, the Direct Hydration method is anticipated to expand its footprint, offering manufacturers a cost-effective solution to meet the rising demand for isopropyl alcohol.</p>

    By Application: Solvents (Largest) vs. Disinfectants (Fastest-Growing)

    <p>In the Isopropyl Alcohol market, the application segment reveals a varied distribution among key categories such as solvents, cleaning agents, intermediates, disinfectants, and others. Solvents hold the largest share due to their extensive use in various industrial processes, highlighting their significance in the market. Following solvents, disinfectants have garnered substantial market interest owing to their increasing utilization in healthcare and sanitation practices, particularly following the emphasis on hygiene in recent years.</p>

    <p>Solvents (Dominant) vs. Disinfectants (Emerging)</p>

    <p>Solvents serve as the dominant application of isopropyl alcohol, primarily used in manufacturing industries, pharmaceuticals, and personal care products for their excellent solvent properties and effectiveness in formulations. This segment benefits from robust demand across various applications, reinforcing its leading market position. On the other hand, disinfectants represent an emerging segment fueled by heightened health awareness and demand for sanitizing products. The accelerated adoption of disinfectants, especially in healthcare settings and consumer products, underscores their rapid growth trajectory, making them a vital area of focus for future market developments.</p>

    By End-Use: Cosmetics & Personal Care (Largest) vs. Pharmaceuticals (Fastest-Growing)

    <p>In the Isopropyl Alcohol Market, the end-use segments demonstrate varied market share distributions. The <a href="https://www.marketresearchfuture.com/reports/cosmetics-personal-care-ingredients-market-3889">Cosmetics &amp; Personal Care</a> segment holds the largest share, driven by increasing consumer demand for skin and personal hygiene products that incorporate isopropyl alcohol for its antiseptic properties. Following this is the Pharmaceuticals segment, which, while smaller in share, has shown significant importance due to the rising need for sanitizers and disinfectants in healthcare settings, particularly during health crises.</p>

    <p>Cosmetics &amp; Personal Care (Dominant) vs. Pharmaceuticals (Emerging)</p>

    <p>The Cosmetics &amp; Personal Care segment is currently the dominant force in the isopropyl alcohol market, stemming from its widespread application in beauty products, skincare, and personal hygiene items. Its ability to act as a solvent and antiseptic makes it essential for maintaining product stability and enhancing user safety. On the other hand, the Pharmaceuticals segment is emerging rapidly as a crucial player. With increased health awareness and stringent health regulations, the demand for isopropyl alcohol in the production of sanitizers, antiseptics, and medicinal formulations is on the rise, positioning it as a key growth driver in the market.</p>

    Get more detailed insights about Isopropyl Alcohol Market Research Report - Forecast till 2035

    Regional Insights

    North America : Market Leader in Production

    North America is the largest market for isopropyl alcohol, holding approximately 40% of the global share. The region's growth is driven by increasing demand in pharmaceuticals, cosmetics, and cleaning products, alongside stringent regulations promoting the use of high-purity isopropyl alcohol. The U.S. is the primary contributor, followed by Canada, as both countries enhance production capabilities to meet rising consumer needs. The competitive landscape in North America is robust, featuring key players such as ExxonMobil Chemical, Dow Inc., and BASF SE. These companies leverage advanced technologies and sustainable practices to maintain their market positions. The presence of established manufacturing facilities and a strong distribution network further solidify North America's dominance in the isopropyl alcohol market. The region's focus on innovation and regulatory compliance continues to drive growth.

    Europe : Regulatory-Driven Market Growth

    Europe is witnessing significant growth in the isopropyl alcohol market, accounting for approximately 30% of the global share. The region's demand is primarily fueled by stringent environmental regulations and a shift towards sustainable practices in various industries, including pharmaceuticals and personal care. Countries like Germany and France are leading the market, driven by their strong manufacturing bases and commitment to sustainability. The competitive landscape in Europe is characterized by the presence of major players such as BASF SE and INEOS. These companies are investing in innovative production methods to reduce environmental impact while meeting the increasing demand for high-quality isopropyl alcohol. The European market is also supported by regulatory frameworks that encourage the use of eco-friendly solvents, further enhancing growth prospects. The European Chemicals Agency emphasizes the importance of sustainable chemical practices in its regulations.

    Asia-Pacific : Emerging Market Potential

    Asia-Pacific is rapidly emerging as a significant player in the isopropyl alcohol market, holding around 25% of the global share. The region's growth is driven by increasing industrialization, rising demand from the pharmaceutical and automotive sectors, and expanding consumer markets. Countries like China and India are at the forefront, with substantial investments in manufacturing and infrastructure to support this growth trajectory. The competitive landscape in Asia-Pacific is evolving, with both local and international players vying for market share. Key companies such as Mitsubishi Gas Chemical and SABIC are expanding their operations to cater to the growing demand. The region's focus on enhancing production capabilities and adopting advanced technologies is expected to further boost its market position. As regulatory frameworks become more stringent, companies are also adapting to ensure compliance and sustainability in their operations.

    Middle East and Africa : Resource-Rich Market Dynamics

    The Middle East and Africa region is gradually developing its isopropyl alcohol market, currently holding about 5% of the global share. The growth is primarily driven by increasing industrial activities, particularly in the oil and gas sector, and a rising demand for cleaning and disinfecting products. Countries like Saudi Arabia and South Africa are leading the market, leveraging their natural resources and expanding manufacturing capabilities to meet local and international demand. The competitive landscape in the Middle East and Africa is characterized by a mix of local and international players. Companies are focusing on establishing production facilities to reduce import dependency and enhance supply chain efficiency. The presence of key players such as LyondellBasell Industries and Eastman Chemical Company is notable, as they invest in the region to tap into its growth potential. As the market matures, regulatory frameworks are expected to evolve, promoting sustainable practices and enhancing product quality.

    Key Players and Competitive Insights

    The Isopropyl Alcohol Market is currently characterized by a dynamic competitive landscape, driven by increasing demand across various sectors, including pharmaceuticals, cosmetics, and industrial applications. Key players such as BASF SE (Germany), ExxonMobil Chemical (US), and Dow Inc. (US) are strategically positioned to leverage their extensive production capabilities and innovative approaches. BASF SE (Germany) focuses on sustainability and has been investing in green chemistry initiatives, which not only enhance their product offerings but also align with global environmental goals. Meanwhile, ExxonMobil Chemical (US) emphasizes operational efficiency and technological advancements to optimize production processes, thereby maintaining a competitive edge in pricing and supply reliability. Collectively, these strategies contribute to a moderately fragmented market structure, where innovation and operational excellence are pivotal for competitive differentiation.

    In terms of business tactics, companies are increasingly localizing manufacturing to reduce lead times and enhance supply chain resilience. This approach is particularly relevant in the context of fluctuating global supply chains. The competitive structure of the Isopropyl Alcohol Market appears to be moderately fragmented, with several key players exerting influence through strategic partnerships and regional expansions. The collective actions of these companies indicate a trend towards optimizing supply chains and enhancing production capabilities to meet rising demand.

    In August 2025, Dow Inc. (US) announced the expansion of its isopropyl alcohol production facility in Texas, aimed at increasing output to meet the growing demand from the healthcare sector. This strategic move underscores Dow's commitment to enhancing its production capacity while also addressing the specific needs of a rapidly evolving market. The expansion is expected to bolster Dow's market share and reinforce its position as a leading supplier in the region.

    In September 2025, ExxonMobil Chemical (US) launched a new line of isopropyl alcohol products that are designed to meet stringent environmental regulations. This initiative not only reflects the company's dedication to sustainability but also positions it favorably in a market that increasingly values eco-friendly products. By aligning its product offerings with regulatory trends, ExxonMobil is likely to attract a broader customer base, particularly among environmentally conscious consumers.

    In July 2025, BASF SE (Germany) entered into a strategic partnership with a leading biotechnology firm to develop bio-based isopropyl alcohol. This collaboration is indicative of a broader trend towards sustainable production methods and could potentially reshape the competitive landscape by introducing innovative, eco-friendly alternatives to traditional isopropyl alcohol. The partnership may enhance BASF's reputation as a leader in sustainable practices, thereby attracting new customers and markets.

    As of October 2025, the Isopropyl Alcohol Market is witnessing significant trends such as digitalization, sustainability, and the integration of artificial intelligence in production processes. These trends are reshaping competitive dynamics, with companies increasingly forming strategic alliances to enhance their technological capabilities and market reach. The shift from price-based competition to a focus on innovation, technology, and supply chain reliability is becoming more pronounced. Moving forward, companies that prioritize these aspects are likely to achieve a competitive advantage, as the market continues to evolve in response to changing consumer preferences and regulatory landscapes.

    Key Companies in the Isopropyl Alcohol Market market include

    Industry Developments

    • Q1 2024: INEOS appoints new CEO for its Chemicals Division INEOS announced the appointment of a new CEO for its Chemicals Division, which oversees isopropyl alcohol production, as part of its leadership succession plan to drive growth in specialty chemicals.
    • Q2 2024: ExxonMobil completes expansion of isopropyl alcohol production facility in Baton Rouge ExxonMobil announced the completion of a major capacity expansion at its Baton Rouge facility, increasing isopropyl alcohol output to meet rising demand from pharmaceutical and electronics sectors.
    • Q2 2024: Shell signs long-term supply agreement for isopropyl alcohol with major Asian electronics manufacturer Shell Chemicals secured a multi-year contract to supply high-purity isopropyl alcohol to a leading electronics manufacturer in Asia, strengthening its position in the specialty solvents market.
    • Q3 2024: Honeywell launches new high-purity isopropyl alcohol product for semiconductor industry Honeywell introduced a new grade of high-purity isopropyl alcohol designed for advanced semiconductor manufacturing, targeting increased demand for ultra-clean solvents.
    • Q3 2024: LyondellBasell announces $200 million investment in US isopropyl alcohol plant modernization LyondellBasell revealed plans to invest $200 million to modernize its US isopropyl alcohol production facility, aiming to improve efficiency and reduce carbon emissions.
    • Q4 2024: Dow secures regulatory approval for new isopropyl alcohol plant in Texas Dow received final regulatory clearance to construct a new isopropyl alcohol manufacturing plant in Texas, expected to boost domestic supply and create 150 new jobs.
    • Q4 2024: BASF acquires specialty isopropyl alcohol business from regional supplier BASF completed the acquisition of a specialty isopropyl alcohol business from a regional supplier, expanding its portfolio in the pharmaceutical and personal care sectors.
    • Q1 2025: Greenfield Global opens new isopropyl alcohol production facility in Ontario Greenfield Global inaugurated a new isopropyl alcohol plant in Ontario, Canada, to serve growing demand in North American healthcare and industrial markets.
    • Q1 2025: ExxonMobil signs supply contract with US government for emergency isopropyl alcohol reserves ExxonMobil entered into a contract with the US government to supply isopropyl alcohol for national emergency reserves, ensuring critical supply for healthcare and sanitation.
    • Q2 2025: ENEOS Holdings announces partnership with Japanese pharma giant for isopropyl alcohol innovation ENEOS Holdings formed a strategic partnership with a leading Japanese pharmaceutical company to co-develop next-generation isopropyl alcohol formulations for medical applications.
    • Q2 2025: Shell to build Asia’s largest isopropyl alcohol plant in Singapore Shell announced plans to construct the largest isopropyl alcohol production facility in Asia, located in Singapore, to meet surging regional demand in electronics and healthcare.
    • Q3 2025: Dow launches bio-based isopropyl alcohol product line Dow introduced a new line of bio-based isopropyl alcohol products, targeting customers seeking sustainable alternatives in the pharmaceutical and personal care industries.

    Future Outlook

    Isopropyl Alcohol Market Future Outlook

    <p>The Isopropyl Alcohol Market is projected to grow at a 7.16% CAGR from 2024 to 2035, driven by increasing demand in pharmaceuticals, cosmetics, and industrial applications.</p>

    New opportunities lie in:

    • <p>Expansion into eco-friendly isopropyl alcohol production methods.</p><p>Development of customized formulations for specific industrial applications.</p><p>Investment in automated dispensing solutions for healthcare facilities.</p>

    <p>By 2035, the Isopropyl Alcohol Market is expected to achieve robust growth, solidifying its position as a key player in various industries.</p>

    Market Segmentation

    Isopropyl Alcohol Market End-Use Outlook

    • Cosmetics & Personal Care
    • Pharmaceuticals
    • Paints & Coatings
    • Chemicals
    • Others

    Isopropyl Alcohol Market Application Outlook

    • Solvents
    • Cleaning Agent
    • Intermediate
    • Disinfectants
    • Others

    Isopropyl Alcohol Market Production Method Outlook

    • Indirect Hydration
    • Direct Hydration

    Report Scope

    MARKET SIZE 20243.78(USD Billion)
    MARKET SIZE 20254.051(USD Billion)
    MARKET SIZE 20358.09(USD Billion)
    COMPOUND ANNUAL GROWTH RATE (CAGR)7.16% (2024 - 2035)
    REPORT COVERAGERevenue Forecast, Competitive Landscape, Growth Factors, and Trends
    BASE YEAR2024
    Market Forecast Period2025 - 2035
    Historical Data2019 - 2024
    Market Forecast UnitsUSD Billion
    Key Companies ProfiledMarket analysis in progress
    Segments CoveredMarket segmentation analysis in progress
    Key Market OpportunitiesGrowing demand for eco-friendly solvents in various industries enhances opportunities in the Isopropyl Alcohol Market.
    Key Market DynamicsRising demand for isopropyl alcohol in healthcare and cleaning sectors drives market growth and innovation.
    Countries CoveredNorth America, Europe, APAC, South America, MEA

    FAQs

    What is the projected market valuation of the Isopropyl Alcohol Market by 2035?

    The Isopropyl Alcohol Market is projected to reach a valuation of 8.09 USD Billion by 2035.

    What was the market valuation of Isopropyl Alcohol in 2024?

    In 2024, the Isopropyl Alcohol Market was valued at 3.78 USD Billion.

    What is the expected CAGR for the Isopropyl Alcohol Market during the forecast period 2025 - 2035?

    The expected CAGR for the Isopropyl Alcohol Market during the forecast period 2025 - 2035 is 7.16%.

    Which production methods are utilized in the Isopropyl Alcohol Market?

    The Isopropyl Alcohol Market utilizes two primary production methods: Indirect Hydration and Direct Hydration.

    What are the key applications of Isopropyl Alcohol?

    Key applications of Isopropyl Alcohol include solvents, cleaning agents, intermediates, disinfectants, and others.

    How do the end-use segments of the Isopropyl Alcohol Market break down?

    End-use segments of the Isopropyl Alcohol Market include cosmetics & personal care, pharmaceuticals, paints & coatings, chemicals, and others.

    1. SECTION I: EXECUTIVE SUMMARY AND KEY HIGHLIGHTS
      1. | 1.1 EXECUTIVE SUMMARY
      2. | | 1.1.1 Market Overview
      3. | | 1.1.2 Key Findings
      4. | | 1.1.3 Market Segmentation
      5. | | 1.1.4 Competitive Landscape
      6. | | 1.1.5 Challenges and Opportunities
      7. | | 1.1.6 Future Outlook
    2. SECTION II: SCOPING, METHODOLOGY AND MARKET STRUCTURE
      1. | 2.1 MARKET INTRODUCTION
      2. | | 2.1.1 Definition
      3. | | 2.1.2 Scope of the study
      4. | | | 2.1.2.1 Research Objective
      5. | | | 2.1.2.2 Assumption
      6. | | | 2.1.2.3 Limitations
      7. | 2.2 RESEARCH METHODOLOGY
      8. | | 2.2.1 Overview
      9. | | 2.2.2 Data Mining
      10. | | 2.2.3 Secondary Research
      11. | | 2.2.4 Primary Research
      12. | | | 2.2.4.1 Primary Interviews and Information Gathering Process
      13. | | | 2.2.4.2 Breakdown of Primary Respondents
      14. | | 2.2.5 Forecasting Model
      15. | | 2.2.6 Market Size Estimation
      16. | | | 2.2.6.1 Bottom-Up Approach
      17. | | | 2.2.6.2 Top-Down Approach
      18. | | 2.2.7 Data Triangulation
      19. | | 2.2.8 Validation
    3. SECTION III: QUALITATIVE ANALYSIS
      1. | 3.1 MARKET DYNAMICS
      2. | | 3.1.1 Overview
      3. | | 3.1.2 Drivers
      4. | | 3.1.3 Restraints
      5. | | 3.1.4 Opportunities
      6. | 3.2 MARKET FACTOR ANALYSIS
      7. | | 3.2.1 Value chain Analysis
      8. | | 3.2.2 Porter's Five Forces Analysis
      9. | | | 3.2.2.1 Bargaining Power of Suppliers
      10. | | | 3.2.2.2 Bargaining Power of Buyers
      11. | | | 3.2.2.3 Threat of New Entrants
      12. | | | 3.2.2.4 Threat of Substitutes
      13. | | | 3.2.2.5 Intensity of Rivalry
      14. | | 3.2.3 COVID-19 Impact Analysis
      15. | | | 3.2.3.1 Market Impact Analysis
      16. | | | 3.2.3.2 Regional Impact
      17. | | | 3.2.3.3 Opportunity and Threat Analysis
    4. SECTION IV: QUANTITATIVE ANALYSIS
      1. | 4.1 Chemicals and Materials, BY Production Method (USD Billion)
      2. | | 4.1.1 Indirect Hydration
      3. | | 4.1.2 Direct Hydration
      4. | 4.2 Chemicals and Materials, BY Application (USD Billion)
      5. | | 4.2.1 Solvents
      6. | | 4.2.2 Cleaning Agent
      7. | | 4.2.3 Intermediate
      8. | | 4.2.4 Disinfectants
      9. | | 4.2.5 Others
      10. | 4.3 Chemicals and Materials, BY End-Use (USD Billion)
      11. | | 4.3.1 Cosmetics & Personal Care
      12. | | 4.3.2 Pharmaceuticals
      13. | | 4.3.3 Paints & Coatings
      14. | | 4.3.4 Chemicals
      15. | | 4.3.5 Others
      16. | 4.4 Chemicals and Materials, BY Region (USD Billion)
      17. | | 4.4.1 North America
      18. | | | 4.4.1.1 US
      19. | | | 4.4.1.2 Canada
      20. | | 4.4.2 Europe
      21. | | | 4.4.2.1 Germany
      22. | | | 4.4.2.2 UK
      23. | | | 4.4.2.3 France
      24. | | | 4.4.2.4 Russia
      25. | | | 4.4.2.5 Italy
      26. | | | 4.4.2.6 Spain
      27. | | | 4.4.2.7 Rest of Europe
      28. | | 4.4.3 APAC
      29. | | | 4.4.3.1 China
      30. | | | 4.4.3.2 India
      31. | | | 4.4.3.3 Japan
      32. | | | 4.4.3.4 South Korea
      33. | | | 4.4.3.5 Malaysia
      34. | | | 4.4.3.6 Thailand
      35. | | | 4.4.3.7 Indonesia
      36. | | | 4.4.3.8 Rest of APAC
      37. | | 4.4.4 South America
      38. | | | 4.4.4.1 Brazil
      39. | | | 4.4.4.2 Mexico
      40. | | | 4.4.4.3 Argentina
      41. | | | 4.4.4.4 Rest of South America
      42. | | 4.4.5 MEA
      43. | | | 4.4.5.1 GCC Countries
      44. | | | 4.4.5.2 South Africa
      45. | | | 4.4.5.3 Rest of MEA
    5. SECTION V: COMPETITIVE ANALYSIS
      1. | 5.1 Competitive Landscape
      2. | | 5.1.1 Overview
      3. | | 5.1.2 Competitive Analysis
      4. | | 5.1.3 Market share Analysis
      5. | | 5.1.4 Major Growth Strategy in the Chemicals and Materials
      6. | | 5.1.5 Competitive Benchmarking
      7. | | 5.1.6 Leading Players in Terms of Number of Developments in the Chemicals and Materials
      8. | | 5.1.7 Key developments and growth strategies
      9. | | | 5.1.7.1 New Product Launch/Service Deployment
      10. | | | 5.1.7.2 Merger & Acquisitions
      11. | | | 5.1.7.3 Joint Ventures
      12. | | 5.1.8 Major Players Financial Matrix
      13. | | | 5.1.8.1 Sales and Operating Income
      14. | | | 5.1.8.2 Major Players R&D Expenditure. 2023
      15. | 5.2 Company Profiles
      16. | | 5.2.1 BASF SE (DE)
      17. | | | 5.2.1.1 Financial Overview
      18. | | | 5.2.1.2 Products Offered
      19. | | | 5.2.1.3 Key Developments
      20. | | | 5.2.1.4 SWOT Analysis
      21. | | | 5.2.1.5 Key Strategies
      22. | | 5.2.2 ExxonMobil Chemical (US)
      23. | | | 5.2.2.1 Financial Overview
      24. | | | 5.2.2.2 Products Offered
      25. | | | 5.2.2.3 Key Developments
      26. | | | 5.2.2.4 SWOT Analysis
      27. | | | 5.2.2.5 Key Strategies
      28. | | 5.2.3 Dow Inc. (US)
      29. | | | 5.2.3.1 Financial Overview
      30. | | | 5.2.3.2 Products Offered
      31. | | | 5.2.3.3 Key Developments
      32. | | | 5.2.3.4 SWOT Analysis
      33. | | | 5.2.3.5 Key Strategies
      34. | | 5.2.4 Shell Chemicals (GB)
      35. | | | 5.2.4.1 Financial Overview
      36. | | | 5.2.4.2 Products Offered
      37. | | | 5.2.4.3 Key Developments
      38. | | | 5.2.4.4 SWOT Analysis
      39. | | | 5.2.4.5 Key Strategies
      40. | | 5.2.5 LyondellBasell Industries (US)
      41. | | | 5.2.5.1 Financial Overview
      42. | | | 5.2.5.2 Products Offered
      43. | | | 5.2.5.3 Key Developments
      44. | | | 5.2.5.4 SWOT Analysis
      45. | | | 5.2.5.5 Key Strategies
      46. | | 5.2.6 Mitsubishi Gas Chemical Company (JP)
      47. | | | 5.2.6.1 Financial Overview
      48. | | | 5.2.6.2 Products Offered
      49. | | | 5.2.6.3 Key Developments
      50. | | | 5.2.6.4 SWOT Analysis
      51. | | | 5.2.6.5 Key Strategies
      52. | | 5.2.7 SABIC (SA)
      53. | | | 5.2.7.1 Financial Overview
      54. | | | 5.2.7.2 Products Offered
      55. | | | 5.2.7.3 Key Developments
      56. | | | 5.2.7.4 SWOT Analysis
      57. | | | 5.2.7.5 Key Strategies
      58. | | 5.2.8 INEOS (GB)
      59. | | | 5.2.8.1 Financial Overview
      60. | | | 5.2.8.2 Products Offered
      61. | | | 5.2.8.3 Key Developments
      62. | | | 5.2.8.4 SWOT Analysis
      63. | | | 5.2.8.5 Key Strategies
      64. | | 5.2.9 Eastman Chemical Company (US)
      65. | | | 5.2.9.1 Financial Overview
      66. | | | 5.2.9.2 Products Offered
      67. | | | 5.2.9.3 Key Developments
      68. | | | 5.2.9.4 SWOT Analysis
      69. | | | 5.2.9.5 Key Strategies
      70. | 5.3 Appendix
      71. | | 5.3.1 References
      72. | | 5.3.2 Related Reports
    6. LIST OF FIGURES
      1. | 6.1 MARKET SYNOPSIS
      2. | 6.2 NORTH AMERICA MARKET ANALYSIS
      3. | 6.3 US MARKET ANALYSIS BY PRODUCTION METHOD
      4. | 6.4 US MARKET ANALYSIS BY APPLICATION
      5. | 6.5 US MARKET ANALYSIS BY END-USE
      6. | 6.6 CANADA MARKET ANALYSIS BY PRODUCTION METHOD
      7. | 6.7 CANADA MARKET ANALYSIS BY APPLICATION
      8. | 6.8 CANADA MARKET ANALYSIS BY END-USE
      9. | 6.9 EUROPE MARKET ANALYSIS
      10. | 6.10 GERMANY MARKET ANALYSIS BY PRODUCTION METHOD
      11. | 6.11 GERMANY MARKET ANALYSIS BY APPLICATION
      12. | 6.12 GERMANY MARKET ANALYSIS BY END-USE
      13. | 6.13 UK MARKET ANALYSIS BY PRODUCTION METHOD
      14. | 6.14 UK MARKET ANALYSIS BY APPLICATION
      15. | 6.15 UK MARKET ANALYSIS BY END-USE
      16. | 6.16 FRANCE MARKET ANALYSIS BY PRODUCTION METHOD
      17. | 6.17 FRANCE MARKET ANALYSIS BY APPLICATION
      18. | 6.18 FRANCE MARKET ANALYSIS BY END-USE
      19. | 6.19 RUSSIA MARKET ANALYSIS BY PRODUCTION METHOD
      20. | 6.20 RUSSIA MARKET ANALYSIS BY APPLICATION
      21. | 6.21 RUSSIA MARKET ANALYSIS BY END-USE
      22. | 6.22 ITALY MARKET ANALYSIS BY PRODUCTION METHOD
      23. | 6.23 ITALY MARKET ANALYSIS BY APPLICATION
      24. | 6.24 ITALY MARKET ANALYSIS BY END-USE
      25. | 6.25 SPAIN MARKET ANALYSIS BY PRODUCTION METHOD
      26. | 6.26 SPAIN MARKET ANALYSIS BY APPLICATION
      27. | 6.27 SPAIN MARKET ANALYSIS BY END-USE
      28. | 6.28 REST OF EUROPE MARKET ANALYSIS BY PRODUCTION METHOD
      29. | 6.29 REST OF EUROPE MARKET ANALYSIS BY APPLICATION
      30. | 6.30 REST OF EUROPE MARKET ANALYSIS BY END-USE
      31. | 6.31 APAC MARKET ANALYSIS
      32. | 6.32 CHINA MARKET ANALYSIS BY PRODUCTION METHOD
      33. | 6.33 CHINA MARKET ANALYSIS BY APPLICATION
      34. | 6.34 CHINA MARKET ANALYSIS BY END-USE
      35. | 6.35 INDIA MARKET ANALYSIS BY PRODUCTION METHOD
      36. | 6.36 INDIA MARKET ANALYSIS BY APPLICATION
      37. | 6.37 INDIA MARKET ANALYSIS BY END-USE
      38. | 6.38 JAPAN MARKET ANALYSIS BY PRODUCTION METHOD
      39. | 6.39 JAPAN MARKET ANALYSIS BY APPLICATION
      40. | 6.40 JAPAN MARKET ANALYSIS BY END-USE
      41. | 6.41 SOUTH KOREA MARKET ANALYSIS BY PRODUCTION METHOD
      42. | 6.42 SOUTH KOREA MARKET ANALYSIS BY APPLICATION
      43. | 6.43 SOUTH KOREA MARKET ANALYSIS BY END-USE
      44. | 6.44 MALAYSIA MARKET ANALYSIS BY PRODUCTION METHOD
      45. | 6.45 MALAYSIA MARKET ANALYSIS BY APPLICATION
      46. | 6.46 MALAYSIA MARKET ANALYSIS BY END-USE
      47. | 6.47 THAILAND MARKET ANALYSIS BY PRODUCTION METHOD
      48. | 6.48 THAILAND MARKET ANALYSIS BY APPLICATION
      49. | 6.49 THAILAND MARKET ANALYSIS BY END-USE
      50. | 6.50 INDONESIA MARKET ANALYSIS BY PRODUCTION METHOD
      51. | 6.51 INDONESIA MARKET ANALYSIS BY APPLICATION
      52. | 6.52 INDONESIA MARKET ANALYSIS BY END-USE
      53. | 6.53 REST OF APAC MARKET ANALYSIS BY PRODUCTION METHOD
      54. | 6.54 REST OF APAC MARKET ANALYSIS BY APPLICATION
      55. | 6.55 REST OF APAC MARKET ANALYSIS BY END-USE
      56. | 6.56 SOUTH AMERICA MARKET ANALYSIS
      57. | 6.57 BRAZIL MARKET ANALYSIS BY PRODUCTION METHOD
      58. | 6.58 BRAZIL MARKET ANALYSIS BY APPLICATION
      59. | 6.59 BRAZIL MARKET ANALYSIS BY END-USE
      60. | 6.60 MEXICO MARKET ANALYSIS BY PRODUCTION METHOD
      61. | 6.61 MEXICO MARKET ANALYSIS BY APPLICATION
      62. | 6.62 MEXICO MARKET ANALYSIS BY END-USE
      63. | 6.63 ARGENTINA MARKET ANALYSIS BY PRODUCTION METHOD
      64. | 6.64 ARGENTINA MARKET ANALYSIS BY APPLICATION
      65. | 6.65 ARGENTINA MARKET ANALYSIS BY END-USE
      66. | 6.66 REST OF SOUTH AMERICA MARKET ANALYSIS BY PRODUCTION METHOD
      67. | 6.67 REST OF SOUTH AMERICA MARKET ANALYSIS BY APPLICATION
      68. | 6.68 REST OF SOUTH AMERICA MARKET ANALYSIS BY END-USE
      69. | 6.69 MEA MARKET ANALYSIS
      70. | 6.70 GCC COUNTRIES MARKET ANALYSIS BY PRODUCTION METHOD
      71. | 6.71 GCC COUNTRIES MARKET ANALYSIS BY APPLICATION
      72. | 6.72 GCC COUNTRIES MARKET ANALYSIS BY END-USE
      73. | 6.73 SOUTH AFRICA MARKET ANALYSIS BY PRODUCTION METHOD
      74. | 6.74 SOUTH AFRICA MARKET ANALYSIS BY APPLICATION
      75. | 6.75 SOUTH AFRICA MARKET ANALYSIS BY END-USE
      76. | 6.76 REST OF MEA MARKET ANALYSIS BY PRODUCTION METHOD
      77. | 6.77 REST OF MEA MARKET ANALYSIS BY APPLICATION
      78. | 6.78 REST OF MEA MARKET ANALYSIS BY END-USE
      79. | 6.79 KEY BUYING CRITERIA OF CHEMICALS AND MATERIALS
      80. | 6.80 RESEARCH PROCESS OF MRFR
      81. | 6.81 DRO ANALYSIS OF CHEMICALS AND MATERIALS
      82. | 6.82 DRIVERS IMPACT ANALYSIS: CHEMICALS AND MATERIALS
      83. | 6.83 RESTRAINTS IMPACT ANALYSIS: CHEMICALS AND MATERIALS
      84. | 6.84 SUPPLY / VALUE CHAIN: CHEMICALS AND MATERIALS
      85. | 6.85 CHEMICALS AND MATERIALS, BY PRODUCTION METHOD, 2024 (% SHARE)
      86. | 6.86 CHEMICALS AND MATERIALS, BY PRODUCTION METHOD, 2024 TO 2035 (USD Billion)
      87. | 6.87 CHEMICALS AND MATERIALS, BY APPLICATION, 2024 (% SHARE)
      88. | 6.88 CHEMICALS AND MATERIALS, BY APPLICATION, 2024 TO 2035 (USD Billion)
      89. | 6.89 CHEMICALS AND MATERIALS, BY END-USE, 2024 (% SHARE)
      90. | 6.90 CHEMICALS AND MATERIALS, BY END-USE, 2024 TO 2035 (USD Billion)
      91. | 6.91 BENCHMARKING OF MAJOR COMPETITORS
    7. LIST OF TABLES
      1. | 7.1 LIST OF ASSUMPTIONS
      2. | | 7.1.1
      3. | 7.2 North America MARKET SIZE ESTIMATES; FORECAST
      4. | | 7.2.1 BY PRODUCTION METHOD, 2025-2035 (USD Billion)
      5. | | 7.2.2 BY APPLICATION, 2025-2035 (USD Billion)
      6. | | 7.2.3 BY END-USE, 2025-2035 (USD Billion)
      7. | 7.3 US MARKET SIZE ESTIMATES; FORECAST
      8. | | 7.3.1 BY PRODUCTION METHOD, 2025-2035 (USD Billion)
      9. | | 7.3.2 BY APPLICATION, 2025-2035 (USD Billion)
      10. | | 7.3.3 BY END-USE, 2025-2035 (USD Billion)
      11. | 7.4 Canada MARKET SIZE ESTIMATES; FORECAST
      12. | | 7.4.1 BY PRODUCTION METHOD, 2025-2035 (USD Billion)
      13. | | 7.4.2 BY APPLICATION, 2025-2035 (USD Billion)
      14. | | 7.4.3 BY END-USE, 2025-2035 (USD Billion)
      15. | 7.5 Europe MARKET SIZE ESTIMATES; FORECAST
      16. | | 7.5.1 BY PRODUCTION METHOD, 2025-2035 (USD Billion)
      17. | | 7.5.2 BY APPLICATION, 2025-2035 (USD Billion)
      18. | | 7.5.3 BY END-USE, 2025-2035 (USD Billion)
      19. | 7.6 Germany MARKET SIZE ESTIMATES; FORECAST
      20. | | 7.6.1 BY PRODUCTION METHOD, 2025-2035 (USD Billion)
      21. | | 7.6.2 BY APPLICATION, 2025-2035 (USD Billion)
      22. | | 7.6.3 BY END-USE, 2025-2035 (USD Billion)
      23. | 7.7 UK MARKET SIZE ESTIMATES; FORECAST
      24. | | 7.7.1 BY PRODUCTION METHOD, 2025-2035 (USD Billion)
      25. | | 7.7.2 BY APPLICATION, 2025-2035 (USD Billion)
      26. | | 7.7.3 BY END-USE, 2025-2035 (USD Billion)
      27. | 7.8 France MARKET SIZE ESTIMATES; FORECAST
      28. | | 7.8.1 BY PRODUCTION METHOD, 2025-2035 (USD Billion)
      29. | | 7.8.2 BY APPLICATION, 2025-2035 (USD Billion)
      30. | | 7.8.3 BY END-USE, 2025-2035 (USD Billion)
      31. | 7.9 Russia MARKET SIZE ESTIMATES; FORECAST
      32. | | 7.9.1 BY PRODUCTION METHOD, 2025-2035 (USD Billion)
      33. | | 7.9.2 BY APPLICATION, 2025-2035 (USD Billion)
      34. | | 7.9.3 BY END-USE, 2025-2035 (USD Billion)
      35. | 7.10 Italy MARKET SIZE ESTIMATES; FORECAST
      36. | | 7.10.1 BY PRODUCTION METHOD, 2025-2035 (USD Billion)
      37. | | 7.10.2 BY APPLICATION, 2025-2035 (USD Billion)
      38. | | 7.10.3 BY END-USE, 2025-2035 (USD Billion)
      39. | 7.11 Spain MARKET SIZE ESTIMATES; FORECAST
      40. | | 7.11.1 BY PRODUCTION METHOD, 2025-2035 (USD Billion)
      41. | | 7.11.2 BY APPLICATION, 2025-2035 (USD Billion)
      42. | | 7.11.3 BY END-USE, 2025-2035 (USD Billion)
      43. | 7.12 Rest of Europe MARKET SIZE ESTIMATES; FORECAST
      44. | | 7.12.1 BY PRODUCTION METHOD, 2025-2035 (USD Billion)
      45. | | 7.12.2 BY APPLICATION, 2025-2035 (USD Billion)
      46. | | 7.12.3 BY END-USE, 2025-2035 (USD Billion)
      47. | 7.13 APAC MARKET SIZE ESTIMATES; FORECAST
      48. | | 7.13.1 BY PRODUCTION METHOD, 2025-2035 (USD Billion)
      49. | | 7.13.2 BY APPLICATION, 2025-2035 (USD Billion)
      50. | | 7.13.3 BY END-USE, 2025-2035 (USD Billion)
      51. | 7.14 China MARKET SIZE ESTIMATES; FORECAST
      52. | | 7.14.1 BY PRODUCTION METHOD, 2025-2035 (USD Billion)
      53. | | 7.14.2 BY APPLICATION, 2025-2035 (USD Billion)
      54. | | 7.14.3 BY END-USE, 2025-2035 (USD Billion)
      55. | 7.15 India MARKET SIZE ESTIMATES; FORECAST
      56. | | 7.15.1 BY PRODUCTION METHOD, 2025-2035 (USD Billion)
      57. | | 7.15.2 BY APPLICATION, 2025-2035 (USD Billion)
      58. | | 7.15.3 BY END-USE, 2025-2035 (USD Billion)
      59. | 7.16 Japan MARKET SIZE ESTIMATES; FORECAST
      60. | | 7.16.1 BY PRODUCTION METHOD, 2025-2035 (USD Billion)
      61. | | 7.16.2 BY APPLICATION, 2025-2035 (USD Billion)
      62. | | 7.16.3 BY END-USE, 2025-2035 (USD Billion)
      63. | 7.17 South Korea MARKET SIZE ESTIMATES; FORECAST
      64. | | 7.17.1 BY PRODUCTION METHOD, 2025-2035 (USD Billion)
      65. | | 7.17.2 BY APPLICATION, 2025-2035 (USD Billion)
      66. | | 7.17.3 BY END-USE, 2025-2035 (USD Billion)
      67. | 7.18 Malaysia MARKET SIZE ESTIMATES; FORECAST
      68. | | 7.18.1 BY PRODUCTION METHOD, 2025-2035 (USD Billion)
      69. | | 7.18.2 BY APPLICATION, 2025-2035 (USD Billion)
      70. | | 7.18.3 BY END-USE, 2025-2035 (USD Billion)
      71. | 7.19 Thailand MARKET SIZE ESTIMATES; FORECAST
      72. | | 7.19.1 BY PRODUCTION METHOD, 2025-2035 (USD Billion)
      73. | | 7.19.2 BY APPLICATION, 2025-2035 (USD Billion)
      74. | | 7.19.3 BY END-USE, 2025-2035 (USD Billion)
      75. | 7.20 Indonesia MARKET SIZE ESTIMATES; FORECAST
      76. | | 7.20.1 BY PRODUCTION METHOD, 2025-2035 (USD Billion)
      77. | | 7.20.2 BY APPLICATION, 2025-2035 (USD Billion)
      78. | | 7.20.3 BY END-USE, 2025-2035 (USD Billion)
      79. | 7.21 Rest of APAC MARKET SIZE ESTIMATES; FORECAST
      80. | | 7.21.1 BY PRODUCTION METHOD, 2025-2035 (USD Billion)
      81. | | 7.21.2 BY APPLICATION, 2025-2035 (USD Billion)
      82. | | 7.21.3 BY END-USE, 2025-2035 (USD Billion)
      83. | 7.22 South America MARKET SIZE ESTIMATES; FORECAST
      84. | | 7.22.1 BY PRODUCTION METHOD, 2025-2035 (USD Billion)
      85. | | 7.22.2 BY APPLICATION, 2025-2035 (USD Billion)
      86. | | 7.22.3 BY END-USE, 2025-2035 (USD Billion)
      87. | 7.23 Brazil MARKET SIZE ESTIMATES; FORECAST
      88. | | 7.23.1 BY PRODUCTION METHOD, 2025-2035 (USD Billion)
      89. | | 7.23.2 BY APPLICATION, 2025-2035 (USD Billion)
      90. | | 7.23.3 BY END-USE, 2025-2035 (USD Billion)
      91. | 7.24 Mexico MARKET SIZE ESTIMATES; FORECAST
      92. | | 7.24.1 BY PRODUCTION METHOD, 2025-2035 (USD Billion)
      93. | | 7.24.2 BY APPLICATION, 2025-2035 (USD Billion)
      94. | | 7.24.3 BY END-USE, 2025-2035 (USD Billion)
      95. | 7.25 Argentina MARKET SIZE ESTIMATES; FORECAST
      96. | | 7.25.1 BY PRODUCTION METHOD, 2025-2035 (USD Billion)
      97. | | 7.25.2 BY APPLICATION, 2025-2035 (USD Billion)
      98. | | 7.25.3 BY END-USE, 2025-2035 (USD Billion)
      99. | 7.26 Rest of South America MARKET SIZE ESTIMATES; FORECAST
      100. | | 7.26.1 BY PRODUCTION METHOD, 2025-2035 (USD Billion)
      101. | | 7.26.2 BY APPLICATION, 2025-2035 (USD Billion)
      102. | | 7.26.3 BY END-USE, 2025-2035 (USD Billion)
      103. | 7.27 MEA MARKET SIZE ESTIMATES; FORECAST
      104. | | 7.27.1 BY PRODUCTION METHOD, 2025-2035 (USD Billion)
      105. | | 7.27.2 BY APPLICATION, 2025-2035 (USD Billion)
      106. | | 7.27.3 BY END-USE, 2025-2035 (USD Billion)
      107. | 7.28 GCC Countries MARKET SIZE ESTIMATES; FORECAST
      108. | | 7.28.1 BY PRODUCTION METHOD, 2025-2035 (USD Billion)
      109. | | 7.28.2 BY APPLICATION, 2025-2035 (USD Billion)
      110. | | 7.28.3 BY END-USE, 2025-2035 (USD Billion)
      111. | 7.29 South Africa MARKET SIZE ESTIMATES; FORECAST
      112. | | 7.29.1 BY PRODUCTION METHOD, 2025-2035 (USD Billion)
      113. | | 7.29.2 BY APPLICATION, 2025-2035 (USD Billion)
      114. | | 7.29.3 BY END-USE, 2025-2035 (USD Billion)
      115. | 7.30 Rest of MEA MARKET SIZE ESTIMATES; FORECAST
      116. | | 7.30.1 BY PRODUCTION METHOD, 2025-2035 (USD Billion)
      117. | | 7.30.2 BY APPLICATION, 2025-2035 (USD Billion)
      118. | | 7.30.3 BY END-USE, 2025-2035 (USD Billion)
      119. | 7.31 PRODUCT LAUNCH/PRODUCT DEVELOPMENT/APPROVAL
      120. | | 7.31.1
      121. | 7.32 ACQUISITION/PARTNERSHIP
      122. | | 7.32.1

    Isopropyl Alcohol Market Segmentation

    Market Segmentation Overview

    • Detailed segmentation data will be available in the full report
    • Comprehensive analysis by multiple parameters
    • Regional and country-level breakdowns
    • Market size forecasts by segment
    Infographic

    Free Sample Request

    Kindly complete the form below to receive a free sample of this Report

    Get Free Sample

    Customer Strories

    “I am very pleased with how market segments have been defined in a relevant way for my purposes (such as "Portable Freezers & refrigerators" and "last-mile"). In general the report is well structured. Thanks very much for your efforts.”

    Victoria Milne

    Founder
    Case Study
    Chemicals and Materials

    Compare Licence

    ×
    Features License Type
    Single User Multiuser License Enterprise User
    Price $4,950 $5,950 $7,250
    Maximum User Access Limit 1 User Upto 10 Users Unrestricted Access Throughout the Organization
    Free Customization
    Direct Access to Analyst
    Deliverable Format
    Platform Access
    Discount on Next Purchase 10% 15% 15%
    Printable Versions