• Cat-intel
  • MedIntelliX
  • Resources
  • About Us
  • Hero Background
    English
    Chinese
    French
    Japanese
    Korean
    German
    Spanish

    Iceland Sustainable Chemicals Market Trends

    ID: MRFR/CnM/11881-HCR
    128 Pages
    Garvit Vyas
    October 2025

    Iceland’s Sustainable Chemicals Market Research Report Information Product (Bio-Ketones, Bio-Alcohols {Bio-Butanol, Bio-Ethanol, Bio-Methanol, and Other Bio-Alcohols}, Bio-Organic Acids {Bio-Acetic Acid, Bio-Lactic Acid, Bio-Adipic Acid, Bio-Succinic Acid, Bio-Citric Acid, Bio-Acrylic Acid, and Other Bio-Organic Acids}, Bio-Polymers {Polylactic Acid, Bio-Polyethylene, and Other Bio-Polymers}, a...

    Share:
    Download PDF ×

    We do not share your information with anyone. However, we may send you emails based on your report interest from time to time. You may contact us at any time to opt-out.

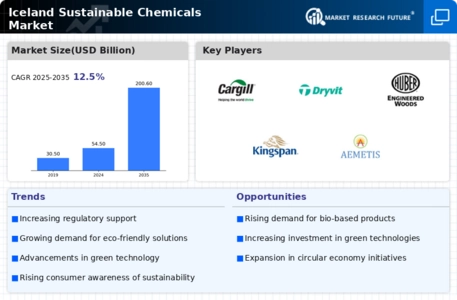
    Iceland Sustainable Chemicals Market Infographic
    $ 4,950.0
    $ 5,950.0
    $ 7,250.0

    Market Trends

    Key Emerging Trends in the Iceland Sustainable Chemicals Market

    Currently, there are notable trends within the Iceland Sustainable Chemicals Market that point towards an increased emphasis on green practices. Global concerns over climate change and environmental degradation have led industries worldwide to evaluate their production processes as well as materials so that they fit within sustainable frameworks. One major trend in Iceland's Sustainable Chemicals Market is the rising demand for bio-based chemicals. Currently, both consumers and firms appreciate that reliance on fossil fuels along with petrochemicals has negative implications; hence, alternative energy sources like biofuels have been developed. The bio-based chemicals made from biomass renewable sources or waste products from farming or microorganisms offer a better option that is more environmentally friendly compared to other sources, which could cause damage to our environment in the future days ahead when we would be in need of these resources apart from looking at it as a question of being green simply due to environmental reasons. Additionally, there has been a marked increase in investment and research conducted on green chemistry within the Icelandic market area. Green chemistry refers to the design and development of chemical products along with processes that either minimize or even eliminate their negative impacts on living organisms. By employing green chemistry principles in the production of chemicals, waste generation is reduced, energy consumption decreases, and safer raw materials are used. Furthermore, circular economy principles are gaining traction in the Iceland Sustainable Chemicals Market. This is because the traditional model of linear production-consumption-disposal is gradually being replaced by a concept that emphasizes recycling, reuse, and reduction of waste. The ultimate aim for many companies in Iceland is to close the loop in their chemical production processes by designing products that can be easily recycled or repurposed. In addition to being aligned with sustainability goals, this contributes to a more resource-efficient and resilient economy. Furthermore, there has been an increasing demand for sustainable packaging solutions within the market space. Consumers have become aware of their environmental footprints, thereby leading them to a quest for eco-friendly packaging materials. Some Icelandic chemical corporations are considering alternative packaging materials such as biodegradable plastic or using recycled materials when creating package items like boxes or bags, among others. Finally, regulatory initiatives and governmental support significantly shape market trends within Iceland’s sustainable chemicals industry. Specifically, policies introduced by governments that either mandate or provide incentives towards the adoption of sustainable practices along with the use of environmentally friendly inputs help businesses choose what best suits their operations without contravening environmental management guidelines. Nevertheless, this supportive regulation ensures compliance with environmental standards while fostering innovation and investment in sustainable technologies at large.

    Market Summary

    The Global Iceland Sustainable Chemicals Market is projected to experience substantial growth from 54.5 USD Billion in 2024 to 200.6 USD Billion by 2035.

    Key Market Trends & Highlights

    Iceland Sustainable Chemicals Key Trends and Highlights

    • The market is expected to grow at a compound annual growth rate (CAGR) of 12.57% from 2025 to 2035.
    • By 2035, the market valuation is anticipated to reach 200.6 USD Billion, indicating a robust expansion.
    • In 2024, the market is valued at 54.5 USD Billion, reflecting a strong foundation for future growth.
    • Growing adoption of sustainable practices due to increasing environmental regulations is a major market driver.

    Market Size & Forecast

    2024 Market Size 54.5 (USD Billion)
    2035 Market Size 200.6 (USD Billion)
    CAGR (2025-2035) 12.57%
    Largest Regional Market Share in 2024 latin_america)

    Major Players

    Cargill Inc., Mitsubishi Chemical UK Limited, BIO-KLEEN PRODUCTS INC., BASF SE, Balfour Beatty PLC, DuPont Industrial Bioscience, Dryvit Systems Inc, Anderson Corporation, Palmer Industries Inc., SILVER LINE BUILDING PRODUCTS LLC, Thermafiber Inc., Huber Engineered Woods LLC, Bayer Material Science AG, Kingspan Group, USG Corporation, Koninklijke DSM NV, Evonik Industries AG, SECOS Group Limited, Braskem SA, Aemetis, Inc., Albemarle Corporation

    Market Trends

    Rising consumer awareness and government support for sustainability are driving market growth.

    Iceland’s sustainable chemicals market CAGR is expanding due to the rising consumer awareness about the environmental impact of their choices. As consumers become more conscious of sustainability, there is a rising demand for eco-friendly products, boosting the need for green chemicals. Furthermore, the increasing adoption of bio-based packaging materials due to concerns about plastic waste and environmental pollution contributes to the market's expansion. As bio-based packaging gains popularity, there is a corresponding increase in the demand for green chemicals used in their production.

    Moreover, the escalating need for alternative fuels, such as biodiesel and bioethanol, propels the demand for green chemicals used in their manufacturing processes. Moreover, various governments actively promote sustainability and reduce carbon emissions, creating favorable conditions for green chemical companies. Additionally, efforts are being made to improve the recyclability of materials by designing products with fewer additives and separating different materials for easier recycling, boosting sustainable chemicals market revenue.

    The Iceland Sustainable Chemicals Market is poised for growth as the nation increasingly prioritizes eco-friendly practices and the transition to a circular economy.

    Icelandic Ministry of Environment and Natural Resources

    Iceland Sustainable Chemicals Market Market Drivers

    Market Growth Projections

    The Global Iceland Sustainable Chemicals Market Industry is projected to experience robust growth, with estimates indicating a market size of 54.5 USD Billion in 2024 and a remarkable increase to 200.6 USD Billion by 2035. This growth trajectory suggests a compound annual growth rate of 12.57% from 2025 to 2035, highlighting the increasing importance of sustainable chemicals in various sectors. The anticipated expansion is driven by factors such as rising consumer demand for eco-friendly products, regulatory support, and technological advancements in production processes. These projections underscore the potential for sustainable chemicals to play a crucial role in addressing environmental challenges while meeting market needs.

    Growing Demand for Eco-Friendly Products

    The increasing consumer awareness regarding environmental sustainability drives the Global Iceland Sustainable Chemicals Market Industry. As consumers become more conscious of their purchasing decisions, they tend to favor products that are derived from sustainable sources. This shift in consumer behavior is reflected in the market's projected growth, with the industry expected to reach 54.5 USD Billion in 2024. Companies are responding by innovating and developing eco-friendly alternatives to traditional chemicals, thereby enhancing their market presence and competitiveness. This trend not only supports environmental goals but also aligns with global initiatives aimed at reducing carbon footprints.

    Rising Global Awareness of Climate Change

    The escalating global awareness of climate change and its impacts is a driving force behind the Global Iceland Sustainable Chemicals Market Industry. As climate-related issues gain prominence, there is a collective push towards adopting sustainable practices across industries. This awareness translates into increased demand for sustainable chemicals that contribute to reducing carbon emissions and promoting environmental stewardship. The market's growth trajectory, projected to reach 54.5 USD Billion in 2024, reflects this heightened consciousness. Companies are increasingly aligning their strategies with sustainability goals, recognizing that addressing climate change is not only a moral imperative but also a business opportunity.

    Increased Investment in Renewable Resources

    The Global Iceland Sustainable Chemicals Market Industry is witnessing a surge in investments directed towards renewable resources. Investors are increasingly recognizing the potential of sustainable chemicals as a viable alternative to conventional products. This influx of capital is facilitating research and development initiatives aimed at enhancing the efficiency and scalability of sustainable chemical production. As a result, the market is poised for substantial growth, with projections indicating a rise to 200.6 USD Billion by 2035. This trend not only supports the transition towards a circular economy but also encourages collaboration among stakeholders to innovate and implement sustainable practices across various sectors.

    Regulatory Support for Sustainable Practices

    Government regulations promoting sustainable practices significantly influence the Global Iceland Sustainable Chemicals Market Industry. Policies aimed at reducing greenhouse gas emissions and encouraging the use of renewable resources create a favorable environment for sustainable chemical production. For instance, Iceland's commitment to sustainability is evident in its legislative framework that incentivizes the adoption of green technologies. This regulatory support is likely to propel the market forward, as companies adapt to comply with these regulations while also capitalizing on the growing demand for sustainable products. The anticipated market growth to 200.6 USD Billion by 2035 underscores the impact of these supportive measures.

    Technological Advancements in Chemical Production

    Innovations in chemical production technologies are pivotal in shaping the Global Iceland Sustainable Chemicals Market Industry. Advances such as biotechnological processes and green chemistry techniques enable the development of sustainable chemicals with reduced environmental impact. These technologies not only improve efficiency but also lower production costs, making sustainable options more accessible to manufacturers. As a result, the market is likely to experience a compound annual growth rate of 12.57% from 2025 to 2035. This technological evolution fosters a competitive landscape where companies can differentiate themselves through sustainable offerings, ultimately benefiting both the environment and their bottom lines.

    Market Segment Insights

    Sustainable Chemicals Product Insights

    Iceland’s sustainable chemicals market segmentation, based on product, includes bio-alcohols {bio-ethanol, bio-butanol, bio-methanol, and other bio-alcohols}, bio-ketones, bio-organic acids {bio-lactic acid, bio-citric acid, bio-adipic acid, bio-acetic acid, bio-acrylic acid, bio-succinic acid, and other bio-organic acids}, and bio-polymers {polylactic acid, bio-polyethylene, and other bio-polymers}. The bio-alcohol segment dominated the market mostly due to the growing demand for eco-friendly alternatives. Bio-alcohols, derived from renewable resources like biomass, serve as a key driver in this market. As industries seek cleaner and greener solutions, the adoption of bio-alcohols is accelerating, contributing to the overall sustainability of the chemical sector.

    However, bio-polymers are the fastest-growing category due to growing environmental concerns and regulatory shifts. Bio-polymers, derived from renewable resources, play a pivotal role in this growth. The increasing demand for eco-friendly alternatives in industries like packaging and textiles propels the market forward, fostering a transition towards more sustainable and bio-based solutions.

    Figure 1: Iceland’s Sustainable Chemicals Market, by Product, 2022 & 2032 (USD Billion)Source: Secondary Research, Primary Research, Market Research Future Database and Analyst Review

    Sustainable Chemicals Application Insights

    Iceland’s sustainable chemicals market segmentation, based on application, includes food & beverages, pharmaceutical, packaging, industrial & chemical, automotive, construction, and others. Food & beverage care held a major market share due to increasing awareness and demand for environmentally friendly alternatives. In the food and beverages sector, a key driver is the rising consumer preference for sustainable and organic products. The expanding popularity is driven by growing consumer demand for clean-label products, fostering a healthier and more environmentally conscious approach to food and beverage production.

    However, construction is the fastest-growing category due to the expanding awareness of environmental concerns in the construction sector. Demand for eco-friendly construction materials and practices has surged, compelling the industry to adopt bio-based ketones and bio-organic acids. These innovative solutions not only enhance construction materials but also align with the global push towards sustainability, positioning the market as a key player in the green transition of the construction industry.

    Sustainable Chemicals Country Insights

    The sustainable chemicals market in Iceland is thriving, propelled by a commitment to environmental stewardship and renewable resources. The nation's abundant geothermal energy serves as a key driver, fostering the production of bio-ketones and bio-organic acids. This synergy aligns with Iceland's emphasis on sustainable practices, driving innovation in eco-friendly chemical solutions. As global demand for environmentally conscious alternatives rises, Iceland's position as a sustainable chemicals hub strengthens, reflecting a harmonious blend of ecological awareness and economic growth.

    Get more detailed insights about Iceland Sustainable Chemicals Market Research Report - Forecast by 2032

    Regional Insights

    Key Players and Competitive Insights

    Leading market participants are investing heavily in research and development to enhance their product lines, which will help the sustainable chemicals market expand even more. Market participants are also undertaking numerous strategic activities to extend their footprint, with significant market developments including new product establishment, mergers and acquisitions, contractual agreements, and collaboration with other organizations. The sustainable chemicals industry must deliver cost-effective items to extend and stay in a more competitive and growing market climate.

    Major players in the sustainable chemicals market are attempting to expand market demand by investing in research and development operations, including Cargill Inc., Mitsubishi Chemical UK Limited, BIO-KLEEN PRODUCTS INC., BASF SE, DuPont Industrial, Bioscience, Dryvit Systems Inc, Anderson Corporation, Palmer Industries Inc., SILVER LINE BUILDING PRODUCTS LLC, Bayer Material Science AG, Balfour Beatty PLC, Thermafiber Inc., Kingspan Group, USG Corporation, Koninklijke DSM NV, Evonik Industries AG, SECOS Group Limited, Braskem SA, Huber Engineered Woods LLC, Aemetis, Inc., and Albemarle Corporation.

    Key Companies in the Iceland Sustainable Chemicals Market market include

    Industry Developments

    Future Outlook

    Iceland Sustainable Chemicals Market Future Outlook

    The Iceland Sustainable Chemicals Market is projected to grow at a 12.57% CAGR from 2024 to 2035, driven by regulatory support, technological advancements, and increasing consumer demand for eco-friendly products.

    New opportunities lie in:

    • Develop biobased alternatives to petrochemicals for industrial applications.
    • Invest in R&D for sustainable packaging solutions targeting consumer goods.
    • Collaborate with local industries to enhance circular economy initiatives.

    By 2035, the market is expected to achieve substantial growth, positioning itself as a leader in sustainable chemical innovations.

    Market Segmentation

    Sustainable Chemicals Product Outlook

    • Bio-Alcohols
    • Bio-Ethanol
    • Bio-Butanol
    • Bio-Methanol
    • Other Bio-Alcohols
    • Bio-Organic Acids
    • Bio-Lactic Acid
    • Bio-Acetic Acid
    • Bio-Citric Acid
    • Bio-Adipic Acid
    • Bio-Acrylic Acid
    • Bio-Succinic Acid
    • Other Bio-Organic Acids
    • Bio-Ketones
    • Bio-Polymers
    • Polylactic Acid
    • Bio-Polyethylene
    • Other Bio-Polymers
    • Others

    Sustainable Chemicals Application Outlook

    • Food & Beverages
    • Pharmaceutical
    • Packaging
    • Industrial & Chemical
    • Automotive
    • Construction
    • Others

    Report Scope

    Report Attribute/Metric Details
    Market Size 2023 USD 48.8 Billion
    Market Size 2023 USD 54.5 Billion
    Market Size 2032 USD 140.86 Billion
    Compound Annual Growth Rate (CAGR) 12.50% (2024-2032)
    Base Year 2023
    Market Forecast Period 2024-2032
    Historical Data 2018- 2022
    Market Forecast Units Value (USD Billion)
    Report Coverage Growth Factors, Revenue Forecast, Market Competitive Landscape, and Trends
    Segments Covered Type, Application, and Region
    Countries Covered Iceland
    Key Companies Profiled Cargill Inc., Mitsubishi Chemical UK Limited, BIO-KLEEN PRODUCTS INC., BASF SE, DuPont Industrial, Bioscience, Dryvit Systems Inc., Anderson Corporation, Palmer Industries Inc., SILVER LINE BUILDING PRODUCTS LLC, Bayer Material Science AG, Balfour Beatty PLC, Thermafiber Inc., Kingspan Group, USG Corporation, Koninklijke DSM NV, Evonik Industries AG, SECOS Group Limited, Braskem SA, Huber Engineered Woods LLC, Aemetis, Inc., and Albemarle Corporation.
    Key Market Opportunities The increasing demand for greener products
    Key Market Dynamics The development of advanced biotechnology. The growing need for cost-effective processing.

    Market Highlights

    Author

    Garvit Vyas
    Analyst

    She holds an experience of about 6+ years in market research and business consulting, working under the spectrum of information communication technology, telecommunications and semiconductor domains. aarti conceptualizes and implements a scalable business strategy and provides strategic leadership to the clients. her expertise lies in market estimation, competitive intelligence, pipeline analysis, customer assessment, etc.

    Leave a Comment

    Latest Comments

    John Doe
    john@example.com

    This is a great article! Really helped me understand the topic better.

    Posted on July 23, 2025, 10:15 AM
    Jane Smith
    jane@domain.com

    Thanks for sharing this. I’ve bookmarked it for later reference.

    Posted on July 22, 2025, 7:45 PM

    FAQs

    How much is the sustainable chemicals market?

    Iceland’s sustainable chemicals market size was valued at USD 48.8 Billion in 2023.

    What is the expansion rate of the sustainable chemicals market?

    The market is expected to rise at a CAGR of 12.50% during the forecast period, 2025-2035.

    Who are the key players in the sustainable chemicals market?

    The pivotal players in the market are Anderson Corporation, Palmer Industries Inc., SILVER LINE BUILDING PRODUCTS LLC, Thermafiber Inc., Huber Engineered Woods LLC, Bayer Material Science AG, Kingspan Group, USG Corporation, Koninklijke DSM NV, Evonik Industries AG, SECOS Group Limited, Braskem SA, Aemetis, Inc., and Albemarle Corporation

    Which product led the sustainable chemicals market?

    The bio-alcohols category dominated the market in 2022.

    Which application had the largest share in the sustainable chemicals market?

    The food & beverages category had the largest share of the market.

    1. MARKET DYNAMICS
      1. \r\n4.1. Overview
      2. \r\n4.2. Drivers
      3. \r\n4.3. Restraints
      4. \r\n4.4.
      5. Opportunities
      6. \r\n5. MARKET FACTOR ANALYSIS
      7. \r\n5.1. Value Chain Analysis
      8. \r\n5.2.
      9. Porter’s Five Forces Analysis
      10. \r\n5.2.1. Bargaining Power of Suppliers
      11. \r\n5.2.2.
      12. Bargaining Power of Buyers
      13. \r\n5.2.3. Threat of New Entrants
      14. \r\n5.2.4.
      15. Threat of Substitutes
      16. \r\n5.2.5. Intensity of Rivalry
      17. \r\n5.3. COVID-19
      18. Impact Analysis
      19. \r\n5.3.1. Market Impact Analysis
      20. \r\n5.3.2. Country
      21. Impact
      22. \r\n5.3.3. Opportunity and Threat Analysis
      23. \r\n6. ICELAND SUSTAINABLE
    2. CHEMICALS MARKET, BY PRODUCT
      1. \r\n6.1. Overview
      2. \r\n6.2. Bio-Alcohols
      3. \r\n6.2.1.
      4. Bio-Ethanol
      5. \r\n6.2.2. Bio-Butanol
      6. \r\n6.2.3. Bio-Methanol
      7. \r\n6.2.4.
      8. Other Bio-Alcohols
      9. \r\n6.3. Bio-Ketons
      10. \r\n6.4. Bio-Polymers
      11. \r\n6.4.1.
      12. Polylactic Acid
      13. \r\n6.4.2. Bio-Polyethylene
      14. \r\n6.4.3. Other Bio-Polymers
      15. \r\n6.5.
      16. Bio-Organic Acids
      17. \r\n6.5.1. Bio-Lactic Acid
      18. \r\n6.5.2. Bio-Acetic Acid
      19. \r\n6.5.3.
      20. Bio-Citric Acid
      21. \r\n6.5.4. Bio-Adipic Acid
      22. \r\n6.5.5. Bio-Acrylic Acid
      23. \r\n6.5.6.
      24. Bio-Succinic Acid
      25. \r\n6.5.7. Other Bio-Organic Acids
      26. \r\n6.6. Others
      27. \r\n7.
    3. ICELAND SUSTAINABLE CHEMICALS MARKET, BY APPLICATIONS
      1. \r\n7.1. Overview
      2. \r\n7.2.
      3. Food & Beverages
      4. \r\n7.3. Pharmaceutical
      5. \r\n7.4. Packaging
      6. \r\n7.5.
      7. Industrial & Chemical
      8. \r\n7.6. Automotive
      9. \r\n7.7. Construction
      10. \r\n7.8.
      11. Others
      12. \r\n8. COMPETITIVE LANDSCAPE
      13. \r\n8.1. Overview
      14. \r\n8.2.
      15. Competitive Analysis
      16. \r\n8.3. Market Share Analysis
      17. \r\n8.4. Major Growth
      18. Strategy in the Iceland Sustainable Chemicals Market,
      19. \r\n8.5. Competitive
      20. Benchmarking
      21. \r\n8.6. Leading Players in Terms of Number of Developments in
      22. the Iceland Sustainable Chemicals Market,
      23. \r\n8.7. Key developments and Growth
      24. Strategies
      25. \r\n8.7.1. New Product Launch/Service Deployment
      26. \r\n8.7.2.
      27. Merger & Acquisitions
      28. \r\n8.7.3. Joint Ventures
      29. \r\n8.8. Major Players
      30. Financial Matrix
      31. \r\n8.8.1. Sales & Operating Income, 2022
      32. \r\n8.8.2.
      33. Major Players R&D Expenditure. 2022
      34. \r\n9. COMPANY PROFILES
      35. \r\n9.1.
      36. Cargill Inc.
      37. \r\n9.1.1. Company Overview
      38. \r\n9.1.2. Financial Overview
      39. \r\n9.1.3.
      40. Products Offered
      41. \r\n9.1.4. Key Developments
      42. \r\n9.1.5. SWOT Analysis
      43. \r\n9.1.6.
      44. Key Strategies
      45. \r\n9.2. Mitsubishi Chemical UK Limited
      46. \r\n9.2.1. Company
      47. Overview
      48. \r\n9.2.2. Financial Overview
      49. \r\n9.2.3. Products Offered
      50. \r\n9.2.4.
      51. Key Developments
      52. \r\n9.2.5. SWOT Analysis
      53. \r\n9.2.6. Key Strategies
      54. \r\n9.3.
      55. BIO-KLEEN PRODUCTS INC.
      56. \r\n9.3.1. Company Overview
      57. \r\n9.3.2. Financial
      58. Overview
      59. \r\n9.3.3. Products Offered
      60. \r\n9.3.4. Key Developments
      61. \r\n9.3.5.
      62. SWOT Analysis
      63. \r\n9.3.6. Key Strategies
      64. \r\n9.4. BASF SE
      65. \r\n9.4.1.
      66. Company Overview
      67. \r\n9.4.2. Financial Overview
      68. \r\n9.4.3. Products Offered
      69. \r\n9.4.4.
      70. Key Developments
      71. \r\n9.4.5. SWOT Analysis
      72. \r\n9.4.6. Key Strategies
      73. \r\n9.5.
      74. Balfour Beatty PLC
      75. \r\n9.5.1. Company Overview
      76. \r\n9.5.2. Financial
      77. Overview
      78. \r\n9.5.3. Products Offered
      79. \r\n9.5.4. Key Developments
      80. \r\n9.5.5.
      81. SWOT Analysis
      82. \r\n9.5.6. Key Strategies
      83. \r\n9.6. DuPont Industrial
      84. \r\n9.6.1.
      85. Company Overview
      86. \r\n9.6.2. Financial Overview
      87. \r\n9.6.3. Products Offered
      88. \r\n9.6.4.
      89. Key Developments
      90. \r\n9.6.5. SWOT Analysis
      91. \r\n9.6.6. Key Strategies
      92. \r\n9.7.
      93. Biosciences
      94. \r\n9.7.1. Company Overview
      95. \r\n9.7.2. Financial Overview
      96. \r\n9.7.3.
      97. Products Offered
      98. \r\n9.7.4. Key Developments
      99. \r\n9.7.5. SWOT Analysis
      100. \r\n9.7.6.
      101. Key Strategies
      102. \r\n9.8. Dryvit Systems Inc
      103. \r\n9.8.1. Company Overview
      104. \r\n9.8.2.
      105. Financial Overview
      106. \r\n9.8.3. Products Offered
      107. \r\n9.8.4. Key Developments
      108. \r\n9.8.5.
      109. SWOT Analysis
      110. \r\n9.8.6. Key Strategies
      111. \r\n9.9. Anderson Corporation
      112. \r\n9.9.1.
      113. Company Overview
      114. \r\n9.9.2. Financial Overview
      115. \r\n9.9.3. Products Offered
      116. \r\n9.9.4.
      117. Key Developments
      118. \r\n9.9.5. SWOT Analysis
      119. \r\n9.9.6. Key Strategies
      120. \r\n9.10.
      121. Palmer Industries Inc.
      122. \r\n9.10.1. Company Overview
      123. \r\n9.10.2. Financial
      124. Overview
      125. \r\n9.10.3. Products Offered
      126. \r\n9.10.4. Key Developments
      127. \r\n9.10.5.
      128. SWOT Analysis
      129. \r\n9.10.6. Key Strategies
      130. \r\n9.11. SILVER LINE BUILDING
      131. PRODUCTS LLC
      132. \r\n9.11.1. Company Overview
      133. \r\n9.11.2. Financial Overview
      134. \r\n9.11.3.
      135. Products Offered
      136. \r\n9.11.4. Key Developments
      137. \r\n9.11.5. SWOT Analysis
      138. \r\n9.11.6.
      139. Key Strategies
      140. \r\n9.12. Thermafiber Inc.
      141. \r\n9.12.1. Company Overview
      142. \r\n9.12.2.
      143. Financial Overview
      144. \r\n9.12.3. Products Offered
      145. \r\n9.12.4. Key Developments
      146. \r\n9.12.5.
      147. SWOT Analysis
      148. \r\n9.12.6. Key Strategies
      149. \r\n9.13. Huber Engineered
      150. Woods LLC
      151. \r\n9.13.1. Company Overview
      152. \r\n9.13.2. Financial Overview
      153. \r\n9.13.3.
      154. Products Offered
      155. \r\n9.13.4. Key Developments
      156. \r\n9.13.5. SWOT Analysis
      157. \r\n9.13.6.
      158. Key Strategies
      159. \r\n9.14. Bayer Material Science AG
      160. \r\n9.14.1. Company
      161. Overview
      162. \r\n9.14.2. Financial Overview
      163. \r\n9.14.3. Products Offered
      164. \r\n9.14.4.
      165. Key Developments
      166. \r\n9.14.5. SWOT Analysis
      167. \r\n9.14.6. Key Strategies
      168. \r\n9.15.
      169. Kingspan Group
      170. \r\n9.15.1. Company Overview
      171. \r\n9.15.2. Financial Overview
      172. \r\n9.15.3.
      173. Products Offered
      174. \r\n9.15.4. Key Developments
      175. \r\n9.15.5. SWOT Analysis
      176. \r\n9.15.6.
      177. Key Strategies
      178. \r\n9.16. USG Corporation
      179. \r\n9.16.1. Company Overview
      180. \r\n9.16.2.
      181. Financial Overview
      182. \r\n9.16.3. Products Offered
      183. \r\n9.16.4. Key Developments
      184. \r\n9.16.5.
      185. SWOT Analysis
      186. \r\n9.16.6. Key Strategies
      187. \r\n9.17. Koninklijke DSM NV
      188. \r\n9.17.1.
      189. Company Overview
      190. \r\n9.17.2. Financial Overview
      191. \r\n9.17.3. Products
      192. Offered
      193. \r\n9.17.4. Key Developments
      194. \r\n9.17.5. SWOT Analysis
      195. \r\n9.17.6.
      196. Key Strategies
      197. \r\n9.18. Evonik Industries AG
      198. \r\n9.18.1. Company Overview
      199. \r\n9.18.2.
      200. Financial Overview
      201. \r\n9.18.3. Products Offered
      202. \r\n9.18.4. Key Developments
      203. \r\n9.18.5.
      204. SWOT Analysis
      205. \r\n9.18.6. Key Strategies
      206. \r\n9.19. SECOS Group Limited
      207. \r\n9.19.1.
      208. Company Overview
      209. \r\n9.19.2. Financial Overview
      210. \r\n9.19.3. Products
      211. Offered
      212. \r\n9.19.4. Key Developments
      213. \r\n9.19.5. SWOT Analysis
      214. \r\n9.19.6.
      215. Key Strategies
      216. \r\n9.20. Braskem SA
      217. \r\n9.20.1. Company Overview
      218. \r\n9.20.2.
      219. Financial Overview
      220. \r\n9.20.3. Products Offered
      221. \r\n9.20.4. Key Developments
      222. \r\n9.20.5.
      223. SWOT Analysis
      224. \r\n9.20.6. Key Strategies
      225. \r\n9.21. Aemetis, Inc.
      226. \r\n9.21.1.
      227. Company Overview
      228. \r\n9.21.2. Financial Overview
      229. \r\n9.21.3. Products
      230. Offered
      231. \r\n9.21.4. Key Developments
      232. \r\n9.21.5. SWOT Analysis
      233. \r\n9.21.6.
      234. Key Strategies
      235. \r\n9.22. Albemarle Corporation
      236. \r\n9.22.1. Company Overview
      237. \r\n9.22.2.
      238. Financial Overview
      239. \r\n9.22.3. Products Offered
      240. \r\n9.22.4. Key Developments
      241. \r\n9.22.5.
      242. SWOT Analysis
      243. \r\n9.22.6. Key Strategies
      244. \r\n10. APPENDIX
      245. \r\n10.1.
      246. References
      247. \r\n10.2. Related Reports
      248. \r\n 
      249. \r\nLIST OF TABLES
      250. \r\nTABLE
    4. ICELAND: SUSTAINABLE CHEMICALS MARKET, BY PRODUCT, 2018-2032 (USD BILLION)
      1. \r\nTABLE
    5. ICELAND: SUSTAINABLE CHEMICALS MARKET, BY APPLICATIONS, 2018-2032 (USD BILLION)
      1. \r\nLIST
    6. OF FIGURES
      1. \r\nFIGURE 1 RESEARCH PROCESS
      2. \r\nFIGURE 2 MARKET STRUCTURE
    7. FOR THE ICELAND SUSTAINABLE CHEMICALS MARKET
      1. \r\nFIGURE 3 MARKET DYNAMICS
    8. FOR THE ICELAND SUSTAINABLE CHEMICALS MARKET
      1. \r\nFIGURE 4 ICELAND: SUSTAINABLE
    9. CHEMICALS MARKET, SHARE (%), BY PRODUCT, 2022
      1. \r\nFIGURE 5 ICELAND: SUSTAINABLE
    10. CHEMICALS MARKET, SHARE (%), BY APPLICATIONS, 2022
      1. \r\nFIGURE 6 ICELAND: SUSTAINABLE
    11. CHEMICALS MARKET, SHARE (%), BY COUNTRY, 2022
      1. \r\nFIGURE 7 ICELAND SUSTAINABLE
      2. CHEMICALS MARKET: COMPANY SHARE ANALYSIS, 2022 (%)
      3. \r\nFIGURE 8 CARGILL INC.:
      4. FINANCIAL OVERVIEW SNAPSHOT
      5. \r\nFIGURE 9 CARGILL INC.: SWOT ANALYSIS
      6. \r\nFIGURE
    12. MITSUBISHI CHEMICAL UK LIMITED: FINANCIAL OVERVIEW SNAPSHOT
      1. \r\nFIGURE
    13. MITSUBISHI CHEMICAL UK LIMITED: SWOT ANALYSIS
      1. \r\nFIGURE 12 BIO-KLEEN PRODUCTS
      2. INC.: FINANCIAL OVERVIEW SNAPSHOT
      3. \r\nFIGURE 13 BIO-KLEEN PRODUCTS INC.: SWOT
      4. ANALYSIS
      5. \r\nFIGURE 14 BASF SE: FINANCIAL OVERVIEW SNAPSHOT
      6. \r\nFIGURE
    14. BASF SE: SWOT ANALYSIS
      1. \r\nFIGURE 16 BALFOUR BEATTY PLC: FINANCIAL OVERVIEW
      2. SNAPSHOT
      3. \r\nFIGURE 17 BALFOUR BEATTY PLC: SWOT ANALYSIS
      4. \r\nFIGURE
    15. DUPONT INDUSTRIAL.: FINANCIAL OVERVIEW SNAPSHOT
      1. \r\nFIGURE 19 DUPONT INDUSTRIAL.:
    16. SWOT ANALYSIS
      1. \r\nFIGURE 20 BIOSCIENCES: FINANCIAL OVERVIEW SNAPSHOT
      2. \r\nFIGURE
    17. BIOSCIENCES: SWOT ANALYSIS
      1. \r\nFIGURE 22 DRYVIT SYSTEMS INC: FINANCIAL
      2. OVERVIEW SNAPSHOT
      3. \r\nFIGURE 23 DRYVIT SYSTEMS INC: SWOT ANALYSIS
      4. \r\nFIGURE
    18. ANDERSON CORPORATION: FINANCIAL OVERVIEW SNAPSHOT
      1. \r\nFIGURE 25 ANDERSON
      2. CORPORATION: SWOT ANALYSIS
      3. \r\nFIGURE 26 PALMER INDUSTRIES INC.: FINANCIAL
      4. OVERVIEW SNAPSHOT
      5. \r\nFIGURE 27 PALMER INDUSTRIES INC.: SWOT ANALYSIS
      6. \r\nFIGURE
    19. SILVER LINE BUILDING PRODUCTS LLC: FINANCIAL OVERVIEW SNAPSHOT
      1. \r\nFIGURE
    20. SILVER LINE BUILDING PRODUCTS LLC: SWOT ANALYSIS
      1. \r\nFIGURE 30 THERMAFIBER
      2. INC.: FINANCIAL OVERVIEW SNAPSHOT
      3. \r\nFIGURE 31 THERMAFIBER INC.: SWOT ANALYSIS
      4. \r\nFIGURE
    21. HUBER ENGINEERED WOODS LLC.: FINANCIAL OVERVIEW SNAPSHOT
      1. \r\nFIGURE 33
      2. HUBER ENGINEERED WOODS LLC.: SWOT ANALYSIS
      3. \r\nFIGURE 34 BAYER MATERIAL SCIENCE
      4. AG: FINANCIAL OVERVIEW SNAPSHOT
      5. \r\nFIGURE 35 BAYER MATERIAL SCIENCE AG: SWOT
      6. ANALYSIS
      7. \r\nFIGURE 36 KINGSPAN GROUP: FINANCIAL OVERVIEW SNAPSHOT
      8. \r\nFIGURE
    22. KINGSPAN GROUP: SWOT ANALYSIS
      1. \r\nFIGURE 38 USG CORPORATION: FINANCIAL
      2. OVERVIEW SNAPSHOT
      3. \r\nFIGURE 39 USG CORPORATION: SWOT ANALYSIS
      4. \r\nFIGURE
    23. KONINKLIJKE DSM NV: FINANCIAL OVERVIEW SNAPSHOT
      1. \r\nFIGURE 41 KONINKLIJKE
      2. DSM NV: SWOT ANALYSIS
      3. \r\nFIGURE 42 EVONIK INDUSTRIES AG: FINANCIAL OVERVIEW
      4. SNAPSHOT
      5. \r\nFIGURE 43 EVONIK INDUSTRIES AG: SWOT ANALYSIS
      6. \r\nFIGURE
    24. BRASKEM SA: FINANCIAL OVERVIEW SNAPSHOT
      1. \r\nFIGURE 45 BRASKEM SA: SWOT
      2. ANALYSIS
      3. \r\nFIGURE 46 SECOS GROUP LIMITED: FINANCIAL OVERVIEW SNAPSHOT
      4. \r\nFIGURE
    25. SECOS GROUP LIMITED: SWOT ANALYSIS
      1. \r\nFIGURE 48 AEMETIS, INC.: FINANCIAL
      2. OVERVIEW SNAPSHOT
      3. \r\nFIGURE 49 AEMETIS, INC.: SWOT ANALYSIS
      4. \r\nFIGURE
    26. ALBEMARLE CORPORATION: FINANCIAL OVERVIEW SNAPSHOT
      1. \r\nFIGURE 51 ALBEMARLE
      2. CORPORATION: SWOT ANALYSIS

    Iceland Sustainable Chemicals Market Segmentation

    Market Segmentation Overview

    • Detailed segmentation data will be available in the full report
    • Comprehensive analysis by multiple parameters
    • Regional and country-level breakdowns
    • Market size forecasts by segment
    Infographic

    Free Sample Request

    Kindly complete the form below to receive a free sample of this Report

    Get Free Sample

    Customer Strories

    “I am very pleased with how market segments have been defined in a relevant way for my purposes (such as "Portable Freezers & refrigerators" and "last-mile"). In general the report is well structured. Thanks very much for your efforts.”

    Victoria Milne

    Founder
    Case Study
    Chemicals and Materials