• Cat-intel
  • MedIntelliX
  • Resources
  • About Us
  • Hero Background
    English
    Chinese
    French
    Japanese
    Korean
    German
    Spanish

    Hyper-converged Infrastructure Market Size

    ID: MRFR/SEM/4664-HCR
    100 Pages
    Shubham Munde
    October 2025

    Hyper-Converged Infrastructure Market Research Report: By Hypervisor Type (VMware, KVM, Hyper-V), By Application (Virtual Desktop Infrastructure, Server Virtualization, Data Protection, Remote Office, Cloud), and By Regional (North America, Europe, South America, Asia Pacific, Middle East and Africa) - Forecast to 2035.

    Share:
    Download PDF ×

    We do not share your information with anyone. However, we may send you emails based on your report interest from time to time. You may contact us at any time to opt-out.

    Hyper-converged Infrastructure Market Infographic
    $ 4,950.0
    $ 5,950.0
    $ 7,250.0

    Hyper Converged Infrastructure Size

    Hyper-converged Infrastructure Market Growth Projections and Opportunities

    The hyper-converged infrastructure (HCI) marketplace is influenced by a myriad of market elements that collectively form its trajectory and boom. One of the pivotal elements is the increasing demand for scalable and agile IT solutions. As corporations strive to evolve to dynamic commercial enterprise environments, the need for infrastructure that can, without problems, scale to satisfy evolving workloads becomes paramount. The evolving panorama of digital transformation is a first-rate market element influencing HCI adoption. As corporations go through virtual variations to stay competitive, they require IT infrastructure that can assist modern-day packages, facilitate cloud integration, and provide the agility wished for innovation. Security issues rank among many of the marketplace factors shaping the HCI landscape. With the growing cost of facts and the sophistication of cyber threats, businesses prioritize answers that offer robust security functions. Hyper-converged infrastructure companies recognize this and are actively incorporating superior security measures, which include encryption, authentication protocols, and threat detection mechanisms, into their services. Vendor competition and innovation are dynamic marketplace elements using non-stop development in HCI answers. A diverse variety of companies, from prominent enterprise leaders to rising gamers, contributes to an aggressive landscape. Market factors also include the impact of worldwide financial conditions and geopolitical concerns. Economic fluctuations and geopolitical activities can impact IT spending and the pace of infrastructure investments. Organizations might also alter their strategies based on economic uncertainties, impacting the overall call for hyper-converged infrastructure solutions. In conclusion, the hyper-converged infrastructure market is formed by using a complex interplay of factors, consisting of the need for scalable and agile solutions, fee considerations, the impact of digital transformation, protection issues, seller opposition and innovation, technological improvements, and broader economic and geopolitical conditions.

    Hyper-converged Infrastructure Market Size Graph

    Market Summary

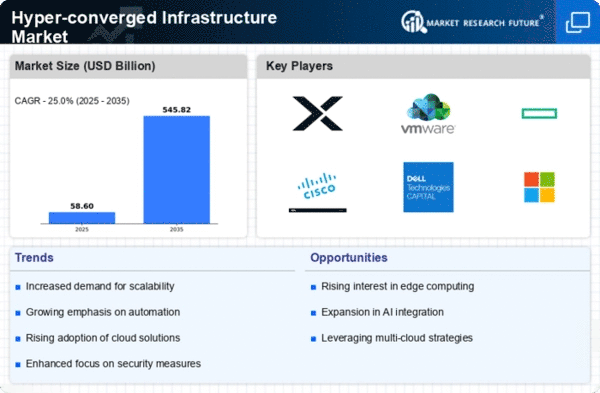
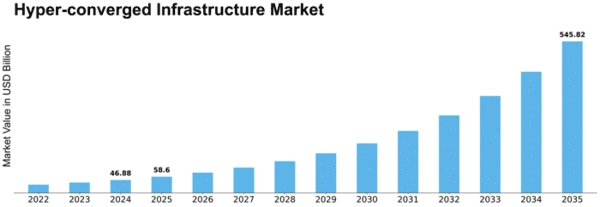
    The Global Hyper-Converged Infrastructure Market is projected to experience substantial growth from 46.88 USD Billion in 2024 to 545.82 USD Billion by 2035.

    Key Market Trends & Highlights

    Hyper-Converged Infrastructure Key Trends and Highlights

    • The market is expected to grow at a compound annual growth rate of 25.0 percent from 2025 to 2035. By 2035, the market valuation is anticipated to reach 545.8 USD Billion, indicating a robust expansion. in 2024, the market is valued at 46.88 USD Billion, reflecting a strong foundation for future growth. Growing adoption of hyper-converged infrastructure due to the increasing demand for efficient data management is a major market driver.

    Market Size & Forecast

    2024 Market Size 46.88 (USD Billion)
    2035 Market Size 545.82 (USD Billion)
    CAGR (2025-2035) 25.00%
    Largest Regional Market Share in 2024 latin_america)

    Major Players

    <p>HPE, Scale Computing, Microsoft, Lenovo, Synergy Resources, Citrix, OpenStack, Cisco, VMware, Nutanix, NetApp, Pure Storage, Zyter, Dell Technologies</p>

    Market Trends

    The growing need for effective, scalable, and affordable IT solutions is driving notable trends in the Hyper-Converged Infrastructure Market. Hyper-converged infrastructure streamlines the IT environment by combining networking, compute, and storage into a single solution, which is why many enterprises are moving to it.

    Small and medium-sized businesses seeking to boost agility and save operating expenses may find this simplicity of management especially appealing. Additionally, as companies look to implement cloud computing and virtualization technologies that hyper-converged systems inherently enable, the drive for digital transformation across several industries is increasing the need for such integrated systems.

    The necessity for sophisticated IT infrastructures that can easily facilitate remote access and communication has increased due to the increased emphasis on remote work and distributed teams, which has been hastened by recent world events.

    Because of its simplicity and dependability, hyper-converged infrastructure shines out in businesses that prioritize safe and robust operations. In sectors like government, healthcare, and education, where businesses are increasingly searching for infrastructures that facilitate scalability without sacrificing security, there are significant potential to investigate.

    This trend is further reinforced by international efforts to enhance digital infrastructure and connectivity, underscoring the importance of hyper-converged systems in enabling new services and applications. Companies will need to invest in R&D for improved functions if they want to remain relevant in this changing market environment.


    <p>The evolution of Hyper-Converged Infrastructure is reshaping the IT landscape, as organizations increasingly seek integrated solutions that enhance operational efficiency and reduce complexity.</p>

    U.S. Department of Commerce

    Hyper-converged Infrastructure Market Market Drivers

    Market Growth Projections

    The Global Hyper-Converged Infrastructure Market Industry is poised for substantial growth, with projections indicating a market size of 46.9 USD Billion in 2024 and an anticipated increase to 545.8 USD Billion by 2035. This growth trajectory reflects a compound annual growth rate (CAGR) of 25.0% from 2025 to 2035. Such figures suggest a robust demand for hyper-converged solutions as organizations increasingly recognize the benefits of integrated IT infrastructure. The market's expansion is likely to be fueled by various factors, including the need for simplified management, cost efficiency, and enhanced security. As businesses continue to evolve, the hyper-converged infrastructure market appears well-positioned for sustained growth.

    Scalability and Flexibility

    Scalability and flexibility are critical attributes driving the Global Hyper-Converged Infrastructure Market Industry. Organizations are increasingly facing fluctuating workloads and the need for rapid scalability to accommodate growth. HCI solutions provide the ability to scale resources seamlessly, allowing businesses to add or remove capacity as needed without significant disruption. This adaptability is particularly beneficial for enterprises operating in dynamic environments, where demand can change rapidly. The flexibility of HCI also enables organizations to deploy applications in various configurations, catering to specific business needs. As the market is expected to grow at a CAGR of 25.0% from 2025 to 2035, scalability will likely remain a key consideration for enterprises.

    Increased Adoption of Cloud Services

    The rise of cloud computing is a significant driver of the Global Hyper-Converged Infrastructure Market Industry. Organizations are increasingly adopting hybrid and multi-cloud strategies to leverage the benefits of both on-premises and cloud environments. HCI solutions facilitate this transition by providing a unified platform that integrates seamlessly with cloud services. This integration allows businesses to manage workloads across different environments efficiently, enhancing operational agility. As enterprises seek to optimize their cloud investments and ensure data security, the demand for HCI solutions that support cloud integration is likely to grow. The market's trajectory suggests a potential reach of 545.8 USD Billion by 2035, underscoring the importance of cloud adoption.

    Enhanced Data Security and Compliance

    Data security and compliance are paramount concerns for organizations, driving the Global Hyper-Converged Infrastructure Market Industry. With increasing regulatory requirements and the growing threat of cyberattacks, businesses are prioritizing solutions that offer robust security features. HCI solutions often come with built-in security measures, such as encryption and access controls, which help organizations safeguard sensitive data. Furthermore, the centralized management capabilities of HCI facilitate compliance with various regulations by providing comprehensive visibility and control over data. As organizations navigate the complexities of data protection, the demand for hyper-converged infrastructure that addresses these challenges is likely to rise, contributing to the overall market growth.

    Cost Efficiency and Resource Optimization

    Cost efficiency remains a pivotal driver in the Global Hyper-Converged Infrastructure Market Industry. Organizations are increasingly recognizing the financial benefits of adopting HCI solutions, which often lead to reduced capital expenditures and lower operational costs. By integrating various IT functions into a single platform, companies can minimize the need for extensive hardware investments and reduce energy consumption. Furthermore, HCI solutions often come with simplified licensing models, which can lead to predictable budgeting. This financial advantage is particularly appealing to small and medium-sized enterprises looking to optimize their IT spending while maintaining performance. As the market evolves, the potential for cost savings will likely continue to attract new adopters.

    Growing Demand for Simplified IT Management

    The Global Hyper-Converged Infrastructure Market Industry experiences a surge in demand for simplified IT management solutions. Organizations are increasingly seeking to streamline their IT operations, reduce complexity, and enhance efficiency. Hyper-converged infrastructure (HCI) offers an integrated approach that combines storage, computing, and networking into a single solution. This consolidation not only reduces the need for multiple hardware components but also simplifies management through centralized control. As a result, businesses can allocate resources more effectively and respond to changing demands swiftly. The market is projected to reach 46.9 USD Billion in 2024, indicating a robust growth trajectory driven by this demand.
    Market Segment Insights

    Hyper-Converged Infrastructure Market Hypervisor Type Insights

    <p>The Hyper-Converged Infrastructure Market witnessed significant growth, driven by the rising demand for efficient IT infrastructures that combined storage, computing, and networking resources. In the realm of Hypervisor Type, major contributions came from VMware, KVM, and Hyper-V.</p>

    <p>In 2024, VMware held a significant market valuation of 18.0 USD billion, underscoring its position as a leading player within the hypervisor landscape, thanks to its widely adopted virtualization technology that optimized data center performance.</p>

    <p>KVM closely followed, with a market valuation of 14.5 USD billion, marking its critical role in the hyper-converged infrastructure domain; its open-source nature appealed to organizations looking for flexibility and cost-effectiveness.</p>

    Hyper-Converged Infrastructure Market Application Insights

    <p>The market is characterized by various application domains, including <a href="https://www.marketresearchfuture.com/reports/virtual-desktop-market-2639">Virtual Desktop</a> Infrastructure, Server Virtualization, Data Protection, Remote Office, and Cloud services. These applications are vital as they enhance operational efficiency and drive cost savings for organizations in diverse sectors.</p>

    <p>Virtual Desktop Infrastructure allows businesses to centralize desktop management, ensuring developers can easily deploy updates and maintain security protocols. Server Virtualization supports high utilization rates and optimizes hardware resources, which is crucial in today's data-centric environment.</p>

    <p>In terms of market trends, the growing importance of data protection cannot be ignored, particularly as enterprises prioritize safeguarding their information against increasing cyber threats. The Remote Office application facilitates seamless collaboration and communication, thereby catering to the rising demand for remote work solutions worldwide.</p>

    Get more detailed insights about Hyper-converged Infrastructure Market Research Report – Forecast to 2034

    Regional Insights

    Key Players and Competitive Insights

    The Hyper-Converged Infrastructure Market is characterized by rapid technological advancements and intensifying competition among key players. This market encompasses a broad spectrum of solutions that integrate compute, storage, and networking functionalities into a single appliance, promoting operational efficiency and simplified management.

    As enterprises seek to optimize their IT environments, the competition becomes more pronounced, leading to an influx of innovative products and strategic partnerships aimed at improving service delivery and addressing diverse customer needs.

    The continuous evolution of cloud computing and virtualization technologies further propels market growth, forcing companies to adopt agile strategies to retain market share while ensuring scalability and security in their offerings.

    HPE has established itself as a formidable player in the Hyper-Converged Infrastructure Market, leveraging its extensive portfolio and expertise in IT solutions. The company's strengths in providing scalable and tailored solutions allow it to cater effectively to the diverse needs of businesses, ranging from small enterprises to large corporations.

    HPE's investments in innovation enable it to deliver cutting-edge technology, enhancing the operational efficiency of its hyper-converged offerings. Additionally, HPE benefits from a well-established network of global partnerships and a robust customer base, which fortifies its market presence.

    The company's commitment to sustainability and customer-centric approach further enhance its competitive edge, making it a preferred choice for clients looking for reliable hyper-converged infrastructure solutions.

    Scale Computing has made significant strides in the Hyper-Converged Infrastructure Market by focusing on simplifying IT environments for small to medium-sized enterprises. The company is renowned for its HC3 platform, which integrates virtualization, storage, and management into a cohesive system designed to reduce complexity and costs.

    Scale Computing's strengths lie in its ability to provide user-friendly solutions that require minimal IT expertise, making it a popular choice in sectors where resources are limited. The company's strategic approach to partnerships and its emphasis on customer service further enhance its visibility in the global market.

    In recent years, Scale Computing has pursued mergers and acquisitions to bolster its product offerings and expand its market reach, enabling it to capture a larger share of the hyper-converged infrastructure space on a global scale.

    Key Companies in the Hyper-converged Infrastructure Market market include

    Industry Developments

    HPE positioned its dHCI as a fully integrated hyper-converged infrastructure solution in May 2025 with the release of its Private Cloud Business Edition, which is powered by HPE Morpheus software and offers multi-hypervisor support and AI-driven AIOps.

    With the integration of edge hyper-converged installations with unified administration and on-demand scaling, HPE GreenLake extended support for Alletra MP and SimpliVity Gen11 in April 2024. Cisco released NFVI 2.0, a next-generation Virtual Network Function Manager that supports Open RAN and multi-cloud use cases, in March 2024.

    In June 2025, it debuted NFV-as-a-Service, which makes VNF implementation easier everywhere. Cisco introduced AI-Ready Secure Network Architecture with IOS XE Automation in June 2025 as well, allowing for harmonized, AI-driven operations across campuses, branches, and clouds.

    In addition to releasing NCI Compute with Dell PowerFlex and Pure Storage connectors and previewing Nutanix Cloud Clusters on Google Cloud, Nutanix also unveiled Cloud Native AOS in May 2025, allowing enterprise data services for Kubernetes and bare-metal environments.

    With Terraform integration and Azure networking API improvements, Microsoft Azure expanded hybrid-cloud networking and multi-cloud infrastructure automation in June 2025.

    Future Outlook

    Hyper-converged Infrastructure Market Future Outlook

    <p>The Hyper-Converged Infrastructure Market is projected to grow at a 25.00% CAGR from 2025 to 2035, driven by increasing demand for cloud solutions, operational efficiency, and scalability.</p>

    New opportunities lie in:

    • <p>Develop AI-driven management tools for enhanced operational efficiency. Expand offerings in edge computing to capture emerging market segments. Leverage partnerships with cloud service providers to enhance service delivery.</p>

    <p>By 2035, the Hyper-Converged Infrastructure Market is expected to achieve substantial growth, solidifying its role in IT infrastructure.</p>

    Market Segmentation

    Hyper-Converged Infrastructure Market Regional Outlook

    • North America
    • Europe
    • South America
    • Asia Pacific
    • Middle East and Africa

    Hyper-Converged Infrastructure Market Application Outlook

    • {""=>["North America"
    • "Europe"
    • "South America"
    • "Asia Pacific"
    • "Middle East and Africa"]}

    Hyper-Converged Infrastructure Market Hypervisor Type Outlook

    • {""=>["Virtual Desktop Infrastructure"
    • "Server Virtualization"
    • "Data Protection"
    • "Remote Office"
    • "Cloud"]}

    Report Scope

    Hyper-Converged Infrastructure Market Report Scope

    Report Attribute/Metric Details
    Market Size 2024 46.88(USD billion)
    Market Size 2035 545.82 (USD billion)
    Compound Annual Growth Rate (CAGR) 25.00% (2025 - 2035)
    Report Coverage Revenue Forecast, Competitive Landscape, Growth Factors, and Trends
    Base Year 2024
    Market Forecast Period 2025 - 2035
    Historical Data 2019 - 2024
    Market Forecast Units USD billion
    Key Companies Profiled HPE, Scale Computing, Microsoft, Lenovo, Synergy Resources, Citrix, OpenStack, Cisco, VMware, Nutanix, NetApp, Pure Storage, Zyter, Dell Technologies
    Segments Covered Hypervisor Type, Application, Regional
    Key Market Opportunities Increased demand for cloud integration, Growth in remote work solutions, Rising adoption of edge computing, Expansion in AI and machine learning, Need for simplified IT management
    Key Market Dynamics Scalability and flexibility, Cost efficiency, Simplified management, Increased demand for virtualization, Enhanced data protection
    Countries Covered North America, Europe, APAC, South America, MEA
    Market Size 2025 58.60 (USD billion)


    Market Highlights

    Author

    Shubham Munde
    Research Analyst Level II

    She holds an experience of about 6+ years in market research and business consulting, working under the spectrum of information communication technology, telecommunications and semiconductor domains. aarti conceptualizes and implements a scalable business strategy and provides strategic leadership to the clients. her expertise lies in market estimation, competitive intelligence, pipeline analysis, customer assessment, etc.

    Leave a Comment

    Latest Comments

    John Doe
    john@example.com

    This is a great article! Really helped me understand the topic better.

    Posted on July 23, 2025, 10:15 AM
    Jane Smith
    jane@domain.com

    Thanks for sharing this. I’ve bookmarked it for later reference.

    Posted on July 22, 2025, 7:45 PM

    FAQs

    What was the market size of the Global Hyper-Converged Infrastructure Market in 2024?

    The Global Hyper-Converged Infrastructure Market was valued at 46.88 USD billion in 2024.

    What will the market size of the Global Hyper-Converged Infrastructure Market be by 2035?

    By 2035, the Global Hyper-Converged Infrastructure Market is projected to reach 545.81 USD billion.

    What is the expected CAGR for the Global Hyper-Converged Infrastructure Market from 2025 to 2035?

    The market is expected to grow at a CAGR of 25.0% from 2025 to 2035.

    Which region held the largest market share in 2024?

    North America held the largest market share, valued at 18.48 USD billion in 2024.

    How much is the Global Hyper-Converged Infrastructure Market in Europe expected to be valued in 2035?

    The market in Europe is projected to be valued at 109.37 USD billion in 2035.

    What was the market size of the Hypervisor type 'VMware' in 2024?

    The market size for the Hypervisor type 'VMware' in 2024 was 18.0 USD billion.

    What will be the market value for 'KVM' by the year 2035?

    The market value for 'KVM' is expected to reach 176.33 USD billion by 2035.

    Who are the key players in the Global Hyper-Converged Infrastructure Market?

    Key players include HPE, Scale Computing, Microsoft, Lenovo, Citrix, Cisco, VMware, and Nutanix.

    What will be the size of the Asia Pacific market in 2035?

    The Asia Pacific region is expected to be valued at 165.16 USD billion in 2035.

    How much is the Middle East and Africa market expected to grow in 2035?

    The market in the Middle East and Africa is anticipated to grow to 21.45 USD billion by 2035.

    1. --- "Table of Contents
    2. Executive Summary 
      1. Market Overview 
      2. Key Findings 
      3. Market Segmentation 
      4. Competitive Landscape 
      5. Challenges and Opportunities 
      6. Future Outlook
    3. Market Introduction 
      1. Definition 
      2. Scope of the Study 
        1. Research Objective 
        2. Assumption 
        3. Limitations 
    4. Research Methodology 
      1. Overview 
      2. Data Mining 
      3. Secondary Research 
      4. Primary Research 
        1. Primary Interviews and Information Gathering Process 
        2. Breakdown of Primary Respondents 
      5. Forecasting Model 
      6. Market Size Estimation 
        1. Bottom-up Approach 
        2. Top-Down Approach 
      7. Data Triangulation 
      8. Validation
    5. MARKET DYNAMICS 
      1. Overview 
      2. Drivers 
      3. Restraints 
      4. Opportunities 
    6. MARKET FACTOR ANALYSIS 
      1. Value chain Analysis 
      2. Porter's Five Forces Analysis 
        1. Bargaining Power of Suppliers 
        2. Bargaining Power of Buyers 
        3. Threat of New Entrants 
        4. Threat of Substitutes 
        5. Intensity of Rivalry 
      3. COVID-19 Impact Analysis 
        1. Market Impact Analysis 
        2. Regional Impact 
        3. Opportunity and Threat Analysis
    7. HYPER-CONVERGED INFRASTRUCTURE MARKET, BY HYPERVISOR TYPE (USD BILLION) 
      1. VMware 
      2. KVM 
      3. Hyper-V 
    8. HYPER-CONVERGED INFRASTRUCTURE MARKET, BY APPLICATION (USD BILLION) 
      1. Virtual Desktop Infrastructure 
      2. Server Virtualization 
      3. Data Protection 
      4. Remote Office 
      5. Cloud 
    9. HYPER-CONVERGED INFRASTRUCTURE MARKET, BY REGIONAL (USD BILLION) 
      1. North America 
        1. US 
        2. Canada 
      2. Europe 
        1. Germany 
        2. UK 
        3. France 
        4. Russia 
        5. Italy 
        6. Spain 
        7. Rest of Europe 
      3. APAC 
        1. China 
        2. India 
        3. Japan 
        4. South Korea 
        5. Malaysia 
        6. Thailand 
        7. Indonesia 
        8. Rest of APAC 
      4. South America 
        1. Brazil 
        2. Mexico 
        3. Argentina 
        4. Rest of South America 
      5. MEA 
        1. GCC Countries 
        2. South Africa 
        3. Rest of MEA
    10. Competitive Landscape 
      1. Overview 
      2. Competitive Analysis 
      3. Market share Analysis 
      4. Major Growth Strategy in the Hyper-Converged Infrastructure Market 
      5. Competitive Benchmarking 
      6. Leading Players in Terms of Number of Developments in the Hyper-Converged Infrastructure Market 
      7. Key developments and growth strategies 
        1. New Product Launch/Service Deployment 
        2. Merger & Acquisitions 
        3. Joint Ventures 
      8. Major Players Financial Matrix 
        1. Sales and Operating Income 
        2. Major Players R&D Expenditure. 2023 
    11. COMPANY PROFILES 
      1. HPE 
        1. Financial Overview 
        2. Products Offered 
        3. Key Developments 
        4. SWOT Analysis 
        5. Key Strategies 
      2. Scale Computing 
        1. Financial Overview 
        2. Products Offered 
        3. Key Developments 
        4. SWOT Analysis 
        5. Key Strategies 
      3. Microsoft 
        1. Financial Overview 
        2. Products Offered 
        3. Key Developments 
        4. SWOT Analysis 
        5. Key Strategies 
      4. Lenovo 
        1. Financial Overview 
        2. Products Offered 
        3. Key Developments 
        4. SWOT Analysis 
        5. Key Strategies 
      5. Synergy Resources 
        1. Financial Overview 
        2. Products Offered 
        3. Key Developments 
        4. SWOT Analysis 
        5. Key Strategies 
      6. Citrix 
        1. Financial Overview 
        2. Products Offered 
        3. Key Developments 
        4. SWOT Analysis 
        5. Key Strategies 
      7. OpenStack 
        1. Financial Overview 
        2. Products Offered 
        3. Key Developments 
        4. SWOT Analysis 
        5. Key Strategies 
      8. Cisco 
        1. Financial Overview 
        2. Products Offered 
        3. Key Developments 
        4. SWOT Analysis 
        5. Key Strategies 
      9. VMware 
        1. Financial Overview 
        2. Products Offered 
        3. Key Developments 
        4. SWOT Analysis 
        5. Key Strategies 
      10. Nutanix 
        1. Financial Overview 
        2. Products Offered 
        3. Key Developments 
        4. SWOT Analysis 
        5. Key Strategies 
      11. NetApp 
        1. Financial Overview 
        2. Products Offered 
        3. Key Developments 
        4. SWOT Analysis 
        5. Key Strategies 
      12. Pure Storage 
        1. Financial Overview 
        2. Products Offered 
        3. Key Developments 
        4. SWOT Analysis 
        5. Key Strategies 
      13. Zyter 
        1. Financial Overview 
        2. Products Offered 
        3. Key Developments 
        4. SWOT Analysis 
        5. Key Strategies 
      14. Dell Technologies 
        1. Financial Overview 
        2. Products Offered 
        3. Key Developments 
        4. SWOT Analysis 
        5. Key Strategies 
    12. APPENDIX 
      1. References 
      2. Related Reports 
    13. List of Tables and Figures
      1. LIST OF TABLES
      2. TABLE 1. LIST OF ASSUMPTIONS 
      3. TABLE 2. NORTH AMERICA HYPER-CONVERGED INFRASTRUCTURE MARKET SIZE ESTIMATES & FORECAST, BY HYPERVISOR TYPE, 2019-2035 (USD BILLIONS) 
      4. TABLE 3. NORTH AMERICA HYPER-CONVERGED INFRASTRUCTURE MARKET SIZE ESTIMATES & FORECAST, BY APPLICATION, 2019-2035 (USD BILLIONS) 
      5. TABLE 4. NORTH AMERICA HYPER-CONVERGED INFRASTRUCTURE MARKET SIZE ESTIMATES & FORECAST, BY REGIONAL, 2019-2035 (USD BILLIONS) 
      6. TABLE 5. US HYPER-CONVERGED INFRASTRUCTURE MARKET SIZE ESTIMATES & FORECAST, BY HYPERVISOR TYPE, 2019-2035 (USD BILLIONS) 
      7. TABLE 6. US HYPER-CONVERGED INFRASTRUCTURE MARKET SIZE ESTIMATES & FORECAST, BY APPLICATION, 2019-2035 (USD BILLIONS) 
      8. TABLE 7. US HYPER-CONVERGED INFRASTRUCTURE MARKET SIZE ESTIMATES & FORECAST, BY REGIONAL, 2019-2035 (USD BILLIONS) 
      9. TABLE 8. CANADA HYPER-CONVERGED INFRASTRUCTURE MARKET SIZE ESTIMATES & FORECAST, BY HYPERVISOR TYPE, 2019-2035 (USD BILLIONS) 
      10. TABLE 9. CANADA HYPER-CONVERGED INFRASTRUCTURE MARKET SIZE ESTIMATES & FORECAST, BY APPLICATION, 2019-2035 (USD BILLIONS) 
      11. TABLE 10. CANADA HYPER-CONVERGED INFRASTRUCTURE MARKET SIZE ESTIMATES & FORECAST, BY REGIONAL, 2019-2035 (USD BILLIONS) 
      12. TABLE 11. EUROPE HYPER-CONVERGED INFRASTRUCTURE MARKET SIZE ESTIMATES & FORECAST, BY HYPERVISOR TYPE, 2019-2035 (USD BILLIONS) 
      13. TABLE 12. EUROPE HYPER-CONVERGED INFRASTRUCTURE MARKET SIZE ESTIMATES & FORECAST, BY APPLICATION, 2019-2035 (USD BILLIONS) 
      14. TABLE 13. EUROPE HYPER-CONVERGED INFRASTRUCTURE MARKET SIZE ESTIMATES & FORECAST, BY REGIONAL, 2019-2035 (USD BILLIONS) 
      15. TABLE 14. GERMANY HYPER-CONVERGED INFRASTRUCTURE MARKET SIZE ESTIMATES & FORECAST, BY HYPERVISOR TYPE, 2019-2035 (USD BILLIONS) 
      16. TABLE 15. GERMANY HYPER-CONVERGED INFRASTRUCTURE MARKET SIZE ESTIMATES & FORECAST, BY APPLICATION, 2019-2035 (USD BILLIONS) 
      17. TABLE 16. GERMANY HYPER-CONVERGED INFRASTRUCTURE MARKET SIZE ESTIMATES & FORECAST, BY REGIONAL, 2019-2035 (USD BILLIONS) 
      18. TABLE 17. UK HYPER-CONVERGED INFRASTRUCTURE MARKET SIZE ESTIMATES & FORECAST, BY HYPERVISOR TYPE, 2019-2035 (USD BILLIONS) 
      19. TABLE 18. UK HYPER-CONVERGED INFRASTRUCTURE MARKET SIZE ESTIMATES & FORECAST, BY APPLICATION, 2019-2035 (USD BILLIONS) 
      20. TABLE 19. UK HYPER-CONVERGED INFRASTRUCTURE MARKET SIZE ESTIMATES & FORECAST, BY REGIONAL, 2019-2035 (USD BILLIONS) 
      21. TABLE 20. FRANCE HYPER-CONVERGED INFRASTRUCTURE MARKET SIZE ESTIMATES & FORECAST, BY HYPERVISOR TYPE, 2019-2035 (USD BILLIONS) 
      22. TABLE 21. FRANCE HYPER-CONVERGED INFRASTRUCTURE MARKET SIZE ESTIMATES & FORECAST, BY APPLICATION, 2019-2035 (USD BILLIONS) 
      23. TABLE 22. FRANCE HYPER-CONVERGED INFRASTRUCTURE MARKET SIZE ESTIMATES & FORECAST, BY REGIONAL, 2019-2035 (USD BILLIONS) 
      24. TABLE 23. RUSSIA HYPER-CONVERGED INFRASTRUCTURE MARKET SIZE ESTIMATES & FORECAST, BY HYPERVISOR TYPE, 2019-2035 (USD BILLIONS) 
      25. TABLE 24. RUSSIA HYPER-CONVERGED INFRASTRUCTURE MARKET SIZE ESTIMATES & FORECAST, BY APPLICATION, 2019-2035 (USD BILLIONS) 
      26. TABLE 25. RUSSIA HYPER-CONVERGED INFRASTRUCTURE MARKET SIZE ESTIMATES & FORECAST, BY REGIONAL, 2019-2035 (USD BILLIONS) 
      27. TABLE 26. ITALY HYPER-CONVERGED INFRASTRUCTURE MARKET SIZE ESTIMATES & FORECAST, BY HYPERVISOR TYPE, 2019-2035 (USD BILLIONS) 
      28. TABLE 27. ITALY HYPER-CONVERGED INFRASTRUCTURE MARKET SIZE ESTIMATES & FORECAST, BY APPLICATION, 2019-2035 (USD BILLIONS) 
      29. TABLE 28. ITALY HYPER-CONVERGED INFRASTRUCTURE MARKET SIZE ESTIMATES & FORECAST, BY REGIONAL, 2019-2035 (USD BILLIONS) 
      30. TABLE 29. SPAIN HYPER-CONVERGED INFRASTRUCTURE MARKET SIZE ESTIMATES & FORECAST, BY HYPERVISOR TYPE, 2019-2035 (USD BILLIONS) 
      31. TABLE 30. SPAIN HYPER-CONVERGED INFRASTRUCTURE MARKET SIZE ESTIMATES & FORECAST, BY APPLICATION, 2019-2035 (USD BILLIONS) 
      32. TABLE 31. SPAIN HYPER-CONVERGED INFRASTRUCTURE MARKET SIZE ESTIMATES & FORECAST, BY REGIONAL, 2019-2035 (USD BILLIONS) 
      33. TABLE 32. REST OF EUROPE HYPER-CONVERGED INFRASTRUCTURE MARKET SIZE ESTIMATES & FORECAST, BY HYPERVISOR TYPE, 2019-2035 (USD BILLIONS) 
      34. TABLE 33. REST OF EUROPE HYPER-CONVERGED INFRASTRUCTURE MARKET SIZE ESTIMATES & FORECAST, BY APPLICATION, 2019-2035 (USD BILLIONS) 
      35. TABLE 34. REST OF EUROPE HYPER-CONVERGED INFRASTRUCTURE MARKET SIZE ESTIMATES & FORECAST, BY REGIONAL, 2019-2035 (USD BILLIONS) 
      36. TABLE 35. APAC HYPER-CONVERGED INFRASTRUCTURE MARKET SIZE ESTIMATES & FORECAST, BY HYPERVISOR TYPE, 2019-2035 (USD BILLIONS) 
      37. TABLE 36. APAC HYPER-CONVERGED INFRASTRUCTURE MARKET SIZE ESTIMATES & FORECAST, BY APPLICATION, 2019-2035 (USD BILLIONS) 
      38. TABLE 37. APAC HYPER-CONVERGED INFRASTRUCTURE MARKET SIZE ESTIMATES & FORECAST, BY REGIONAL, 2019-2035 (USD BILLIONS) 
      39. TABLE 38. CHINA HYPER-CONVERGED INFRASTRUCTURE MARKET SIZE ESTIMATES & FORECAST, BY HYPERVISOR TYPE, 2019-2035 (USD BILLIONS) 
      40. TABLE 39. CHINA HYPER-CONVERGED INFRASTRUCTURE MARKET SIZE ESTIMATES & FORECAST, BY APPLICATION, 2019-2035 (USD BILLIONS) 
      41. TABLE 40. CHINA HYPER-CONVERGED INFRASTRUCTURE MARKET SIZE ESTIMATES & FORECAST, BY REGIONAL, 2019-2035 (USD BILLIONS) 
      42. TABLE 41. INDIA HYPER-CONVERGED INFRASTRUCTURE MARKET SIZE ESTIMATES & FORECAST, BY HYPERVISOR TYPE, 2019-2035 (USD BILLIONS) 
      43. TABLE 42. INDIA HYPER-CONVERGED INFRASTRUCTURE MARKET SIZE ESTIMATES & FORECAST, BY APPLICATION, 2019-2035 (USD BILLIONS) 
      44. TABLE 43. INDIA HYPER-CONVERGED INFRASTRUCTURE MARKET SIZE ESTIMATES & FORECAST, BY REGIONAL, 2019-2035 (USD BILLIONS) 
      45. TABLE 44. JAPAN HYPER-CONVERGED INFRASTRUCTURE MARKET SIZE ESTIMATES & FORECAST, BY HYPERVISOR TYPE, 2019-2035 (USD BILLIONS) 
      46. TABLE 45. JAPAN HYPER-CONVERGED INFRASTRUCTURE MARKET SIZE ESTIMATES & FORECAST, BY APPLICATION, 2019-2035 (USD BILLIONS) 
      47. TABLE 46. JAPAN HYPER-CONVERGED INFRASTRUCTURE MARKET SIZE ESTIMATES & FORECAST, BY REGIONAL, 2019-2035 (USD BILLIONS) 
      48. TABLE 47. SOUTH KOREA HYPER-CONVERGED INFRASTRUCTURE MARKET SIZE ESTIMATES & FORECAST, BY HYPERVISOR TYPE, 2019-2035 (USD BILLIONS) 
      49. TABLE 48. SOUTH KOREA HYPER-CONVERGED INFRASTRUCTURE MARKET SIZE ESTIMATES & FORECAST, BY APPLICATION, 2019-2035 (USD BILLIONS) 
      50. TABLE 49. SOUTH KOREA HYPER-CONVERGED INFRASTRUCTURE MARKET SIZE ESTIMATES & FORECAST, BY REGIONAL, 2019-2035 (USD BILLIONS) 
      51. TABLE 50. MALAYSIA HYPER-CONVERGED INFRASTRUCTURE MARKET SIZE ESTIMATES & FORECAST, BY HYPERVISOR TYPE, 2019-2035 (USD BILLIONS) 
      52. TABLE 51. MALAYSIA HYPER-CONVERGED INFRASTRUCTURE MARKET SIZE ESTIMATES & FORECAST, BY APPLICATION, 2019-2035 (USD BILLIONS) 
      53. TABLE 52. MALAYSIA HYPER-CONVERGED INFRASTRUCTURE MARKET SIZE ESTIMATES & FORECAST, BY REGIONAL, 2019-2035 (USD BILLIONS) 
      54. TABLE 53. THAILAND HYPER-CONVERGED INFRASTRUCTURE MARKET SIZE ESTIMATES & FORECAST, BY HYPERVISOR TYPE, 2019-2035 (USD BILLIONS) 
      55. TABLE 54. THAILAND HYPER-CONVERGED INFRASTRUCTURE MARKET SIZE ESTIMATES & FORECAST, BY APPLICATION, 2019-2035 (USD BILLIONS) 
      56. TABLE 55. THAILAND HYPER-CONVERGED INFRASTRUCTURE MARKET SIZE ESTIMATES & FORECAST, BY REGIONAL, 2019-2035 (USD BILLIONS) 
      57. TABLE 56. INDONESIA HYPER-CONVERGED INFRASTRUCTURE MARKET SIZE ESTIMATES & FORECAST, BY HYPERVISOR TYPE, 2019-2035 (USD BILLIONS) 
      58. TABLE 57. INDONESIA HYPER-CONVERGED INFRASTRUCTURE MARKET SIZE ESTIMATES & FORECAST, BY APPLICATION, 2019-2035 (USD BILLIONS) 
      59. TABLE 58. INDONESIA HYPER-CONVERGED INFRASTRUCTURE MARKET SIZE ESTIMATES & FORECAST, BY REGIONAL, 2019-2035 (USD BILLIONS) 
      60. TABLE 59. REST OF APAC HYPER-CONVERGED INFRASTRUCTURE MARKET SIZE ESTIMATES & FORECAST, BY HYPERVISOR TYPE, 2019-2035 (USD BILLIONS) 
      61. TABLE 60. REST OF APAC HYPER-CONVERGED INFRASTRUCTURE MARKET SIZE ESTIMATES & FORECAST, BY APPLICATION, 2019-2035 (USD BILLIONS) 
      62. TABLE 61. REST OF APAC HYPER-CONVERGED INFRASTRUCTURE MARKET SIZE ESTIMATES & FORECAST, BY REGIONAL, 2019-2035 (USD BILLIONS) 
      63. TABLE 62. SOUTH AMERICA HYPER-CONVERGED INFRASTRUCTURE MARKET SIZE ESTIMATES & FORECAST, BY HYPERVISOR TYPE, 2019-2035 (USD BILLIONS) 
      64. TABLE 63. SOUTH AMERICA HYPER-CONVERGED INFRASTRUCTURE MARKET SIZE ESTIMATES & FORECAST, BY APPLICATION, 2019-2035 (USD BILLIONS) 
      65. TABLE 64. SOUTH AMERICA HYPER-CONVERGED INFRASTRUCTURE MARKET SIZE ESTIMATES & FORECAST, BY REGIONAL, 2019-2035 (USD BILLIONS) 
      66. TABLE 65. BRAZIL HYPER-CONVERGED INFRASTRUCTURE MARKET SIZE ESTIMATES & FORECAST, BY HYPERVISOR TYPE, 2019-2035 (USD BILLIONS) 
      67. TABLE 66. BRAZIL HYPER-CONVERGED INFRASTRUCTURE MARKET SIZE ESTIMATES & FORECAST, BY APPLICATION, 2019-2035 (USD BILLIONS) 
      68. TABLE 67. BRAZIL HYPER-CONVERGED INFRASTRUCTURE MARKET SIZE ESTIMATES & FORECAST, BY REGIONAL, 2019-2035 (USD BILLIONS) 
      69. TABLE 68. MEXICO HYPER-CONVERGED INFRASTRUCTURE MARKET SIZE ESTIMATES & FORECAST, BY HYPERVISOR TYPE, 2019-2035 (USD BILLIONS) 
      70. TABLE 69. MEXICO HYPER-CONVERGED INFRASTRUCTURE MARKET SIZE ESTIMATES & FORECAST, BY APPLICATION, 2019-2035 (USD BILLIONS) 
      71. TABLE 70. MEXICO HYPER-CONVERGED INFRASTRUCTURE MARKET SIZE ESTIMATES & FORECAST, BY REGIONAL, 2019-2035 (USD BILLIONS) 
      72. TABLE 71. ARGENTINA HYPER-CONVERGED INFRASTRUCTURE MARKET SIZE ESTIMATES & FORECAST, BY HYPERVISOR TYPE, 2019-2035 (USD BILLIONS) 
      73. TABLE 72. ARGENTINA HYPER-CONVERGED INFRASTRUCTURE MARKET SIZE ESTIMATES & FORECAST, BY APPLICATION, 2019-2035 (USD BILLIONS) 
      74. TABLE 73. ARGENTINA HYPER-CONVERGED INFRASTRUCTURE MARKET SIZE ESTIMATES & FORECAST, BY REGIONAL, 2019-2035 (USD BILLIONS) 
      75. TABLE 74. REST OF SOUTH AMERICA HYPER-CONVERGED INFRASTRUCTURE MARKET SIZE ESTIMATES & FORECAST, BY HYPERVISOR TYPE, 2019-2035 (USD BILLIONS) 
      76. TABLE 75. REST OF SOUTH AMERICA HYPER-CONVERGED INFRASTRUCTURE MARKET SIZE ESTIMATES & FORECAST, BY APPLICATION, 2019-2035 (USD BILLIONS) 
      77. TABLE 76. REST OF SOUTH AMERICA HYPER-CONVERGED INFRASTRUCTURE MARKET SIZE ESTIMATES & FORECAST, BY REGIONAL, 2019-2035 (USD BILLIONS) 
      78. TABLE 77. MEA HYPER-CONVERGED INFRASTRUCTURE MARKET SIZE ESTIMATES & FORECAST, BY HYPERVISOR TYPE, 2019-2035 (USD BILLIONS) 
      79. TABLE 78. MEA HYPER-CONVERGED INFRASTRUCTURE MARKET SIZE ESTIMATES & FORECAST, BY APPLICATION, 2019-2035 (USD BILLIONS) 
      80. TABLE 79. MEA HYPER-CONVERGED INFRASTRUCTURE MARKET SIZE ESTIMATES & FORECAST, BY REGIONAL, 2019-2035 (USD BILLIONS) 
      81. TABLE 80. GCC COUNTRIES HYPER-CONVERGED INFRASTRUCTURE MARKET SIZE ESTIMATES & FORECAST, BY HYPERVISOR TYPE, 2019-2035 (USD BILLIONS) 
      82. TABLE 81. GCC COUNTRIES HYPER-CONVERGED INFRASTRUCTURE MARKET SIZE ESTIMATES & FORECAST, BY APPLICATION, 2019-2035 (USD BILLIONS) 
      83. TABLE 82. GCC COUNTRIES HYPER-CONVERGED INFRASTRUCTURE MARKET SIZE ESTIMATES & FORECAST, BY REGIONAL, 2019-2035 (USD BILLIONS) 
      84. TABLE 83. SOUTH AFRICA HYPER-CONVERGED INFRASTRUCTURE MARKET SIZE ESTIMATES & FORECAST, BY HYPERVISOR TYPE, 2019-2035 (USD BILLIONS) 
      85. TABLE 84. SOUTH AFRICA HYPER-CONVERGED INFRASTRUCTURE MARKET SIZE ESTIMATES & FORECAST, BY APPLICATION, 2019-2035 (USD BILLIONS) 
      86. TABLE 85. SOUTH AFRICA HYPER-CONVERGED INFRASTRUCTURE MARKET SIZE ESTIMATES & FORECAST, BY REGIONAL, 2019-2035 (USD BILLIONS) 
      87. TABLE 86. REST OF MEA HYPER-CONVERGED INFRASTRUCTURE MARKET SIZE ESTIMATES & FORECAST, BY HYPERVISOR TYPE, 2019-2035 (USD BILLIONS) 
      88. TABLE 87. REST OF MEA HYPER-CONVERGED INFRASTRUCTURE MARKET SIZE ESTIMATES & FORECAST, BY APPLICATION, 2019-2035 (USD BILLIONS) 
      89. TABLE 88. REST OF MEA HYPER-CONVERGED INFRASTRUCTURE MARKET SIZE ESTIMATES & FORECAST, BY REGIONAL, 2019-2035 (USD BILLIONS) 
      90. TABLE 89. PRODUCT LAUNCH/PRODUCT DEVELOPMENT/APPROVAL 
      91. TABLE 90. ACQUISITION/PARTNERSHIP                             LIST OF FIGURES
      92. FIGURE 1. MARKET SYNOPSIS 
      93. FIGURE 2. NORTH AMERICA HYPER-CONVERGED INFRASTRUCTURE MARKET ANALYSIS 
      94. FIGURE 3. US HYPER-CONVERGED INFRASTRUCTURE MARKET ANALYSIS BY HYPERVISOR TYPE 
      95. FIGURE 4. US HYPER-CONVERGED INFRASTRUCTURE MARKET ANALYSIS BY APPLICATION 
      96. FIGURE 5. US HYPER-CONVERGED INFRASTRUCTURE MARKET ANALYSIS BY REGIONAL 
      97. FIGURE 6. CANADA HYPER-CONVERGED INFRASTRUCTURE MARKET ANALYSIS BY HYPERVISOR TYPE 
      98. FIGURE 7. CANADA HYPER-CONVERGED INFRASTRUCTURE MARKET ANALYSIS BY APPLICATION 
      99. FIGURE 8. CANADA HYPER-CONVERGED INFRASTRUCTURE MARKET ANALYSIS BY REGIONAL 
      100. FIGURE 9. EUROPE HYPER-CONVERGED INFRASTRUCTURE MARKET ANALYSIS 
      101. FIGURE 10. GERMANY HYPER-CONVERGED INFRASTRUCTURE MARKET ANALYSIS BY HYPERVISOR TYPE 
      102. FIGURE 11. GERMANY HYPER-CONVERGED INFRASTRUCTURE MARKET ANALYSIS BY APPLICATION 
      103. FIGURE 12. GERMANY HYPER-CONVERGED INFRASTRUCTURE MARKET ANALYSIS BY REGIONAL 
      104. FIGURE 13. UK HYPER-CONVERGED INFRASTRUCTURE MARKET ANALYSIS BY HYPERVISOR TYPE 
      105. FIGURE 14. UK HYPER-CONVERGED INFRASTRUCTURE MARKET ANALYSIS BY APPLICATION 
      106. FIGURE 15. UK HYPER-CONVERGED INFRASTRUCTURE MARKET ANALYSIS BY REGIONAL 
      107. FIGURE 16. FRANCE HYPER-CONVERGED INFRASTRUCTURE MARKET ANALYSIS BY HYPERVISOR TYPE 
      108. FIGURE 17. FRANCE HYPER-CONVERGED INFRASTRUCTURE MARKET ANALYSIS BY APPLICATION 
      109. FIGURE 18. FRANCE HYPER-CONVERGED INFRASTRUCTURE MARKET ANALYSIS BY REGIONAL 
      110. FIGURE 19. RUSSIA HYPER-CONVERGED INFRASTRUCTURE MARKET ANALYSIS BY HYPERVISOR TYPE 
      111. FIGURE 20. RUSSIA HYPER-CONVERGED INFRASTRUCTURE MARKET ANALYSIS BY APPLICATION 
      112. FIGURE 21. RUSSIA HYPER-CONVERGED INFRASTRUCTURE MARKET ANALYSIS BY REGIONAL 
      113. FIGURE 22. ITALY HYPER-CONVERGED INFRASTRUCTURE MARKET ANALYSIS BY HYPERVISOR TYPE 
      114. FIGURE 23. ITALY HYPER-CONVERGED INFRASTRUCTURE MARKET ANALYSIS BY APPLICATION 
      115. FIGURE 24. ITALY HYPER-CONVERGED INFRASTRUCTURE MARKET ANALYSIS BY REGIONAL 
      116. FIGURE 25. SPAIN HYPER-CONVERGED INFRASTRUCTURE MARKET ANALYSIS BY HYPERVISOR TYPE 
      117. FIGURE 26. SPAIN HYPER-CONVERGED INFRASTRUCTURE MARKET ANALYSIS BY APPLICATION 
      118. FIGURE 27. SPAIN HYPER-CONVERGED INFRASTRUCTURE MARKET ANALYSIS BY REGIONAL 
      119. FIGURE 28. REST OF EUROPE HYPER-CONVERGED INFRASTRUCTURE MARKET ANALYSIS BY HYPERVISOR TYPE 
      120. FIGURE 29. REST OF EUROPE HYPER-CONVERGED INFRASTRUCTURE MARKET ANALYSIS BY APPLICATION 
      121. FIGURE 30. REST OF EUROPE HYPER-CONVERGED INFRASTRUCTURE MARKET ANALYSIS BY REGIONAL 
      122. FIGURE 31. APAC HYPER-CONVERGED INFRASTRUCTURE MARKET ANALYSIS 
      123. FIGURE 32. CHINA HYPER-CONVERGED INFRASTRUCTURE MARKET ANALYSIS BY HYPERVISOR TYPE 
      124. FIGURE 33. CHINA HYPER-CONVERGED INFRASTRUCTURE MARKET ANALYSIS BY APPLICATION 
      125. FIGURE 34. CHINA HYPER-CONVERGED INFRASTRUCTURE MARKET ANALYSIS BY REGIONAL 
      126. FIGURE 35. INDIA HYPER-CONVERGED INFRASTRUCTURE MARKET ANALYSIS BY HYPERVISOR TYPE 
      127. FIGURE 36. INDIA HYPER-CONVERGED INFRASTRUCTURE MARKET ANALYSIS BY APPLICATION 
      128. FIGURE 37. INDIA HYPER-CONVERGED INFRASTRUCTURE MARKET ANALYSIS BY REGIONAL 
      129. FIGURE 38. JAPAN HYPER-CONVERGED INFRASTRUCTURE MARKET ANALYSIS BY HYPERVISOR TYPE 
      130. FIGURE 39. JAPAN HYPER-CONVERGED INFRASTRUCTURE MARKET ANALYSIS BY APPLICATION 
      131. FIGURE 40. JAPAN HYPER-CONVERGED INFRASTRUCTURE MARKET ANALYSIS BY REGIONAL 
      132. FIGURE 41. SOUTH KOREA HYPER-CONVERGED INFRASTRUCTURE MARKET ANALYSIS BY HYPERVISOR TYPE 
      133. FIGURE 42. SOUTH KOREA HYPER-CONVERGED INFRASTRUCTURE MARKET ANALYSIS BY APPLICATION 
      134. FIGURE 43. SOUTH KOREA HYPER-CONVERGED INFRASTRUCTURE MARKET ANALYSIS BY REGIONAL 
      135. FIGURE 44. MALAYSIA HYPER-CONVERGED INFRASTRUCTURE MARKET ANALYSIS BY HYPERVISOR TYPE 
      136. FIGURE 45. MALAYSIA HYPER-CONVERGED INFRASTRUCTURE MARKET ANALYSIS BY APPLICATION 
      137. FIGURE 46. MALAYSIA HYPER-CONVERGED INFRASTRUCTURE MARKET ANALYSIS BY REGIONAL 
      138. FIGURE 47. THAILAND HYPER-CONVERGED INFRASTRUCTURE MARKET ANALYSIS BY HYPERVISOR TYPE 
      139. FIGURE 48. THAILAND HYPER-CONVERGED INFRASTRUCTURE MARKET ANALYSIS BY APPLICATION 
      140. FIGURE 49. THAILAND HYPER-CONVERGED INFRASTRUCTURE MARKET ANALYSIS BY REGIONAL 
      141. FIGURE 50. INDONESIA HYPER-CONVERGED INFRASTRUCTURE MARKET ANALYSIS BY HYPERVISOR TYPE 
      142. FIGURE 51. INDONESIA HYPER-CONVERGED INFRASTRUCTURE MARKET ANALYSIS BY APPLICATION 
      143. FIGURE 52. INDONESIA HYPER-CONVERGED INFRASTRUCTURE MARKET ANALYSIS BY REGIONAL 
      144. FIGURE 53. REST OF APAC HYPER-CONVERGED INFRASTRUCTURE MARKET ANALYSIS BY HYPERVISOR TYPE 
      145. FIGURE 54. REST OF APAC HYPER-CONVERGED INFRASTRUCTURE MARKET ANALYSIS BY APPLICATION 
      146. FIGURE 55. REST OF APAC HYPER-CONVERGED INFRASTRUCTURE MARKET ANALYSIS BY REGIONAL 
      147. FIGURE 56. SOUTH AMERICA HYPER-CONVERGED INFRASTRUCTURE MARKET ANALYSIS 
      148. FIGURE 57. BRAZIL HYPER-CONVERGED INFRASTRUCTURE MARKET ANALYSIS BY HYPERVISOR TYPE 
      149. FIGURE 58. BRAZIL HYPER-CONVERGED INFRASTRUCTURE MARKET ANALYSIS BY APPLICATION 
      150. FIGURE 59. BRAZIL HYPER-CONVERGED INFRASTRUCTURE MARKET ANALYSIS BY REGIONAL 
      151. FIGURE 60. MEXICO HYPER-CONVERGED INFRASTRUCTURE MARKET ANALYSIS BY HYPERVISOR TYPE 
      152. FIGURE 61. MEXICO HYPER-CONVERGED INFRASTRUCTURE MARKET ANALYSIS BY APPLICATION 
      153. FIGURE 62. MEXICO HYPER-CONVERGED INFRASTRUCTURE MARKET ANALYSIS BY REGIONAL 
      154. FIGURE 63. ARGENTINA HYPER-CONVERGED INFRASTRUCTURE MARKET ANALYSIS BY HYPERVISOR TYPE 
      155. FIGURE 64. ARGENTINA HYPER-CONVERGED INFRASTRUCTURE MARKET ANALYSIS BY APPLICATION 
      156. FIGURE 65. ARGENTINA HYPER-CONVERGED INFRASTRUCTURE MARKET ANALYSIS BY REGIONAL 
      157. FIGURE 66. REST OF SOUTH AMERICA HYPER-CONVERGED INFRASTRUCTURE MARKET ANALYSIS BY HYPERVISOR TYPE 
      158. FIGURE 67. REST OF SOUTH AMERICA HYPER-CONVERGED INFRASTRUCTURE MARKET ANALYSIS BY APPLICATION 
      159. FIGURE 68. REST OF SOUTH AMERICA HYPER-CONVERGED INFRASTRUCTURE MARKET ANALYSIS BY REGIONAL 
      160. FIGURE 69. MEA HYPER-CONVERGED INFRASTRUCTURE MARKET ANALYSIS 
      161. FIGURE 70. GCC COUNTRIES HYPER-CONVERGED INFRASTRUCTURE MARKET ANALYSIS BY HYPERVISOR TYPE 
      162. FIGURE 71. GCC COUNTRIES HYPER-CONVERGED INFRASTRUCTURE MARKET ANALYSIS BY APPLICATION 
      163. FIGURE 72. GCC COUNTRIES HYPER-CONVERGED INFRASTRUCTURE MARKET ANALYSIS BY REGIONAL 
      164. FIGURE 73. SOUTH AFRICA HYPER-CONVERGED INFRASTRUCTURE MARKET ANALYSIS BY HYPERVISOR TYPE 
      165. FIGURE 74. SOUTH AFRICA HYPER-CONVERGED INFRASTRUCTURE MARKET ANALYSIS BY APPLICATION 
      166. FIGURE 75. SOUTH AFRICA HYPER-CONVERGED INFRASTRUCTURE MARKET ANALYSIS BY REGIONAL 
      167. FIGURE 76. REST OF MEA HYPER-CONVERGED INFRASTRUCTURE MARKET ANALYSIS BY HYPERVISOR TYPE 
      168. FIGURE 77. REST OF MEA HYPER-CONVERGED INFRASTRUCTURE MARKET ANALYSIS BY APPLICATION 
      169. FIGURE 78. REST OF MEA HYPER-CONVERGED INFRASTRUCTURE MARKET ANALYSIS BY REGIONAL 
      170. FIGURE 79. KEY BUYING CRITERIA OF HYPER-CONVERGED INFRASTRUCTURE MARKET 
      171. FIGURE 80. RESEARCH PROCESS OF MRFR 
      172. FIGURE 81. DRO ANALYSIS OF HYPER-CONVERGED INFRASTRUCTURE MARKET 
      173. FIGURE 82. DRIVERS IMPACT ANALYSIS: HYPER-CONVERGED INFRASTRUCTURE MARKET 
      174. FIGURE 83. RESTRAINTS IMPACT ANALYSIS: HYPER-CONVERGED INFRASTRUCTURE MARKET 
      175. FIGURE 84. SUPPLY / VALUE CHAIN: HYPER-CONVERGED INFRASTRUCTURE MARKET 
      176. FIGURE 85. HYPER-CONVERGED INFRASTRUCTURE MARKET, BY HYPERVISOR TYPE, 2025 (% SHARE) 
      177. FIGURE 86. HYPER-CONVERGED INFRASTRUCTURE MARKET, BY HYPERVISOR TYPE, 2019 TO 2035 (USD Billions) 
      178. FIGURE 87. HYPER-CONVERGED INFRASTRUCTURE MARKET, BY APPLICATION, 2025 (% SHARE) 
      179. FIGURE 88. HYPER-CONVERGED INFRASTRUCTURE MARKET, BY APPLICATION, 2019 TO 2035 (USD Billions) 
      180. FIGURE 89. HYPER-CONVERGED INFRASTRUCTURE MARKET, BY REGIONAL, 2025 (% SHARE) 
      181. FIGURE 90. HYPER-CONVERGED INFRASTRUCTURE MARKET, BY REGIONAL, 2019 TO 2035 (USD Billions) 
      182. FIGURE 91. BENCHMARKING OF MAJOR COMPETITORS  "

    Hyper-Converged Infrastructure Market Segmentation


    • Hyper-Converged Infrastructure Market By Hypervisor Type (USD Billion, 2019-2035) 
      • VMware
      • KVM
      • Hyper-V


    • Hyper-Converged Infrastructure Market By Application (USD Billion, 2019-2035) 
      • Virtual Desktop Infrastructure
      • Server Virtualization
      • Data Protection
      • Remote Office
      • Cloud


    • Hyper-Converged Infrastructure Market By Regional (USD Billion, 2019-2035) 
      • North America
      • Europe
      • South America
      • Asia Pacific
      • Middle East and Africa


    Hyper-Converged Infrastructure Market Regional Outlook (USD Billion, 2019-2035)


    • North America Outlook (USD Billion, 2019-2035)
      • North America Hyper-Converged Infrastructure Market by Hypervisor Type
        • VMware
        • KVM
        • Hyper-V
      • North America Hyper-Converged Infrastructure Market by Application Type
        • Virtual Desktop Infrastructure
        • Server Virtualization
        • Data Protection
        • Remote Office
        • Cloud
      • North America Hyper-Converged Infrastructure Market by Regional Type
        • US
        • Canada
      • US Outlook (USD Billion, 2019-2035)
      • US Hyper-Converged Infrastructure Market by Hypervisor Type
        • VMware
        • KVM
        • Hyper-V
      • US Hyper-Converged Infrastructure Market by Application Type
        • Virtual Desktop Infrastructure
        • Server Virtualization
        • Data Protection
        • Remote Office
        • Cloud
      • CANADA Outlook (USD Billion, 2019-2035)
      • CANADA Hyper-Converged Infrastructure Market by Hypervisor Type
        • VMware
        • KVM
        • Hyper-V
      • CANADA Hyper-Converged Infrastructure Market by Application Type
        • Virtual Desktop Infrastructure
        • Server Virtualization
        • Data Protection
        • Remote Office
        • Cloud
      • Europe Outlook (USD Billion, 2019-2035)
        • Europe Hyper-Converged Infrastructure Market by Hypervisor Type
          • VMware
          • KVM
          • Hyper-V
        • Europe Hyper-Converged Infrastructure Market by Application Type
          • Virtual Desktop Infrastructure
          • Server Virtualization
          • Data Protection
          • Remote Office
          • Cloud
        • Europe Hyper-Converged Infrastructure Market by Regional Type
          • Germany
          • UK
          • France
          • Russia
          • Italy
          • Spain
          • Rest of Europe
        • GERMANY Outlook (USD Billion, 2019-2035)
        • GERMANY Hyper-Converged Infrastructure Market by Hypervisor Type
          • VMware
          • KVM
          • Hyper-V
        • GERMANY Hyper-Converged Infrastructure Market by Application Type
          • Virtual Desktop Infrastructure
          • Server Virtualization
          • Data Protection
          • Remote Office
          • Cloud
        • UK Outlook (USD Billion, 2019-2035)
        • UK Hyper-Converged Infrastructure Market by Hypervisor Type
          • VMware
          • KVM
          • Hyper-V
        • UK Hyper-Converged Infrastructure Market by Application Type
          • Virtual Desktop Infrastructure
          • Server Virtualization
          • Data Protection
          • Remote Office
          • Cloud
        • FRANCE Outlook (USD Billion, 2019-2035)
        • FRANCE Hyper-Converged Infrastructure Market by Hypervisor Type
          • VMware
          • KVM
          • Hyper-V
        • FRANCE Hyper-Converged Infrastructure Market by Application Type
          • Virtual Desktop Infrastructure
          • Server Virtualization
          • Data Protection
          • Remote Office
          • Cloud
        • RUSSIA Outlook (USD Billion, 2019-2035)
        • RUSSIA Hyper-Converged Infrastructure Market by Hypervisor Type
          • VMware
          • KVM
          • Hyper-V
        • RUSSIA Hyper-Converged Infrastructure Market by Application Type
          • Virtual Desktop Infrastructure
          • Server Virtualization
          • Data Protection
          • Remote Office
          • Cloud
        • ITALY Outlook (USD Billion, 2019-2035)
        • ITALY Hyper-Converged Infrastructure Market by Hypervisor Type
          • VMware
          • KVM
          • Hyper-V
        • ITALY Hyper-Converged Infrastructure Market by Application Type
          • Virtual Desktop Infrastructure
          • Server Virtualization
          • Data Protection
          • Remote Office
          • Cloud
        • SPAIN Outlook (USD Billion, 2019-2035)
        • SPAIN Hyper-Converged Infrastructure Market by Hypervisor Type
          • VMware
          • KVM
          • Hyper-V
        • SPAIN Hyper-Converged Infrastructure Market by Application Type
          • Virtual Desktop Infrastructure
          • Server Virtualization
          • Data Protection
          • Remote Office
          • Cloud
        • REST OF EUROPE Outlook (USD Billion, 2019-2035)
        • REST OF EUROPE Hyper-Converged Infrastructure Market by Hypervisor Type
          • VMware
          • KVM
          • Hyper-V
        • REST OF EUROPE Hyper-Converged Infrastructure Market by Application Type
          • Virtual Desktop Infrastructure
          • Server Virtualization
          • Data Protection
          • Remote Office
          • Cloud
        • APAC Outlook (USD Billion, 2019-2035)
          • APAC Hyper-Converged Infrastructure Market by Hypervisor Type
            • VMware
            • KVM
            • Hyper-V
          • APAC Hyper-Converged Infrastructure Market by Application Type
            • Virtual Desktop Infrastructure
            • Server Virtualization
            • Data Protection
            • Remote Office
            • Cloud
          • APAC Hyper-Converged Infrastructure Market by Regional Type
            • China
            • India
            • Japan
            • South Korea
            • Malaysia
            • Thailand
            • Indonesia
            • Rest of APAC
          • CHINA Outlook (USD Billion, 2019-2035)
          • CHINA Hyper-Converged Infrastructure Market by Hypervisor Type
            • VMware
            • KVM
            • Hyper-V
          • CHINA Hyper-Converged Infrastructure Market by Application Type
            • Virtual Desktop Infrastructure
            • Server Virtualization
            • Data Protection
            • Remote Office
            • Cloud
          • INDIA Outlook (USD Billion, 2019-2035)
          • INDIA Hyper-Converged Infrastructure Market by Hypervisor Type
            • VMware
            • KVM
            • Hyper-V
          • INDIA Hyper-Converged Infrastructure Market by Application Type
            • Virtual Desktop Infrastructure
            • Server Virtualization
            • Data Protection
            • Remote Office
            • Cloud
          • JAPAN Outlook (USD Billion, 2019-2035)
          • JAPAN Hyper-Converged Infrastructure Market by Hypervisor Type
            • VMware
            • KVM
            • Hyper-V
          • JAPAN Hyper-Converged Infrastructure Market by Application Type
            • Virtual Desktop Infrastructure
            • Server Virtualization
            • Data Protection
            • Remote Office
            • Cloud
          • SOUTH KOREA Outlook (USD Billion, 2019-2035)
          • SOUTH KOREA Hyper-Converged Infrastructure Market by Hypervisor Type
            • VMware
            • KVM
            • Hyper-V
          • SOUTH KOREA Hyper-Converged Infrastructure Market by Application Type
            • Virtual Desktop Infrastructure
            • Server Virtualization
            • Data Protection
            • Remote Office
            • Cloud
          • MALAYSIA Outlook (USD Billion, 2019-2035)
          • MALAYSIA Hyper-Converged Infrastructure Market by Hypervisor Type
            • VMware
            • KVM
            • Hyper-V
          • MALAYSIA Hyper-Converged Infrastructure Market by Application Type
            • Virtual Desktop Infrastructure
            • Server Virtualization
            • Data Protection
            • Remote Office
            • Cloud
          • THAILAND Outlook (USD Billion, 2019-2035)
          • THAILAND Hyper-Converged Infrastructure Market by Hypervisor Type
            • VMware
            • KVM
            • Hyper-V
          • THAILAND Hyper-Converged Infrastructure Market by Application Type
            • Virtual Desktop Infrastructure
            • Server Virtualization
            • Data Protection
            • Remote Office
            • Cloud
          • INDONESIA Outlook (USD Billion, 2019-2035)
          • INDONESIA Hyper-Converged Infrastructure Market by Hypervisor Type
            • VMware
            • KVM
            • Hyper-V
          • INDONESIA Hyper-Converged Infrastructure Market by Application Type
            • Virtual Desktop Infrastructure
            • Server Virtualization
            • Data Protection
            • Remote Office
            • Cloud
          • REST OF APAC Outlook (USD Billion, 2019-2035)
          • REST OF APAC Hyper-Converged Infrastructure Market by Hypervisor Type
            • VMware
            • KVM
            • Hyper-V
          • REST OF APAC Hyper-Converged Infrastructure Market by Application Type
            • Virtual Desktop Infrastructure
            • Server Virtualization
            • Data Protection
            • Remote Office
            • Cloud
          • South America Outlook (USD Billion, 2019-2035)
            • South America Hyper-Converged Infrastructure Market by Hypervisor Type
              • VMware
              • KVM
              • Hyper-V
            • South America Hyper-Converged Infrastructure Market by Application Type
              • Virtual Desktop Infrastructure
              • Server Virtualization
              • Data Protection
              • Remote Office
              • Cloud
            • South America Hyper-Converged Infrastructure Market by Regional Type
              • Brazil
              • Mexico
              • Argentina
              • Rest of South America
            • BRAZIL Outlook (USD Billion, 2019-2035)
            • BRAZIL Hyper-Converged Infrastructure Market by Hypervisor Type
              • VMware
              • KVM
              • Hyper-V
            • BRAZIL Hyper-Converged Infrastructure Market by Application Type
              • Virtual Desktop Infrastructure
              • Server Virtualization
              • Data Protection
              • Remote Office
              • Cloud
            • MEXICO Outlook (USD Billion, 2019-2035)
            • MEXICO Hyper-Converged Infrastructure Market by Hypervisor Type
              • VMware
              • KVM
              • Hyper-V
            • MEXICO Hyper-Converged Infrastructure Market by Application Type
              • Virtual Desktop Infrastructure
              • Server Virtualization
              • Data Protection
              • Remote Office
              • Cloud
            • ARGENTINA Outlook (USD Billion, 2019-2035)
            • ARGENTINA Hyper-Converged Infrastructure Market by Hypervisor Type
              • VMware
              • KVM
              • Hyper-V
            • ARGENTINA Hyper-Converged Infrastructure Market by Application Type
              • Virtual Desktop Infrastructure
              • Server Virtualization
              • Data Protection
              • Remote Office
              • Cloud
            • REST OF SOUTH AMERICA Outlook (USD Billion, 2019-2035)
            • REST OF SOUTH AMERICA Hyper-Converged Infrastructure Market by Hypervisor Type
              • VMware
              • KVM
              • Hyper-V
            • REST OF SOUTH AMERICA Hyper-Converged Infrastructure Market by Application Type
              • Virtual Desktop Infrastructure
              • Server Virtualization
              • Data Protection
              • Remote Office
              • Cloud
            • MEA Outlook (USD Billion, 2019-2035)
              • MEA Hyper-Converged Infrastructure Market by Hypervisor Type
                • VMware
                • KVM
                • Hyper-V
              • MEA Hyper-Converged Infrastructure Market by Application Type
                • Virtual Desktop Infrastructure
                • Server Virtualization
                • Data Protection
                • Remote Office
                • Cloud
              • MEA Hyper-Converged Infrastructure Market by Regional Type
                • GCC Countries
                • South Africa
                • Rest of MEA
              • GCC COUNTRIES Outlook (USD Billion, 2019-2035)
              • GCC COUNTRIES Hyper-Converged Infrastructure Market by Hypervisor Type
                • VMware
                • KVM
                • Hyper-V
              • GCC COUNTRIES Hyper-Converged Infrastructure Market by Application Type
                • Virtual Desktop Infrastructure
                • Server Virtualization
                • Data Protection
                • Remote Office
                • Cloud
              • SOUTH AFRICA Outlook (USD Billion, 2019-2035)
              • SOUTH AFRICA Hyper-Converged Infrastructure Market by Hypervisor Type
                • VMware
                • KVM
                • Hyper-V
              • SOUTH AFRICA Hyper-Converged Infrastructure Market by Application Type
                • Virtual Desktop Infrastructure
                • Server Virtualization
                • Data Protection
                • Remote Office
                • Cloud
              • REST OF MEA Outlook (USD Billion, 2019-2035)
              • REST OF MEA Hyper-Converged Infrastructure Market by Hypervisor Type
                • VMware
                • KVM
                • Hyper-V
              • REST OF MEA Hyper-Converged Infrastructure Market by Application Type
                • Virtual Desktop Infrastructure
                • Server Virtualization
                • Data Protection
                • Remote Office
                • Cloud


    Infographic

    Free Sample Request

    Kindly complete the form below to receive a free sample of this Report

    Get Free Sample

    Customer Strories

    “I am very pleased with how market segments have been defined in a relevant way for my purposes (such as "Portable Freezers & refrigerators" and "last-mile"). In general the report is well structured. Thanks very much for your efforts.”

    Victoria Milne

    Founder
    Case Study
    Chemicals and Materials