• Cat-intel
  • MedIntelliX
  • Resources
  • About Us
  • Hero Background
    English
    Chinese
    French
    Japanese
    Korean
    German
    Spanish

    Green Ammonia Market Size

    ID: MRFR/CnM/9999-HCR
    128 Pages
    Chitranshi Jaiswal
    October 2025

    Green Ammonia Market Research Report Information By Gasifier Technology (Alkaline Water Electrolysis, Proton Exchange Membrane Electrolysis and Solid Oxide Electrolysis), By Gasifier Application (Power Generation, Transportation and Industrial Feedstocks), and By Region (North America, Europe, Asia-Pacific, And Rest Of The World) –Market Forecast Till 2035

    Share:
    Download PDF ×

    We do not share your information with anyone. However, we may send you emails based on your report interest from time to time. You may contact us at any time to opt-out.

    Green Ammonia Market Infographic
    Purchase Options

    Green Ammonia Size

    Green Ammonia Market Growth Projections and Opportunities

    The market factors influencing the Green Ammonia market are multifaceted, driven by a combination of environmental concerns, technological advancements, regulatory frameworks, and economic dynamics. At the forefront of these factors is the growing global awareness of the detrimental effects of conventional ammonia production methods on the environment, particularly in terms of greenhouse gas emissions. As a result, there's a mounting pressure on industries to transition towards more sustainable practices, spurring the demand for green alternatives like green ammonia.

    Technological innovations play a pivotal role in shaping the market dynamics of green ammonia. Breakthroughs in renewable energy sources, such as wind and solar power, have significantly enhanced the feasibility and cost-effectiveness of green ammonia production. These advancements have bolstered investor confidence and spurred investments in green ammonia infrastructure, driving market growth.

    Moreover, regulatory initiatives aimed at curbing carbon emissions and promoting renewable energy adoption have created a favorable regulatory environment for green ammonia producers. Governments around the world are implementing policies and incentives to incentivize the adoption of green technologies, further fueling the market expansion. These regulatory measures include carbon pricing mechanisms, renewable energy mandates, and subsidies for green ammonia production.

    Another key factor influencing the green ammonia market is the shifting dynamics of the global energy landscape. With increasing volatility in fossil fuel markets and growing concerns over energy security, there's a growing impetus to diversify energy sources and reduce dependence on traditional fuels. Green ammonia offers a promising solution, serving as a versatile energy carrier for applications such as fuel cells, power generation, and as a feedstock for chemical synthesis.

    Furthermore, the economics of green ammonia production are becoming increasingly favorable compared to conventional methods. As the cost of renewable energy continues to decline and economies of scale are realized in green ammonia production, the cost competitiveness of green ammonia is improving. This trend is attracting both traditional ammonia producers seeking to diversify their portfolios and new entrants looking to capitalize on the growing demand for sustainable alternatives.

    Market factors related to supply chain logistics and infrastructure development also play a crucial role in shaping the green ammonia market. Investments in ammonia production facilities, storage infrastructure, and transportation networks are essential to meet the growing demand for green ammonia and ensure its widespread adoption across various industries. Moreover, collaborations and partnerships along the value chain are essential to drive innovation, optimize processes, and reduce costs, further bolstering market growth.
    Green Ammonia Market Size Graph
    Author
    Chitranshi Jaiswal
    Research Analyst Level I

    In her 3 years of experience in the market research field, she has handled critical cross-domain projects. She has an in-depth knowledge of market estimation & analysis, problem-solving, primary as well as secondary research, and team management.She holds an engineering degree and is an MBA professional from a well-known university, capable of evaluating the market and competitive conditions. An exceptional strategist with excellent communication skills and a passion for delivering cutting-edge & practical insights for the market. Proficient in multi-tasking, and can successfully deal with competing demands, while maintaining complete confidentiality. Generated business through active client and project development, networking, and high-quality responses. Her knowledge and skills have helped in making solid business decisions, securing funding from investors, and avoiding business failures.

    Leave a Comment

    FAQs

    How much is the green ammonia market?

    The Green Ammonia Market size was valued at USD 1.57 Billion in 2024.

    What is the growth rate of the green ammonia market?

    Green Ammonia Market is projected to register a CAGR of 73.5% from 2025-2035

    Which region held the largest market share in the green ammonia market?

    North America had the largest share in the global market

    Who are the key players in the green ammonia market?

    The key players in the market are Siemens AG, NEL ASA, ThyssenKrupp, ITM Power, CF Industries Holdings, Inc., Ballard Power Systems, AMMPower Corp, FUELPOSITIVE Corporation, Haldor Topsoe, Uniper, Hyport Duqm, Enapter, Starfire Energy, Engie, BASF SE, Yara International, Hiringa Energy, Queensland Nitrates Pty Ltd.

    Which gasifier technology led the green ammonia market?

    The proton exchange membrane electrolysis category dominated the market in 2024.

    Which gasifier application had the largest market share in the green ammonia market?

    The transportation category had the largest share in the global market.

    Market Summary

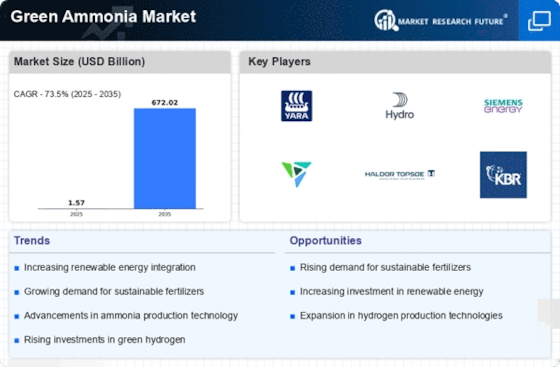
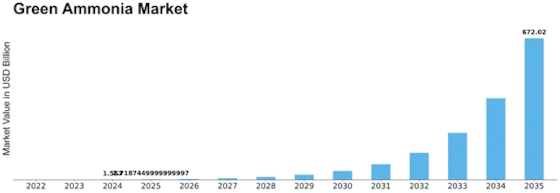
    As per Market Research Future Analysis, the Global Green Ammonia Market was valued at USD 1.57 billion in 2024 and is projected to reach USD 672.02 billion by 2035, growing at a CAGR of 73.50% from 2025 to 2035. The growth is driven by increasing green hydrogen projects, investments in the hydrogen economy, and rising demand in agriculture and power generation sectors. The market is supported by a shift towards sustainable fertilizers and the advantages of ammonia over liquid hydrogen in energy density and transport efficiency.

    Key Market Trends & Highlights

    The green ammonia market is witnessing significant trends driven by sustainability and technological advancements.

    • Fertilizer demand rose 5.4% from 2021 to 2022, boosting green ammonia sales. Proton Exchange Membrane Electrolysis dominated the gasifier technology segment due to its efficiency above 90%. Transportation applications generated the highest revenue, driven by the global fuel energy crisis. Europe is expected to grow at the fastest CAGR from 2023 to 2032, with Germany holding the largest market share.

    Market Size & Forecast

    2024 Market Size USD 1.57 Billion
    2035 Market Size USD 672.02 Billion
    CAGR (2025-2035) 73.50%
    Largest Regional Market Share in 2024 North America

    Major Players

    <p>Key players include Siemens AG, NEL ASA, ThyssenKrupp, ITM Power, CF Industries Holdings, Inc., Ballard Power Systems, Yara International, and others.</p>

    Market Trends

    Growing Demand for Sustainable Fertilisers to Support the Market Growth

    Growing agricultural productivity, notably in Asia and Africa, is driving up fertiliser demand on a global scale. The Food and Agriculture Organisation reports that overall fertiliser usage rose 5.4% from 2021 to 2022 year over year, with additional increases anticipated in the future. But the increasing use of chemical pesticides and fertilisers has decreased soil quality, necessitating the development of sustainable agriculture solutions. To meet this need, chemical manufacturers are converting to eco-friendly and sustainable goods, such green ammonia. Sales of green ammonia are anticipated to increase dramatically as a result of this trend.

    Additionally, since fertilisers, such as ammonia, are an essential component of the green ammonia production process, an increase in the demand for fertilisers is expected to result in a significant rise in ammonia consumption. At first, only a select few customers could be able to pay the higher price of green ammonia. However, when this sustainable option gains greater traction in the market, more consumers might start to use it. Long-term, this would result in widespread use of green ammonia in the industrial and fertiliser markets, which would fuel the expansion of the green ammonia market CAGR globally.

    Since ammonia has a far higher energy density compared to its volume than liquid hydrogen does, it can transfer much greater amounts of energy in a less amount of space. Ammonia may be stored and transported more conveniently because it liquefies at -33 °C. The need for intense cooling while transporting liquid hydrogen, on the other hand, necessitates up to an additional 40% of the energy content. As a result, green ammonia transport is not only more convenient than green hydrogen, but also safer and more economical.

    Ammonia as a marine fuel is currently being tested in a number of projects. By 2024, Yara hopes to supply an upgraded North Sea supply ship with ammonia for use as a marine fuel. A viable alternative to tamoxifen is the export of renewable green energy from rural places with abundant wind, sun, or geothermal energy to larger urban centers. In the long run, renewable ammonia is probably going to replace fossil fuel ammonia as the primary fuel for shipping renewable energy across continents because of all these advantageous factors. Thus, driving the green ammonia market revenue.

    <p>The transition towards green ammonia is poised to reshape global energy systems, offering a sustainable alternative for hydrogen production and contributing to decarbonization efforts across various sectors.</p>

    U.S. Department of Energy

    Green Ammonia Market Market Drivers

    Government Initiatives and Policies

    Government initiatives play a pivotal role in shaping the Global Green Ammonia Market Industry. Many countries are implementing policies that promote the use of green ammonia as part of their broader climate action strategies. For instance, subsidies and incentives for renewable energy projects are encouraging the production of green ammonia. These policies not only support the transition to sustainable energy sources but also aim to achieve net-zero emissions targets. As a result, the market is expected to grow from 500 USD Million in 2024 to 2500 USD Million by 2035, reflecting a compound annual growth rate of 15.76% from 2025 to 2035, indicating a strong commitment to sustainable practices.

    Increasing Global Energy Transition

    The ongoing global energy transition is a significant driver for the Global Green Ammonia Market Industry. As nations strive to reduce reliance on fossil fuels, the demand for alternative energy carriers like green ammonia is increasing. This transition is supported by international agreements aimed at curbing greenhouse gas emissions. The market is poised for substantial growth, with estimates projecting it to expand from 500 USD Million in 2024 to 2500 USD Million by 2035. The anticipated compound annual growth rate of 15.76% from 2025 to 2035 reflects the growing recognition of green ammonia as a viable solution in the quest for sustainable energy.

    Growing Interest in Hydrogen Economy

    The Global Green Ammonia Market Industry is closely linked to the burgeoning hydrogen economy. Green ammonia serves as an effective carrier for hydrogen, facilitating its storage and transportation. As industries and governments explore hydrogen as a clean energy source, the demand for green ammonia is expected to rise. This relationship is particularly relevant in regions investing heavily in hydrogen infrastructure. The market's growth potential is underscored by projections indicating a rise from 500 USD Million in 2024 to 2500 USD Million by 2035, suggesting that green ammonia could play a crucial role in the future energy landscape.

    Technological Advancements in Production

    Technological advancements are significantly influencing the Global Green Ammonia Market Industry, particularly in production methods. Innovations in electrolysis and Haber-Bosch processes are enhancing the efficiency and cost-effectiveness of green ammonia production. These advancements enable the utilization of renewable energy sources, such as wind and solar, to produce ammonia without carbon emissions. As technology continues to evolve, it is likely that production costs will decrease, making green ammonia more competitive with traditional ammonia. This shift is crucial for meeting the projected market growth, which is anticipated to reach 2500 USD Million by 2035, driven by increased adoption of these technologies.

    Rising Demand for Sustainable Fertilizers

    The Global Green Ammonia Market Industry is witnessing a surge in demand for sustainable fertilizers, driven by the agricultural sector's increasing focus on environmentally friendly practices. Green ammonia, produced through renewable energy sources, serves as a carbon-neutral alternative to traditional ammonia fertilizers. This shift is particularly evident in regions where regulatory frameworks are tightening around emissions. As of 2024, the market is projected to reach 500 USD Million, with expectations to expand significantly as farmers adopt greener practices. This trend aligns with global initiatives aimed at reducing carbon footprints in agriculture, suggesting a robust growth trajectory for green ammonia in the coming years.

    Market Segment Insights

    Green Ammonia Gasifier Technology Insights

    <p>The Green Ammonia Market segmentation, based on gasifier technology includes Alkaline Water Electrolysis, Proton Exchange Membrane Electrolysis and Solid Oxide Electrolysis. The proton exchange membrane electrolysis segment dominated the market. The reason for this is because people are becoming more aware of the benefits of this technology, which has an electric efficiency of above 90% and large current densities at low voltages. Favourable government incentives for the generation of green and clean energy as well as enhanced R&amp;D on fuel cell technologies can also boost product demand.</p>

    Green Ammonia Gasifier Application Insights

    <p>The Green Ammonia Market segmentation, based on gasifier application, includes Power Generation, Transportation and Industrial Feedstocks. The transportation category generated the most income. The worldwide fuel energy crisis, which has fueled the need for green fuel, is to blame for its large share. Renewable sources, including green ammonia and others, are replacing conventional ones. These sources generate fuel that is clean, effective, and environmentally benign. Global attention is being given to issues like environmental preservation and carbon emissions.</p>

    <p>Figure 1: Green Ammonia Market, by Gasifier Application, 2022 &amp; 2032 (USD billion)</p>

    <p>Source: Secondary Research, Primary Research, Market Research Future Database and Analyst Review</p>

    Get more detailed insights about Green Ammonia Market Research Report—Global Forecast till 2035

    Regional Insights

    By Region, the study provides the market insights into North America, Europe, Asia-Pacific and Rest of the World. The North American green ammonia market area will dominate this market. The adoption of electric vehicles in the area and increased R&D for hydrogen production are credited with this surge. In addition, market expansion is being fueled by government assistance, increasing investor involvement, and the viability of the technology in the area.

    Further, the major countries studied in the market report are The US, Canada, German, France, the UK, Italy, Spain, China, Japan, India, Australia, South Korea, and Brazil.

    Figure 2: GREEN AMMONIA MARKET SHARE BY REGION 2022 (%)

    GREEN AMMONIA MARKET SHARE BY REGION

    Source: Secondary Research, Primary Research, Market Research Future Database and Analyst Review

    Europe Green ammonia Market is expected to grow at the fastest CAGR from 2023 to 2032. Due to the increasing use of technical improvements, the product is in high demand in Spain and Germany. With the industry becoming more concentrated, Europe is home to numerous ammonia production facilities and offers booming potential for manufacturers. Further, the German green ammonia market held the largest market share, and the Spain green ammonia market was the fastest growing market in the European region

    Asia Pacific green ammonia market accounts for the second-largest market share. This is a result of government policies and programmes that aim to cut carbon emissions and promote renewable energy. For instance, the Indian government has offered subsidies to encourage the usage of electric cars there. Moreover, China’s green ammonia market held the largest market share, and the Indian green ammonia market was the fastest growing market in the Asia-Pacific region.

    Key Players and Competitive Insights

    Leading market players are investing heavily in research and development in order to expand their product lines, which will help the green ammonia market, grow even more. Market participants are also undertaking a variety of strategic activities to expand their global footprint, with important market developments including new product launches, contractual agreements, mergers and acquisitions, higher investments, and collaboration with other organizations. To expand and survive in a more competitive and rising market climate, green ammonia industry must offer cost-effective items.

    Manufacturing locally to minimize operational costs is one of the key business tactics used by manufacturers in the global green ammonia industry to benefit clients and increase the market sector. In recent years, the green ammonia industry has offered some of the most significant advantages.

    Major players in the green ammonia market are attempting to increase market demand by investing in research and development operations are Siemens AG, NEL ASA, ThyssenKrupp, ITM Power, CF Industries Holdings, Inc., Ballard Power Systems, AMMPower Corp, FUELPOSITIVE Corporation, Haldor Topsoe, Uniper, Hyport Duqm, Enapter, Starfire Energy, Engie, BASF SE, Yara International, Hiringa Energy, Queensland Nitrates Pty Ltd.

    The industrial group ThyssenKrupp AG (ThyssenKrupp) was founded. Automobile, building, steel, and related processing, energy and utilities, public sector, packaging, trading, engineering, and other customer sectors are among its business segments. Steel goods, component technology solutions, maritime systems, supply chain management, and automation solutions for automotive OEMs are among the services offered by the business. ThyssenKrupp also offers services for industrial systems and plants and acts as a partner in engineering and construction.

    In August 2021, Thyssenkrupp AG and Helios, a business based in the United Arab Emirates, have a contract for the construction of a plant to produce green hydrogen and green ammonia using the latter's patented technology.

    ITM Power Plc (ITM Power) is a manufacturer and designer of hydrogen energy systems for the production of clean fuels and energy storage. The business creates tools to transform renewable energy into a clean fuel that can be stored for use in transportation, industry, and household uses, as well as a variety of materials that help lower the cost of hydrogen generation. Electrolysis equipment and hydrogen storage systems are sold by ITM Power, which also develops and produces prototype items.

    In April 2020, the UK government awarded ITM Energy a project to create green hydrogen production methods employing 100 MW electrolyzers.

    Key Companies in the Green Ammonia Market market include

    Industry Developments

    In January of 2024, Yara International declared its intentions to increase its green ammonia production in Norway. The company intends to modernize their current facilities and seize opportunities to capture renewable energy to produce low carbon fertilizers and more for industrial uses. This expansion is part of Yara’s initiatives to cut emissions and increase sustainable agriculture.

    In December of 2023 CF Industries Holdings, Inc. entered a large agreement with another renewable energy company to construct a green ammonia facility in the United States. The plant is expected to harness carbon-free ammonia utilizing wind and solar powered electrolyzers, thereby fulfilling the increased demand in the shipping and power generation fuels.

    In November of 2023 Siemens Energy partnered with Linde Engineering to develop a new method of producing green ammonia to help reduce the cost of production. The companies said that the focus of the project is combining modern electrolysis with nitrogen separation to achieve increased clarity in green ammonia production.

    In August 2023, Thyssenkrupp Uhde revealed the adoption of a new modular green ammonia production system with renewable energy-powered modular electrolyzers. The system is intended for remote regions with high solar and wind energy potential to enable the production of ammonia in an off grid decentralised manner.

    In July 2023, LSB Industries Inc. entered into a contract with one well known renewable energy supplier to fabricate one of their ammonia plants in the Usa into a green ammonia plant. The company plans to shift from the traditional form of ammonia produced using fossil fuels toward a fully sustainable system within five years.

    In June 2023 Iberdrola and Fertiberia announced their ambitions to enhance their production of green ammonia in Spain. The firms aim to provide low-emission ammonia to agriculture and transport industries, thus facilitating the European Union de-carbonization efforts.

    Future Outlook

    Green Ammonia Market Future Outlook

    <p>The Green Ammonia Market is projected to grow at a 73.50% CAGR from 2025 to 2035, driven by increasing demand for sustainable energy solutions and advancements in production technologies.</p>

    New opportunities lie in:

    • <p>Develop innovative electrolysis technologies to enhance ammonia production efficiency. Invest in strategic partnerships with renewable energy providers for sustainable sourcing. Explore applications in hydrogen storage and transportation to diversify market reach.</p>

    <p>By 2035, the Green Ammonia Market is expected to be a pivotal player in the global energy transition.</p>

    Market Segmentation

    Green Ammonia Regional Outlook (USD Billion, 2018-2032)

    • {"North America"=>["US"
    • "Canada"]}
    • {"Europe"=>["Germany"
    • "France"
    • "UK"
    • "Italy"
    • "Spain"
    • "Rest of Europe"]}
    • {"Asia-Pacific"=>["China"
    • "Japan"
    • "India"
    • "Australia"
    • "South Korea"
    • "Rest of Asia-Pacific"]}
    • {"Rest of the World"=>["Middle East"
    • "Africa"
    • "Latin America"]}

    Green Ammonia Gasifier Technology Outlook (USD Billion, 2018-2032)

    • Älkaline Water Electrolysis
    • Proton Exchange Membrane Electrolysis
    • Solid Oxide Electrolysis

    Green Ammonia Gasifier Application Outlook (USD Billion, 2018-2032)

    • Power Generation
    • Transportation
    • Industrial Feedstocks

    Report Scope

    Report Attribute/Metric Details
    Market Size 2024 USD 1.57 billion
    Market Size 2025 USD 2.72  billion
    Market Size 2035 672.02 (Value (USD Billion))
    Compound Annual Growth Rate (CAGR) 73.50% (2025 - 2035)
    Base Year 2024
    Market Forecast Period 2025 - 2035
    Historical Data 2020- 2024
    Market Forecast Units Value (USD Billion)
    Report Coverage Revenue Forecast, Market Competitive Landscape, Growth Factors, and Trends
    Segments Covered Gasifier Technology, Gasifier Application, and Region
    Geographies Covered North America, Europe, Asia Pacific, and the Rest of the World
    Countries Covered The US, Canada, German, France, UK, Italy, Spain, China, Japan, India, Australia, South Korea, and Brazil
    Key Companies Profiled Siemens AG, NEL ASA, ThyssenKrupp, ITM Power, CF Industries Holdings, Inc., Ballard Power Systems, AMMPower Corp, FUELPOSITIVE Corporation, Haldor Topsoe, Uniper, Hyport Duqm, Enapter, Starfire Energy, Engie, BASF SE, Yara International, Hiringa Energy, Queensland Nitrates Pty Ltd
    Key Market Opportunities Increasing Need to Cut Greenhouse Gas Emissions
    Key Market Dynamics Increasing Use of Energy-Efficient Technologies

    FAQs

    How much is the green ammonia market?

    The Green Ammonia Market size was valued at USD 1.57 Billion in 2024.

    What is the growth rate of the green ammonia market?

    Green Ammonia Market is projected to register a CAGR of 73.5% from 2025-2035

    Which region held the largest market share in the green ammonia market?

    North America had the largest share in the global market

    Who are the key players in the green ammonia market?

    The key players in the market are Siemens AG, NEL ASA, ThyssenKrupp, ITM Power, CF Industries Holdings, Inc., Ballard Power Systems, AMMPower Corp, FUELPOSITIVE Corporation, Haldor Topsoe, Uniper, Hyport Duqm, Enapter, Starfire Energy, Engie, BASF SE, Yara International, Hiringa Energy, Queensland Nitrates Pty Ltd.

    Which gasifier technology led the green ammonia market?

    The proton exchange membrane electrolysis category dominated the market in 2024.

    Which gasifier application had the largest market share in the green ammonia market?

    The transportation category had the largest share in the global market.

    1. SECTION I: EXECUTIVE SUMMARY AND KEY HIGHLIGHTS
      1. | 1.1 EXECUTIVE SUMMARY
      2. | | 1.1.1 Market Overview
      3. | | 1.1.2 Key Findings
      4. | | 1.1.3 Market Segmentation
      5. | | 1.1.4 Competitive Landscape
      6. | | 1.1.5 Challenges and Opportunities
      7. | | 1.1.6 Future Outlook
    2. SECTION II: SCOPING, METHODOLOGY AND MARKET STRUCTURE
      1. | 2.1 MARKET INTRODUCTION
      2. | | 2.1.1 Definition
      3. | | 2.1.2 Scope of the study
      4. | | | 2.1.2.1 Research Objective
      5. | | | 2.1.2.2 Assumption
      6. | | | 2.1.2.3 Limitations
      7. | 2.2 RESEARCH METHODOLOGY
      8. | | 2.2.1 Overview
      9. | | 2.2.2 Data Mining
      10. | | 2.2.3 Secondary Research
      11. | | 2.2.4 Primary Research
      12. | | | 2.2.4.1 Primary Interviews and Information Gathering Process
      13. | | | 2.2.4.2 Breakdown of Primary Respondents
      14. | | 2.2.5 Forecasting Model
      15. | | 2.2.6 Market Size Estimation
      16. | | | 2.2.6.1 Bottom-Up Approach
      17. | | | 2.2.6.2 Top-Down Approach
      18. | | 2.2.7 Data Triangulation
      19. | | 2.2.8 Validation
    3. SECTION III: QUALITATIVE ANALYSIS
      1. | 3.1 MARKET DYNAMICS
      2. | | 3.1.1 Overview
      3. | | 3.1.2 Drivers
      4. | | 3.1.3 Restraints
      5. | | 3.1.4 Opportunities
      6. | 3.2 MARKET FACTOR ANALYSIS
      7. | | 3.2.1 Value chain Analysis
      8. | | 3.2.2 Porter's Five Forces Analysis
      9. | | | 3.2.2.1 Bargaining Power of Suppliers
      10. | | | 3.2.2.2 Bargaining Power of Buyers
      11. | | | 3.2.2.3 Threat of New Entrants
      12. | | | 3.2.2.4 Threat of Substitutes
      13. | | | 3.2.2.5 Intensity of Rivalry
      14. | | 3.2.3 COVID-19 Impact Analysis
      15. | | | 3.2.3.1 Market Impact Analysis
      16. | | | 3.2.3.2 Regional Impact
      17. | | | 3.2.3.3 Opportunity and Threat Analysis
    4. SECTION IV: QUANTITATIVE ANALYSIS
      1. | 4.1 Chemicals and Materials, BY Gasifier Technology (USD Billion)
      2. | | 4.1.1 Alkaline Water Electrolysis
      3. | | 4.1.2 Proton Exchange Membrane Electrolysis
      4. | | 4.1.3 Solid Oxide Electrolysis
      5. | 4.2 Chemicals and Materials, BY Gasifier Application (USD Billion)
      6. | | 4.2.1 Power Generation
      7. | | 4.2.2 Transportation
      8. | | 4.2.3 Industrial Feedstocks
      9. | 4.3 Chemicals and Materials, BY Region (USD Billion)
      10. | | 4.3.1 North America
      11. | | | 4.3.1.1 US
      12. | | | 4.3.1.2 Canada
      13. | | 4.3.2 Europe
      14. | | | 4.3.2.1 Germany
      15. | | | 4.3.2.2 UK
      16. | | | 4.3.2.3 France
      17. | | | 4.3.2.4 Russia
      18. | | | 4.3.2.5 Italy
      19. | | | 4.3.2.6 Spain
      20. | | | 4.3.2.7 Rest of Europe
      21. | | 4.3.3 APAC
      22. | | | 4.3.3.1 China
      23. | | | 4.3.3.2 India
      24. | | | 4.3.3.3 Japan
      25. | | | 4.3.3.4 South Korea
      26. | | | 4.3.3.5 Malaysia
      27. | | | 4.3.3.6 Thailand
      28. | | | 4.3.3.7 Indonesia
      29. | | | 4.3.3.8 Rest of APAC
      30. | | 4.3.4 South America
      31. | | | 4.3.4.1 Brazil
      32. | | | 4.3.4.2 Mexico
      33. | | | 4.3.4.3 Argentina
      34. | | | 4.3.4.4 Rest of South America
      35. | | 4.3.5 MEA
      36. | | | 4.3.5.1 GCC Countries
      37. | | | 4.3.5.2 South Africa
      38. | | | 4.3.5.3 Rest of MEA
    5. SECTION V: COMPETITIVE ANALYSIS
      1. | 5.1 Competitive Landscape
      2. | | 5.1.1 Overview
      3. | | 5.1.2 Competitive Analysis
      4. | | 5.1.3 Market share Analysis
      5. | | 5.1.4 Major Growth Strategy in the Chemicals and Materials
      6. | | 5.1.5 Competitive Benchmarking
      7. | | 5.1.6 Leading Players in Terms of Number of Developments in the Chemicals and Materials
      8. | | 5.1.7 Key developments and growth strategies
      9. | | | 5.1.7.1 New Product Launch/Service Deployment
      10. | | | 5.1.7.2 Merger & Acquisitions
      11. | | | 5.1.7.3 Joint Ventures
      12. | | 5.1.8 Major Players Financial Matrix
      13. | | | 5.1.8.1 Sales and Operating Income
      14. | | | 5.1.8.2 Major Players R&D Expenditure. 2023
      15. | 5.2 Company Profiles
      16. | | 5.2.1 Yara International (NO)
      17. | | | 5.2.1.1 Financial Overview
      18. | | | 5.2.1.2 Products Offered
      19. | | | 5.2.1.3 Key Developments
      20. | | | 5.2.1.4 SWOT Analysis
      21. | | | 5.2.1.5 Key Strategies
      22. | | 5.2.2 Norsk Hydro (NO)
      23. | | | 5.2.2.1 Financial Overview
      24. | | | 5.2.2.2 Products Offered
      25. | | | 5.2.2.3 Key Developments
      26. | | | 5.2.2.4 SWOT Analysis
      27. | | | 5.2.2.5 Key Strategies
      28. | | 5.2.3 Siemens Energy (DE)
      29. | | | 5.2.3.1 Financial Overview
      30. | | | 5.2.3.2 Products Offered
      31. | | | 5.2.3.3 Key Developments
      32. | | | 5.2.3.4 SWOT Analysis
      33. | | | 5.2.3.5 Key Strategies
      34. | | 5.2.4 CF Industries (US)
      35. | | | 5.2.4.1 Financial Overview
      36. | | | 5.2.4.2 Products Offered
      37. | | | 5.2.4.3 Key Developments
      38. | | | 5.2.4.4 SWOT Analysis
      39. | | | 5.2.4.5 Key Strategies
      40. | | 5.2.5 Haldor Topsoe (DK)
      41. | | | 5.2.5.1 Financial Overview
      42. | | | 5.2.5.2 Products Offered
      43. | | | 5.2.5.3 Key Developments
      44. | | | 5.2.5.4 SWOT Analysis
      45. | | | 5.2.5.5 Key Strategies
      46. | | 5.2.6 KBR (US)
      47. | | | 5.2.6.1 Financial Overview
      48. | | | 5.2.6.2 Products Offered
      49. | | | 5.2.6.3 Key Developments
      50. | | | 5.2.6.4 SWOT Analysis
      51. | | | 5.2.6.5 Key Strategies
      52. | | 5.2.7 Thyssenkrupp (DE)
      53. | | | 5.2.7.1 Financial Overview
      54. | | | 5.2.7.2 Products Offered
      55. | | | 5.2.7.3 Key Developments
      56. | | | 5.2.7.4 SWOT Analysis
      57. | | | 5.2.7.5 Key Strategies
      58. | | 5.2.8 ACWA Power (SA)
      59. | | | 5.2.8.1 Financial Overview
      60. | | | 5.2.8.2 Products Offered
      61. | | | 5.2.8.3 Key Developments
      62. | | | 5.2.8.4 SWOT Analysis
      63. | | | 5.2.8.5 Key Strategies
      64. | | 5.2.9 Green Hydrogen Systems (DK)
      65. | | | 5.2.9.1 Financial Overview
      66. | | | 5.2.9.2 Products Offered
      67. | | | 5.2.9.3 Key Developments
      68. | | | 5.2.9.4 SWOT Analysis
      69. | | | 5.2.9.5 Key Strategies
      70. | 5.3 Appendix
      71. | | 5.3.1 References
      72. | | 5.3.2 Related Reports
    6. LIST OF FIGURES
      1. | 6.1 MARKET SYNOPSIS
      2. | 6.2 NORTH AMERICA MARKET ANALYSIS
      3. | 6.3 US MARKET ANALYSIS BY GASIFIER TECHNOLOGY
      4. | 6.4 US MARKET ANALYSIS BY GASIFIER APPLICATION
      5. | 6.5 CANADA MARKET ANALYSIS BY GASIFIER TECHNOLOGY
      6. | 6.6 CANADA MARKET ANALYSIS BY GASIFIER APPLICATION
      7. | 6.7 EUROPE MARKET ANALYSIS
      8. | 6.8 GERMANY MARKET ANALYSIS BY GASIFIER TECHNOLOGY
      9. | 6.9 GERMANY MARKET ANALYSIS BY GASIFIER APPLICATION
      10. | 6.10 UK MARKET ANALYSIS BY GASIFIER TECHNOLOGY
      11. | 6.11 UK MARKET ANALYSIS BY GASIFIER APPLICATION
      12. | 6.12 FRANCE MARKET ANALYSIS BY GASIFIER TECHNOLOGY
      13. | 6.13 FRANCE MARKET ANALYSIS BY GASIFIER APPLICATION
      14. | 6.14 RUSSIA MARKET ANALYSIS BY GASIFIER TECHNOLOGY
      15. | 6.15 RUSSIA MARKET ANALYSIS BY GASIFIER APPLICATION
      16. | 6.16 ITALY MARKET ANALYSIS BY GASIFIER TECHNOLOGY
      17. | 6.17 ITALY MARKET ANALYSIS BY GASIFIER APPLICATION
      18. | 6.18 SPAIN MARKET ANALYSIS BY GASIFIER TECHNOLOGY
      19. | 6.19 SPAIN MARKET ANALYSIS BY GASIFIER APPLICATION
      20. | 6.20 REST OF EUROPE MARKET ANALYSIS BY GASIFIER TECHNOLOGY
      21. | 6.21 REST OF EUROPE MARKET ANALYSIS BY GASIFIER APPLICATION
      22. | 6.22 APAC MARKET ANALYSIS
      23. | 6.23 CHINA MARKET ANALYSIS BY GASIFIER TECHNOLOGY
      24. | 6.24 CHINA MARKET ANALYSIS BY GASIFIER APPLICATION
      25. | 6.25 INDIA MARKET ANALYSIS BY GASIFIER TECHNOLOGY
      26. | 6.26 INDIA MARKET ANALYSIS BY GASIFIER APPLICATION
      27. | 6.27 JAPAN MARKET ANALYSIS BY GASIFIER TECHNOLOGY
      28. | 6.28 JAPAN MARKET ANALYSIS BY GASIFIER APPLICATION
      29. | 6.29 SOUTH KOREA MARKET ANALYSIS BY GASIFIER TECHNOLOGY
      30. | 6.30 SOUTH KOREA MARKET ANALYSIS BY GASIFIER APPLICATION
      31. | 6.31 MALAYSIA MARKET ANALYSIS BY GASIFIER TECHNOLOGY
      32. | 6.32 MALAYSIA MARKET ANALYSIS BY GASIFIER APPLICATION
      33. | 6.33 THAILAND MARKET ANALYSIS BY GASIFIER TECHNOLOGY
      34. | 6.34 THAILAND MARKET ANALYSIS BY GASIFIER APPLICATION
      35. | 6.35 INDONESIA MARKET ANALYSIS BY GASIFIER TECHNOLOGY
      36. | 6.36 INDONESIA MARKET ANALYSIS BY GASIFIER APPLICATION
      37. | 6.37 REST OF APAC MARKET ANALYSIS BY GASIFIER TECHNOLOGY
      38. | 6.38 REST OF APAC MARKET ANALYSIS BY GASIFIER APPLICATION
      39. | 6.39 SOUTH AMERICA MARKET ANALYSIS
      40. | 6.40 BRAZIL MARKET ANALYSIS BY GASIFIER TECHNOLOGY
      41. | 6.41 BRAZIL MARKET ANALYSIS BY GASIFIER APPLICATION
      42. | 6.42 MEXICO MARKET ANALYSIS BY GASIFIER TECHNOLOGY
      43. | 6.43 MEXICO MARKET ANALYSIS BY GASIFIER APPLICATION
      44. | 6.44 ARGENTINA MARKET ANALYSIS BY GASIFIER TECHNOLOGY
      45. | 6.45 ARGENTINA MARKET ANALYSIS BY GASIFIER APPLICATION
      46. | 6.46 REST OF SOUTH AMERICA MARKET ANALYSIS BY GASIFIER TECHNOLOGY
      47. | 6.47 REST OF SOUTH AMERICA MARKET ANALYSIS BY GASIFIER APPLICATION
      48. | 6.48 MEA MARKET ANALYSIS
      49. | 6.49 GCC COUNTRIES MARKET ANALYSIS BY GASIFIER TECHNOLOGY
      50. | 6.50 GCC COUNTRIES MARKET ANALYSIS BY GASIFIER APPLICATION
      51. | 6.51 SOUTH AFRICA MARKET ANALYSIS BY GASIFIER TECHNOLOGY
      52. | 6.52 SOUTH AFRICA MARKET ANALYSIS BY GASIFIER APPLICATION
      53. | 6.53 REST OF MEA MARKET ANALYSIS BY GASIFIER TECHNOLOGY
      54. | 6.54 REST OF MEA MARKET ANALYSIS BY GASIFIER APPLICATION
      55. | 6.55 KEY BUYING CRITERIA OF CHEMICALS AND MATERIALS
      56. | 6.56 RESEARCH PROCESS OF MRFR
      57. | 6.57 DRO ANALYSIS OF CHEMICALS AND MATERIALS
      58. | 6.58 DRIVERS IMPACT ANALYSIS: CHEMICALS AND MATERIALS
      59. | 6.59 RESTRAINTS IMPACT ANALYSIS: CHEMICALS AND MATERIALS
      60. | 6.60 SUPPLY / VALUE CHAIN: CHEMICALS AND MATERIALS
      61. | 6.61 CHEMICALS AND MATERIALS, BY GASIFIER TECHNOLOGY, 2024 (% SHARE)
      62. | 6.62 CHEMICALS AND MATERIALS, BY GASIFIER TECHNOLOGY, 2024 TO 2035 (USD Billion)
      63. | 6.63 CHEMICALS AND MATERIALS, BY GASIFIER APPLICATION, 2024 (% SHARE)
      64. | 6.64 CHEMICALS AND MATERIALS, BY GASIFIER APPLICATION, 2024 TO 2035 (USD Billion)
      65. | 6.65 BENCHMARKING OF MAJOR COMPETITORS
    7. LIST OF TABLES
      1. | 7.1 LIST OF ASSUMPTIONS
      2. | | 7.1.1
      3. | 7.2 North America MARKET SIZE ESTIMATES; FORECAST
      4. | | 7.2.1 BY GASIFIER TECHNOLOGY, 2025-2035 (USD Billion)
      5. | | 7.2.2 BY GASIFIER APPLICATION, 2025-2035 (USD Billion)
      6. | 7.3 US MARKET SIZE ESTIMATES; FORECAST
      7. | | 7.3.1 BY GASIFIER TECHNOLOGY, 2025-2035 (USD Billion)
      8. | | 7.3.2 BY GASIFIER APPLICATION, 2025-2035 (USD Billion)
      9. | 7.4 Canada MARKET SIZE ESTIMATES; FORECAST
      10. | | 7.4.1 BY GASIFIER TECHNOLOGY, 2025-2035 (USD Billion)
      11. | | 7.4.2 BY GASIFIER APPLICATION, 2025-2035 (USD Billion)
      12. | 7.5 Europe MARKET SIZE ESTIMATES; FORECAST
      13. | | 7.5.1 BY GASIFIER TECHNOLOGY, 2025-2035 (USD Billion)
      14. | | 7.5.2 BY GASIFIER APPLICATION, 2025-2035 (USD Billion)
      15. | 7.6 Germany MARKET SIZE ESTIMATES; FORECAST
      16. | | 7.6.1 BY GASIFIER TECHNOLOGY, 2025-2035 (USD Billion)
      17. | | 7.6.2 BY GASIFIER APPLICATION, 2025-2035 (USD Billion)
      18. | 7.7 UK MARKET SIZE ESTIMATES; FORECAST
      19. | | 7.7.1 BY GASIFIER TECHNOLOGY, 2025-2035 (USD Billion)
      20. | | 7.7.2 BY GASIFIER APPLICATION, 2025-2035 (USD Billion)
      21. | 7.8 France MARKET SIZE ESTIMATES; FORECAST
      22. | | 7.8.1 BY GASIFIER TECHNOLOGY, 2025-2035 (USD Billion)
      23. | | 7.8.2 BY GASIFIER APPLICATION, 2025-2035 (USD Billion)
      24. | 7.9 Russia MARKET SIZE ESTIMATES; FORECAST
      25. | | 7.9.1 BY GASIFIER TECHNOLOGY, 2025-2035 (USD Billion)
      26. | | 7.9.2 BY GASIFIER APPLICATION, 2025-2035 (USD Billion)
      27. | 7.10 Italy MARKET SIZE ESTIMATES; FORECAST
      28. | | 7.10.1 BY GASIFIER TECHNOLOGY, 2025-2035 (USD Billion)
      29. | | 7.10.2 BY GASIFIER APPLICATION, 2025-2035 (USD Billion)
      30. | 7.11 Spain MARKET SIZE ESTIMATES; FORECAST
      31. | | 7.11.1 BY GASIFIER TECHNOLOGY, 2025-2035 (USD Billion)
      32. | | 7.11.2 BY GASIFIER APPLICATION, 2025-2035 (USD Billion)
      33. | 7.12 Rest of Europe MARKET SIZE ESTIMATES; FORECAST
      34. | | 7.12.1 BY GASIFIER TECHNOLOGY, 2025-2035 (USD Billion)
      35. | | 7.12.2 BY GASIFIER APPLICATION, 2025-2035 (USD Billion)
      36. | 7.13 APAC MARKET SIZE ESTIMATES; FORECAST
      37. | | 7.13.1 BY GASIFIER TECHNOLOGY, 2025-2035 (USD Billion)
      38. | | 7.13.2 BY GASIFIER APPLICATION, 2025-2035 (USD Billion)
      39. | 7.14 China MARKET SIZE ESTIMATES; FORECAST
      40. | | 7.14.1 BY GASIFIER TECHNOLOGY, 2025-2035 (USD Billion)
      41. | | 7.14.2 BY GASIFIER APPLICATION, 2025-2035 (USD Billion)
      42. | 7.15 India MARKET SIZE ESTIMATES; FORECAST
      43. | | 7.15.1 BY GASIFIER TECHNOLOGY, 2025-2035 (USD Billion)
      44. | | 7.15.2 BY GASIFIER APPLICATION, 2025-2035 (USD Billion)
      45. | 7.16 Japan MARKET SIZE ESTIMATES; FORECAST
      46. | | 7.16.1 BY GASIFIER TECHNOLOGY, 2025-2035 (USD Billion)
      47. | | 7.16.2 BY GASIFIER APPLICATION, 2025-2035 (USD Billion)
      48. | 7.17 South Korea MARKET SIZE ESTIMATES; FORECAST
      49. | | 7.17.1 BY GASIFIER TECHNOLOGY, 2025-2035 (USD Billion)
      50. | | 7.17.2 BY GASIFIER APPLICATION, 2025-2035 (USD Billion)
      51. | 7.18 Malaysia MARKET SIZE ESTIMATES; FORECAST
      52. | | 7.18.1 BY GASIFIER TECHNOLOGY, 2025-2035 (USD Billion)
      53. | | 7.18.2 BY GASIFIER APPLICATION, 2025-2035 (USD Billion)
      54. | 7.19 Thailand MARKET SIZE ESTIMATES; FORECAST
      55. | | 7.19.1 BY GASIFIER TECHNOLOGY, 2025-2035 (USD Billion)
      56. | | 7.19.2 BY GASIFIER APPLICATION, 2025-2035 (USD Billion)
      57. | 7.20 Indonesia MARKET SIZE ESTIMATES; FORECAST
      58. | | 7.20.1 BY GASIFIER TECHNOLOGY, 2025-2035 (USD Billion)
      59. | | 7.20.2 BY GASIFIER APPLICATION, 2025-2035 (USD Billion)
      60. | 7.21 Rest of APAC MARKET SIZE ESTIMATES; FORECAST
      61. | | 7.21.1 BY GASIFIER TECHNOLOGY, 2025-2035 (USD Billion)
      62. | | 7.21.2 BY GASIFIER APPLICATION, 2025-2035 (USD Billion)
      63. | 7.22 South America MARKET SIZE ESTIMATES; FORECAST
      64. | | 7.22.1 BY GASIFIER TECHNOLOGY, 2025-2035 (USD Billion)
      65. | | 7.22.2 BY GASIFIER APPLICATION, 2025-2035 (USD Billion)
      66. | 7.23 Brazil MARKET SIZE ESTIMATES; FORECAST
      67. | | 7.23.1 BY GASIFIER TECHNOLOGY, 2025-2035 (USD Billion)
      68. | | 7.23.2 BY GASIFIER APPLICATION, 2025-2035 (USD Billion)
      69. | 7.24 Mexico MARKET SIZE ESTIMATES; FORECAST
      70. | | 7.24.1 BY GASIFIER TECHNOLOGY, 2025-2035 (USD Billion)
      71. | | 7.24.2 BY GASIFIER APPLICATION, 2025-2035 (USD Billion)
      72. | 7.25 Argentina MARKET SIZE ESTIMATES; FORECAST
      73. | | 7.25.1 BY GASIFIER TECHNOLOGY, 2025-2035 (USD Billion)
      74. | | 7.25.2 BY GASIFIER APPLICATION, 2025-2035 (USD Billion)
      75. | 7.26 Rest of South America MARKET SIZE ESTIMATES; FORECAST
      76. | | 7.26.1 BY GASIFIER TECHNOLOGY, 2025-2035 (USD Billion)
      77. | | 7.26.2 BY GASIFIER APPLICATION, 2025-2035 (USD Billion)
      78. | 7.27 MEA MARKET SIZE ESTIMATES; FORECAST
      79. | | 7.27.1 BY GASIFIER TECHNOLOGY, 2025-2035 (USD Billion)
      80. | | 7.27.2 BY GASIFIER APPLICATION, 2025-2035 (USD Billion)
      81. | 7.28 GCC Countries MARKET SIZE ESTIMATES; FORECAST
      82. | | 7.28.1 BY GASIFIER TECHNOLOGY, 2025-2035 (USD Billion)
      83. | | 7.28.2 BY GASIFIER APPLICATION, 2025-2035 (USD Billion)
      84. | 7.29 South Africa MARKET SIZE ESTIMATES; FORECAST
      85. | | 7.29.1 BY GASIFIER TECHNOLOGY, 2025-2035 (USD Billion)
      86. | | 7.29.2 BY GASIFIER APPLICATION, 2025-2035 (USD Billion)
      87. | 7.30 Rest of MEA MARKET SIZE ESTIMATES; FORECAST
      88. | | 7.30.1 BY GASIFIER TECHNOLOGY, 2025-2035 (USD Billion)
      89. | | 7.30.2 BY GASIFIER APPLICATION, 2025-2035 (USD Billion)
      90. | 7.31 PRODUCT LAUNCH/PRODUCT DEVELOPMENT/APPROVAL
      91. | | 7.31.1
      92. | 7.32 ACQUISITION/PARTNERSHIP
      93. | | 7.32.1

    Green Ammonia Gasifier Market Segmentation

    Green Ammonia Gasifier Technology Outlook (USD Billion, 2018-2032)

    Älkaline Water Electrolysis

    Proton Exchange Membrane Electrolysis

    Solid Oxide Electrolysis

    Green Ammonia Gasifier Application Outlook (USD Billion, 2018-2032)

    Power Generation

    Transportation

    Industrial Feedstocks

    Green Ammonia Regional Outlook (USD Billion, 2018-2032)

    North America Outlook (USD Billion, 2018-2032)

    North America Green Ammonia by Gasifier Technology

    Älkaline Water Electrolysis

    Proton Exchange Membrane Electrolysis

    Solid Oxide Electrolysis

    North America Green Ammonia by Gasifier Application

    Power Generation

    Transportation

    Industrial Feedstocks

    US Outlook (USD Billion, 2018-2032)

    US Green Ammonia by Gasifier Technology

    Älkaline Water Electrolysis

    Proton Exchange Membrane Electrolysis

    Solid Oxide Electrolysis

    US Green Ammonia by Gasifier Application

    Power Generation

    Transportation

    Industrial Feedstocks

    CANADA Outlook (USD Billion, 2018-2032)

    CANADA Green Ammonia by Gasifier Technology

    Älkaline Water Electrolysis

    Proton Exchange Membrane Electrolysis

    Solid Oxide Electrolysis

    CANADA Green Ammonia by Gasifier Application

    Power Generation

    Transportation

    Industrial Feedstocks

    Europe Outlook (USD Billion, 2018-2032)

    Europe Green Ammonia by Gasifier Technology

    Älkaline Water Electrolysis

    Proton Exchange Membrane Electrolysis

    Solid Oxide Electrolysis

    Europe Green Ammonia by Gasifier Application

    Power Generation

    Transportation

    Industrial Feedstocks

    Germany Outlook (USD Billion, 2018-2032)

    Germany Green Ammonia by Gasifier Technology

    Älkaline Water Electrolysis

    Proton Exchange Membrane Electrolysis

    Solid Oxide Electrolysis

    Germany Green Ammonia by Gasifier Application

    Power Generation

    Transportation

    Industrial Feedstocks

    France Outlook (USD Billion, 2018-2032)

    France Green Ammonia by Gasifier Technology

    Älkaline Water Electrolysis

    Proton Exchange Membrane Electrolysis

    Solid Oxide Electrolysis

    France Green Ammonia by Gasifier Application

    Power Generation

    Transportation

    Industrial Feedstocks

    UK Outlook (USD Billion, 2018-2032)

    UK Green Ammonia by Gasifier Technology

    Älkaline Water Electrolysis

    Proton Exchange Membrane Electrolysis

    Solid Oxide Electrolysis

    UK Green Ammonia by Gasifier Application

    Power Generation

    Transportation

    Industrial Feedstocks

    ITALY Outlook (USD Billion, 2018-2032)

    ITALY Green Ammonia by Gasifier Technology

    Älkaline Water Electrolysis

    Proton Exchange Membrane Electrolysis

    Solid Oxide Electrolysis

    ITALY Green Ammonia by Gasifier Application

    Power Generation

    Transportation

    Industrial Feedstocks

    SPAIN Outlook (USD Billion, 2018-2032)

    Spain Green Ammonia by Gasifier Technology

    Älkaline Water Electrolysis

    Proton Exchange Membrane Electrolysis

    Solid Oxide Electrolysis

    Spain Green Ammonia by Gasifier Application

    Power Generation

    Transportation

    Industrial Feedstocks

    Rest Of Europe Outlook (USD Billion, 2018-2032)

    Rest Of Europe Green Ammonia by Gasifier Technology

    Älkaline Water Electrolysis

    Proton Exchange Membrane Electrolysis

    Solid Oxide Electrolysis

    REST OF EUROPE Green Ammonia by Gasifier Application

    Power Generation

    Transportation

    Industrial Feedstocks

    Asia-Pacific Outlook (USD Billion, 2018-2032)

    Asia-Pacific Green Ammonia by Gasifier Technology

    Älkaline Water Electrolysis

    Proton Exchange Membrane Electrolysis

    Solid Oxide Electrolysis

    Asia-Pacific Green Ammonia by Gasifier Application

    Power Generation

    Transportation

    Industrial Feedstocks

    China Outlook (USD Billion, 2018-2032)

    China Green Ammonia by Gasifier Technology

    Älkaline Water Electrolysis

    Proton Exchange Membrane Electrolysis

    Solid Oxide Electrolysis

    China Green Ammonia by Gasifier Application

    Power Generation

    Transportation

    Industrial Feedstocks

    Japan Outlook (USD Billion, 2018-2032)

    Japan Green Ammonia by Gasifier Technology

    Älkaline Water Electrolysis

    Proton Exchange Membrane Electrolysis

    Solid Oxide Electrolysis

    Japan Green Ammonia by Gasifier Application

    Power Generation

    Transportation

    Industrial Feedstocks

    India Outlook (USD Billion, 2018-2032)

    India Green Ammonia by Gasifier Technology

    Älkaline Water Electrolysis

    Proton Exchange Membrane Electrolysis

    Solid Oxide Electrolysis

    India Green Ammonia by Gasifier Application

    Power Generation

    Transportation

    Industrial Feedstocks

    Australia Outlook (USD Billion, 2018-2032)

    Australia Green Ammonia by Gasifier Technology

    Älkaline Water Electrolysis

    Proton Exchange Membrane Electrolysis

    Solid Oxide Electrolysis

    Australia Green Ammonia by Gasifier Application

    Power Generation

    Transportation

    Industrial Feedstocks

    Rest of Asia-Pacific Outlook (USD Billion, 2018-2032)

    Rest of Asia-Pacific Green Ammonia by Gasifier Technology

    Älkaline Water Electrolysis

    Proton Exchange Membrane Electrolysis

    Solid Oxide Electrolysis

    Rest of Asia-Pacific Green Ammonia by Gasifier Application

    Power Generation

    Transportation

    Industrial Feedstocks

    Rest of the World Outlook (USD Billion, 2018-2032)

    Rest of the World Green Ammonia by Gasifier Technology

    Älkaline Water Electrolysis

    Proton Exchange Membrane Electrolysis

    Solid Oxide Electrolysis

    Rest of the World Green Ammonia by Gasifier Application

    Power Generation

    Transportation

    Industrial Feedstocks

    Middle East Outlook (USD Billion, 2018-2032)

    Middle East Green Ammonia by Gasifier Technology

    Älkaline Water Electrolysis

    Proton Exchange Membrane Electrolysis

    Solid Oxide Electrolysis

    Middle East Green Ammonia by Gasifier Application

    Power Generation

    Transportation

    Industrial Feedstocks

    Africa Outlook (USD Billion, 2018-2032)

    Africa Green Ammonia by Gasifier Technology

    Älkaline Water Electrolysis

    Proton Exchange Membrane Electrolysis

    Solid Oxide Electrolysis

    Africa Green Ammonia by Gasifier Application

    Power Generation

    Transportation

    Industrial Feedstocks

    Latin America Outlook (USD Billion, 2018-2032)

    Latin America Green Ammonia by Gasifier Technology

    Älkaline Water Electrolysis

    Proton Exchange Membrane Electrolysis

    Solid Oxide Electrolysis

    Latin America Green Ammonia by Gasifier Application

    Power Generation

    Transportation

    Industrial Feedstocks

    Infographic

    Free Sample Request

    Kindly complete the form below to receive a free sample of this Report

    Get Free Sample

    Customer Strories

    “I am very pleased with how market segments have been defined in a relevant way for my purposes (such as "Portable Freezers & refrigerators" and "last-mile"). In general the report is well structured. Thanks very much for your efforts.”

    Victoria Milne

    Founder
    Case Study
    Chemicals and Materials

    Compare Licence

    ×
    Features License Type
    Single User Multiuser License Enterprise User
    Price $4,950 $5,950 $7,250
    Maximum User Access Limit 1 User Upto 10 Users Unrestricted Access Throughout the Organization
    Free Customization
    Direct Access to Analyst
    Deliverable Format
    Platform Access
    Discount on Next Purchase 10% 15% 15%
    Printable Versions