info@marketresearchfuture.com   📞  +1 (855) 661-4441(US)   📞  +44 1720 412 167(UK)
Certified Global Research Member
Isomar fd.webp Wcrc 57.webp
Key Questions Answered
  • Global Market Outlook
  • In-depth analysis of global and regional trends
  • Analyze and identify the major players in the market, their market share, key developments, etc.
  • To understand the capability of the major players based on products offered, financials, and strategies.
  • Identify disrupting products, companies, and trends.
  • To identify opportunities in the market.
  • Analyze the key challenges in the market.
  • Analyze the regional penetration of players, products, and services in the market.
  • Comparison of major players financial performance.
  • Evaluate strategies adopted by major players.
  • Recommendations
Why Choose Market Research Future?
  • Vigorous research methodologies for specific market.
  • Knowledge partners across the globe
  • Large network of partner consultants.
  • Ever-increasing/ Escalating data base with quarterly monitoring of various markets
  • Trusted by fortune 500 companies/startups/ universities/organizations
  • Large database of 5000+ markets reports.
  • Effective and prompt pre- and post-sales support.

Graph Database Market Research Report: Information By Offering (Solution (Solution Type, and Deployment mode), and Services (Professional Services, and Managed Services)), By Analysis Type (Community Analysis, Connectivity Analysis, Centrality Analysis, and Path Analysis), By Model Type (RDF, Labeled Propert Graph, and Hypergraphs), By Vertical (BFSI, Retail and eCommerce, Telecom and IT, Healthcare, Pharmaceuticals, and Life Sciences, Government and Public Sector), And By Regions - Forecast Till 2032.


ID: MRFR/ICT/19847-HCR | 128 Pages | Author: Kinjoll Dey| December 2024

Graph Database Market Overview


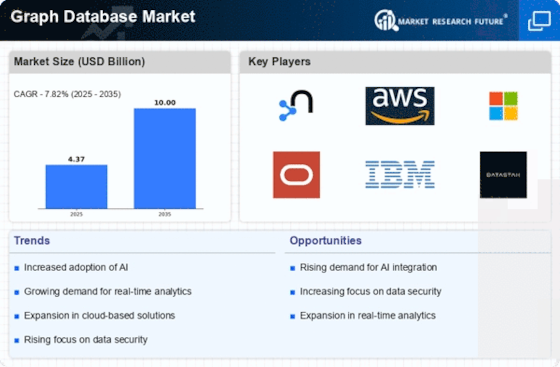
Graph Database Market Size was valued at USD 2.7 Billion in 2022. The Graph Database market industry is projected to grow from USD 3.2 Billion in 2023 to USD 12.2 Billion by 2032, exhibiting a compound annual growth rate (CAGR) of 18.20% during the forecast period (2023 - 2032). The need for low-latency query processing solutions is growing, as is the use of graph database technologies are the key market drivers boosting the expansion of the market.


Graph Database Market Overview


Source: Primary Research, Secondary Research, MRFR Database and Analyst Review


Graph Database Market Trends


Increasing need for solutions for low-latency query processing is driving the market growth


Market CAGR for Graph Database is being driven by the increasing need for solutions for low-latency query processing. A graph database is a kind of database that stores and represents data using graph topologies containing nodes, edges, and characteristics for semantic queries. Every node between two nodes represents an entity, and every edge denotes a relationship or link. The technologies that convert relational online transaction processing (OLTP) databases into graph databases are known as graph databases.


Additionally, organizations have challenges when they have large amounts of interconnected data stored in a database that isn't intended for any specific use. Instead of using a laborious batch procedure on top of a shared relational database, firms can implement a real-time recommendation engine that can handle minimal latency queries. By allowing users to specifically query previous purchases made by clients during a visit to the internet to match session and historical data, it performs far better than traditional relational databases, using a graph database results in reduced latency. Additionally, regardless of the size of the database, millions of linked records can be seen with a dependable response time as the links and nodes "point" to one another. Queries are split up into instantaneous sub-queries in order to achieve minimal latency.


Graph database services and tools are used so widely around the world that many legacy database providers are attempting to integrate graph database schemas into their primary relational database infrastructures. The method may appear to save money in theory, but in practice it may deteriorate and slow down the performance of queries that are executed in conjunction with the database. In terms of digital business operations, traditional brick-and-mortar trades are being transformed into digital business powerhouses by use of a graph database. Thus, it is expected that the market will rise at a faster rate due to rising demand for solutions that can handle low-latency requests.


For instance, the data lineage platform MANTA announced a new partnership with Neo4j, a leading player in the graph technology space, in April 2021. Through this collaboration, the MANTA platform will directly incorporate Neo4j's graph database technology, enhancing its pipeline analytic capabilities. Thus, result in driving the Graph Database market revenue.


Graph Database Market Segment Insights


Graph Database Offering Insights


The Graph Database market segmentation, based on Offering includes Solution (Solution Type, and Deployment mode), and Services (Professional Services, and Managed Services). The Solution segment dominated the market. An advanced technique for effectively managing and analyzing intricate relationships inside data is a graph database system. Graph database systems have become popular because they can handle situations where relationships are just as important as the data.


Graph Database Analysis Type Insights


The Graph Database market segmentation, based on Analysis Type, includes Community Analysis, Connectivity Analysis, Centrality Analysis, and Path Analysis. The Connectivity Analysis category generated the most income (70.4%). Graph databases' core component is connectivity analysis. Graph databases are ideal for situations where relationships between data points are crucial since they are made to represent and store data as linked nodes and edges. A crucial step in deriving meaningful insights from these linkages is connectivity analysis.


Graph Database Model Type Insights


The Graph Database market segmentation, based on Model Type includes RDF, Labeled Propert Graph, and Hypergraphs. The Hypergraphs segment dominated the market. A hypergraph is a specific data model used in the market for graph databases that increases the functionality of conventional graph databases by enabling various kinds of links (hyperedges) to link any number of nodes. The interest in hypergraphs is driven by the need for more advanced recommendation algorithms that take multi-entity interactions into account.


Figure1: Graph Database Market, by Model Type,2022&2032(USD Billion)


Graph Database Market, by Model Type, 2022 - 2032


Source: Primary Research, Secondary Research, MRFR Database and Analyst Review


Graph Database Vertical Insights


The Graph Database market segmentation, based on Vertical, includes BFSI, Retail and eCommerce, Telecom and IT, Healthcare, Pharmaceuticals, and Life Sciences, Government and Public Sector, Manufacturing and Automotive, Media and Entertainment, Energy and Utilities, Travel and Hospitality, Transportation and Logistics, and Others. The Telecom and IT category generated the most income. Graph databases are becoming more and more popular among IT and telecom enterprises as a way to improve customer experiences, optimize infrastructure, and manage networks better.


Graph Database Regional Insights


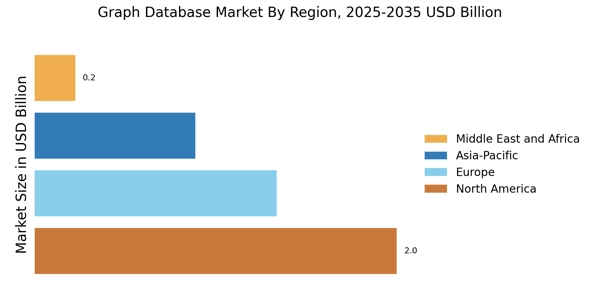
By region, the study provides the market insights into North America, Europe, Asia-Pacific and Rest of the World. The North American Graph Database market area will dominate this market, because of the availability of reputable fintech solutions and the technology's early development. Information technology developments will also accelerate the expansion of this industry in this region.


Further, the major countries studied in the market report are The US, German, France, the UK, Canada, Italy, Spain, India, Australia, South Korea, China, Japan, and Brazil.


Figure2: GRAPH DATABASE MARKET SHARE BY REGION 2022 (USD Billion)


GRAPH DATABASE MARKET SHARE BY REGION 2022


Source: Primary Research, Secondary Research, MRFR Database and Analyst Review


Europe Graph Database market has the second-largest portion of the market. The increased adoption of advanced database technology in European enterprises and organizations is facilitated by the expanding investment in IT infrastructure. Further, the German Graph Database market had the biggest market share, and the UK Graph Database market was the fastest growing market in the European region


The Asia-Pacific Graph Database Market is anticipated to expand between 2023 and 2032 at the quickest CAGR. This is due in large part to the region's enhanced prospects for smaller graph database vendors to introduce graph database solutions for numerous industries. Moreover, China’s Graph Database market had the biggest market share, and the Indian Graph Database market was the fastest growing market in the Asia-Pacific region.


Graph Database Key Market Players & Competitive Insights


Leading market players are putting a lot of money on R&D to expand their product lines, which will help the market for weight reduction products grow. Additionally, market players are engaging in a range of calculated initiatives to increase their worldwide presence, with important market developments involving the introduction of new products, contracts, M&A transactions, increased investment, and cooperation with other enterprises. to grow and endure in an increasingly cutthroat and dynamic market, Graph Database industry must provide reasonably priced goods.


Manufacturing locally is one of the primary business techniques used by manufacturers to cut operational costs in the Graph Database industry to help customers and expand the market segment. In recent years, the Graph Database industry has provided some of the biggest benefits to medicine. Major players in the Graph Database market, including Oracle Corporation (US), IBM Corporation (US), Amazon Web Services, Inc. (US), DataStax (US), Ontotext (Bulgaria), Stardog Union (US), and others, are attempting to increase market demand by investing in research and development operations.


Oracle Corporation is a multinational American computer technology corporation. By sales and market capitalization in 2020, Oracle ranked as the third-biggest software firm ly. The business offers cloud computing services as well as database software, especially the Oracle Database. An enterprise software product suite makes up Oracle's core application software. In December 2021, Oracle declared that it would buy the health information technology business Cerner.


An Amazon subsidiary called Amazon Web Services, Inc. (AWS) offers metered, pay-as-you-go cloud computing platforms and APIs to consumers, businesses, and governments. This is frequently used in conjunction with autoscaling, which enables clients to consume more processing power during periods of high application usage and scale back to lower expenses during periods of lower traffic. Through AWS server farms, these cloud computing web services offer a range of services pertaining to networking, compute, storage, middleware, IoT, and additional processing capability, in addition to software tools. In June 2022, AWS revealed that, as part of Axiom Mission 1, they had successfully launched the AWS Snowcone, a tiny computing device, to the International Space Station.


Key Companies in the Graph Database market include


  • Oracle Corporation (US)


  • IBM Corporation (US)


  • Amazon Web Services, Inc. (US)


  • DataStax (US)


  • Ontotext (Bulgaria)


  • Stardog Union (US)


  • Hewlett Packard Enterprise (US)


  • ArangoDB (US)


  • Blazegraph (US)


  • Microsoft Corporation (US)


  • SAP SE (Germany)


  • Teradata Corporation (US)


  • Openlink Software (US)


  • TIBCO Software, Inc. (US)


  • Neo4j, Inc. (US)


  • GraphBase (Australia)


  • Cambridge Semantics (US)


  • TigerGraph, Inc. (US)


  • Objectivity Inc. (US)


  • Bitnine Co, Ltd (US)


  • Franz Inc. (US)


  • Redis Labs (US)


  • Graph Story (US


  • Dgraph Labs (US)


  • Eccenca (Germany),


  • Fluree (US).


Graph Database Industry Developments


June 2021: Neo4j has released its most recent graph database version, 4.3. Graph data analysis, relationship asset indexes, new smart 10 scheduling, and parallelized backup are some of the features included in the most recent version of the graph database.


April 2021: The MarkLogic Data Hub Central low-code/no-code user interface was introduced by MarkLogic Corp. With the ease and agility of using the data infrastructure, MarkLogic's launch provides organizations with a clear roadmap for cloud modernization.


October 2020: Microsoft Corporation unveiled a brand-new artificial intelligence platform that can caption and describe photos. Azure Cognitive Services offers the system.


Graph Database Market Segmentation


Graph Database Offering Outlook


  • Solution


    • Solution Type


    • Deployment mode


  • Services


    • Professional Services


    • Managed Services


Graph Database Analysis Type Outlook


  • Community Analysis


  • Connectivity Analysis


  • Centrality Analysis


  • Path Analysis


Graph Database Model Type Outlook


  • RDF


  • Labeled Propert Graph


  • Hypergraphs


Graph Database Vertical Outlook


  • BFSI


  • Retail and eCommerce


  • Telecom and IT


  • Healthcare, Pharmaceuticals, and Life Sciences


  • Government and Public Sector


  • Manufacturing and Automotive


  • Media and Entertainment


  • Energy and Utilities


  • Travel and Hospitality


  • Transportation and Logistics


  • Others


Graph Database Regional Outlook


  • North America


  • US


  • Canada


  • Europe


  • Germany


  • France


  • UK


  • Italy


  • Spain


  • Rest of Europe


  • Asia-Pacific


    • China


    • Japan


    • India


    • Australia


    • South Korea


    • Australia


    • Rest of Asia-Pacific


  • Rest of the World


    • Middle East


    • Africa


    • Latin America


Report Attribute/Metric Details
Market Size2022 USD 2.7 Billion
Market Size 2023 USD 3.2 Billion
Market Size 2032 USD 12.2 Billion
Compound Annual Growth Rate (CAGR) 18.20% (2023-2032)
Base Year 2022
Market Forecast Period 2023-2032
Historical Data 2018- 2022
Market Forecast Units Value (USD Billion)
Report Coverage Revenue Forecast, Market Competitive Landscape, Growth Factors, and Trends
Segments Covered Offering, Analysis Type, Model Type, Vertical, and Region
Geographies Covered North America, Europe, AsiaPacific, and the Rest of the World
Countries Covered The US, German, France, UK, Canada, Italy, Spain, India, Australia, South Korea, China, Japan, and Brazil
Key Companies Profiled  Oracle Corporation (US), IBM Corporation (US), Amazon Web Services, Inc. (US), DataStax (US), Ontotext (Bulgaria), Stardog Union (US),
Key Market Opportunities Increasing need for solutions for low-latency query processing
Key Market Dynamics Expanding market use of graph database technology


Frequently Asked Questions (FAQ) :

In 2022, the size of the worldwide graph database market was estimated to be USD 2.7 billion.

From 2023 to 2032, the market is expected to expand at a compound annual growth rate (CAGR) of 18.20%.

North America held the most market share worldwide.

Oracle Corporation (US), IBM Corporation (US), Amazon Web Services, Inc. (US), DataStax (US), Ontotext (Bulgaria), and Stardog Union (US) are the leading companies in the market.

The market in 2022 was dominated by the Connectivity Analysis category.

The Hypergraphs held the biggest market share worldwide.

Leading companies partner with us for data-driven Insights.

client_1 client_2 client_3 client_4 client_5 client_6 client_7 client_8 client_9 client_10

Kindly complete the form below to receive a free sample of this Report

Please fill in Business Email for Quick Response

We do not share your information with anyone. However, we may send you emails based on your report interest from time to time. You may contact us at any time to opt-out.

Purchase Option
Single User $ 4,950
Multiuser License $ 5,950
Enterprise User $ 7,250
Compare Licenses
Tailored for You
  • Dedicated Research on any specifics segment or region.
  • Focused Research on specific players in the market.
  • Custom Report based only on your requirements.
  • Flexibility to add or subtract any chapter in the study.
  • Historic data from 2014 and forecasts outlook till 2040.
  • Flexibility of providing data/insights in formats (PDF, PPT, Excel).
  • Provide cross segmentation in applicable scenario/markets.