• Cat-intel
  • MedIntelliX
  • Resources
  • About Us
  • Hero Background
    English
    Chinese
    French
    Japanese
    Korean
    German
    Spanish

    Flavored Syrups Market Trends

    ID: MRFR/F-B & N/7141-CR
    100 Pages
    Snehal Singh
    September 2022

    Flavored Syrups Market Research Report: Information By Flavor Type (Fruits, Coffee, Chocolate, Vanilla, Mint, Nuts, Caramel and Blends), By Category (Conventional and Organic), By Distribution Channel (Food Service and Food Retail), and By Region (North America, Europe, Asia-Pacific, And Rest Of The World) –Market Forecast Till 2035

    Share:
    Download PDF ×

    We do not share your information with anyone. However, we may send you emails based on your report interest from time to time. You may contact us at any time to opt-out.

    Flavored Syrups Market Infographic
    $ 4,950.0
    $ 5,950.0
    $ 7,250.0

    Market Trends

    Key Emerging Trends in the Flavored Syrups Market

    Vanilla is extensively utilized in the food industry due to its robust essence and its capacity to enhance the overall sensory properties of food products. Beyond its culinary applications, vanilla finds widespread use in various industries owing to its nutritional value. The organic variant of vanilla, cultivated in a chemical-free environment without the use of chemical-laden fertilizers or pesticides, preserves the essential components of vanilla in the final product. The popularity of organic vanilla is on the rise, driven by its pure and natural form. The dairy industry, particularly involved in the production of natural ice creams, is witnessing a significant demand for organic vanilla. The global market for organic vanilla is supported by the increasing consumer preference for natural desserts, including ice cream, and organic bakery products. The sustained popularity of organic vanilla is attributed to its high demand from industries that prioritize natural and pure ingredients. One noteworthy aspect of organic vanilla is its antioxidant content, which has captured the attention of researchers exploring the potential health benefits of vanilla beans. The anti-carcinogenic properties exhibited by organic vanilla make it a candidate for medicinal applications. The demand for organic vanilla is not limited to the food industry; it has also found extensive use in personal care products. Organic vanilla extract, with its healing and soothing properties, is incorporated into various skincare and cosmetic items. In summary, the increasing demand for organic vanilla is driven by its vital components and the growing awareness among consumers regarding the benefits of natural and chemical-free products. The dairy industry, in particular, is contributing to the surge in demand for organic vanilla, as it becomes a key ingredient in the production of natural and organic desserts. Additionally, the antioxidant and anti-carcinogenic properties of organic vanilla are attracting interest from researchers and expanding its applications into the medicinal and personal care sectors. The market share of organic vanilla is expected to witness a steady increase over the coming period, reflecting the broader trend of consumers seeking pure and natural alternatives in various products. Nevertheless, the proliferation of chemically produced artificial flavors has encountered a hurdle in the form of mounting awareness regarding their detrimental effects. Consumers have become increasingly conscious of the adverse impacts associated with synthetic vanilla, leading to a restrained growth trajectory for these artificial flavors. Notably, concerns have been raised about synthetic vanilla triggering allergies and causing potential long-term side effects, contributing to a shift in consumer preferences. The evolving landscape of consumer preferences has played a pivotal role in shaping the demand for vanilla. The heightened consciousness about health and a preference for natural and non-genetically modified (GMO) food ingredients have become prominent factors influencing the market dynamics. Consumers, driven by health considerations, are now inclined towards organic vanilla as a safer and more natural alternative. The adverse health effects associated with synthetic vanilla have sparked a reevaluation of choices among consumers. Allergies triggered by synthetic flavors and the potential for long-term repercussions have underscored the importance of opting for more natural and organic alternatives. As a result, the demand for organic vanilla has witnessed a surge, driven by a discerning consumer base that prioritizes health and well-being.

    Market Summary

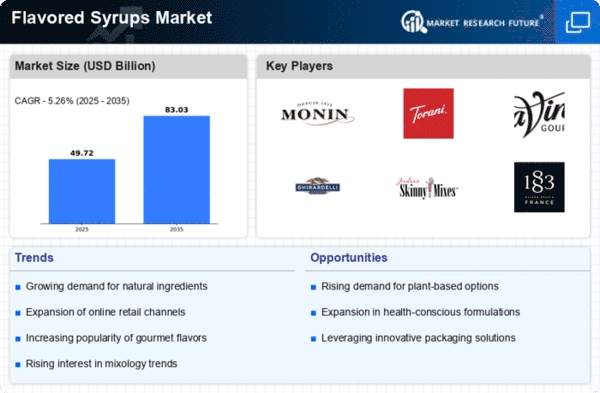
    As per Market Research Future Analysis, the Global Flavored Syrups Market was valued at USD 47.24 Billion in 2024 and is projected to reach USD 83.03 Billion by 2035, growing at a CAGR of 5.26% from 2025 to 2035. The market is primarily driven by the increasing demand for customized flavors in the food and beverage sector, particularly in the food service industry, which includes restaurants, cafés, and bars. The rising popularity of eating out and the demand for innovative flavors are further propelling market growth. The fruit-flavored syrups segment dominates the market, while the organic category is gaining traction due to consumer preference for natural ingredients.

    Key Market Trends & Highlights

    Key trends influencing the flavored syrups market include the following:

    • Flavored syrups Market Size in 2024: USD 47.24 Billion.
    • Projected Market Size by 2035: USD 83.03 Billion.
    • CAGR from 2025 to 2035: 5.26%.
    • Food service sector is the largest end user, driving significant sales.

    Market Size & Forecast

    2024 Market Size USD 47.24 Billion
    2035 Market Size USD 83.03 Billion
    CAGR (2025-2035) 5.26%
    Largest Regional Market Share in 2024 North America.

    Major Players

    Key players in the flavored syrups market include The J.M. Smucker Company, Wholesome Sweeteners Inc., Conagra Brands, Inc., VKL Seasoning Pvt. Ltd., Nestlé S.A., The Hershey Company, Kerry Group plc, Torre & Co. (Torani), Amoretti, and Monin, Inc.

    Market Trends

    Rising food service sector is driving the market growth

    One of the biggest end users of flavored syrups is the food service sector. A substantial portion of flavored syrup sales are made at restaurants, cafés, bars, bakeries, and hotels where they are used as toppings for sweets, baked goods, pancakes, and in coffee and other beverages. Most mocktails, cocktails, and other non-alcoholic drinks have them as an ingredient. Sales of flavored syrups are increasing as people drink more cocktails and cocktails at social gatherings, business conferences, and concerts. Developing nations like China, India, and other HoReCa hotspots are seeing significant growth.

    Eating out is becoming increasingly common; nowadays, most people choose to do so at least four or five times every week. The primary forces propelling the expansion of the HoReCa business are the rising adoption of new cultures, awareness of international trends, desire to try new foods, and evolving lifestyles. Flavored syrup demand is primarily fueled by the rising popularity of eating out and the strong demand for beverages and sweets.

    The major uses for flavoring syrup in the food and beverage sector include soft drink concentrates, frozen dessert toppings for yogurt, flavoring powders, and multi-flavor beverage syrups for food and soft drinks. The market for flavored syrups is dominated by fruit-flavored syrups, which are used extensively in beverages like soda, soft drinks, and cocktails. However, consumers' preferences for various flavored syrups, foods, and beverages, which are among the market's drivers, are about to accelerate the growth of the world's flavored syrup market.

    The market's players must concentrate their R&D efforts due to the growing consumer demand for novel flavors. Consumer preferences are always changing due to shifting lifestyles, eating patterns, and a desire for diversity. Flavored syrup producers are concentrating on introducing new flavors in order to maintain their place in the worldwide market while catering to consumers' shifting preferences. Market participants have added variants to their product portfolios in response to the rising demand for novel, fruit-based flavors. For instance, local producers of flavored syrups provide distinctive variants like acerola-raspberry and blueberry-raspberry syrups created by combining fundamental flavors.

    Due to consumers' increasing eagerness to explore novel items, market participants can also concentrate on launching unusual and exotic flavors. The dual-fruit flavored syrups that certain regional players have introduced are lime-mint, baked apples with honey, raspberry-lemon balm with honey, lime-ginger, and raspberry-mint. Thus, driving the flavored syrups market revenue.

    The growing consumer preference for natural and organic ingredients in food and beverages is likely to drive innovation and expansion in the flavored syrups market, reflecting a broader trend towards healthier lifestyle choices.

    U.S. Department of Agriculture

    Flavored Syrups Market Market Drivers

    Market Growth Projections

    The Global Flavored Syrups Market Industry is poised for substantial growth, with projections indicating a compound annual growth rate (CAGR) of 5.26% from 2025 to 2035. This growth trajectory reflects the increasing consumer interest in flavored beverages and the ongoing innovation within the industry. As the market evolves, it is anticipated that new entrants will emerge, further intensifying competition. The projected market size of 83.1 USD Billion by 2035 underscores the potential for expansion and the importance of strategic positioning for existing players. This growth is likely to be driven by a combination of factors, including changing consumer preferences and the expansion of distribution channels.

    Expansion of Food Service Sector

    The expansion of the food service sector plays a pivotal role in driving the Global Flavored Syrups Market Industry. As restaurants, cafes, and bars continue to proliferate globally, the demand for flavored syrups to enhance menu offerings is increasing. The versatility of flavored syrups allows food service establishments to create signature drinks and desserts, thereby attracting a diverse clientele. This trend is expected to contribute to the market's growth, with projections indicating a rise to 83.1 USD Billion by 2035. The food service industry's evolution, characterized by innovative beverage pairings and unique flavor profiles, underscores the importance of flavored syrups in enhancing customer experiences.

    Health-Conscious Consumer Trends

    Health-conscious trends significantly influence the Global Flavored Syrups Market Industry, as consumers increasingly prioritize natural and organic ingredients. The demand for syrups with reduced sugar content and natural flavorings is on the rise, reflecting a broader shift towards healthier lifestyles. This trend is particularly evident in the beverage sector, where consumers are opting for syrups that align with their dietary preferences. Manufacturers are adapting by developing syrups that are free from artificial additives and preservatives. This shift not only caters to health-conscious consumers but also positions brands favorably in a competitive market, potentially enhancing their market share as the industry evolves.

    Innovations in Product Development

    Innovations in product development are crucial drivers of the Global Flavored Syrups Market Industry. Manufacturers are increasingly investing in research and development to create new flavors and formulations that cater to evolving consumer preferences. This includes the introduction of unique flavor combinations and the incorporation of functional ingredients, such as vitamins and minerals, into syrups. Such innovations not only attract health-conscious consumers but also enhance the overall appeal of flavored syrups in various applications, from beverages to desserts. As the market continues to evolve, these innovations are likely to play a significant role in maintaining competitive advantage and driving sustained growth.

    Growing E-commerce and Online Sales

    The rise of e-commerce and online sales channels significantly impacts the Global Flavored Syrups Market Industry. With the increasing prevalence of online shopping, consumers are more inclined to purchase flavored syrups through digital platforms. This shift is facilitated by the convenience of home delivery and the ability to access a wider variety of products than what is available in physical stores. E-commerce platforms also allow brands to engage directly with consumers, fostering brand loyalty and enhancing customer relationships. As online sales continue to grow, this trend is expected to contribute to the overall expansion of the flavored syrups market, creating new opportunities for manufacturers.

    Rising Demand for Specialty Beverages

    The Global Flavored Syrups Market Industry experiences a notable surge in demand for specialty beverages, particularly among millennials and Gen Z consumers. This demographic increasingly seeks unique and innovative flavors to enhance their drink experiences. The market is projected to reach 47.2 USD Billion in 2024, driven by the growing popularity of craft cocktails and artisanal coffee drinks. As consumers become more adventurous in their flavor choices, manufacturers are responding with a diverse range of flavored syrups, catering to both alcoholic and non-alcoholic beverages. This trend indicates a shift towards premiumization in the beverage sector, further propelling market growth.

    Market Segment Insights

    Flavored Syrups Flavor Type Insights

    The flavored syrups market segmentation, based on flavor type includes fruits, coffee, chocolate, vanilla, mint, nuts, caramel and blends. The fruits segment dominated the market. One of the main factors fueling the market expansion is the rising demand for flavored syrups with fruit infusions and distinctive flavors. In order to maintain their position in the international market, producers have also been concentrating on creating mixed fruit syrups and introducing novel flavors.

    Flavored Syrups Category Insights

    The flavored syrups market segmentation, based on category includes conventional and organic. The organic segment dominated the market. Products without any artificial additives or chemicals are referred to as organic. Organic flavoured syrups use all-natural components. Natural flavourings from plants, fruits, vegetables, and herbs are used to flavour syrups.

    Flavored Syrups Distribution Channel Insights

    The flavored syrups market segmentation, based on distribution channel, includes food service and food retail. The food service category generated the most income. The segment encompasses a number of different sectors, including beverages, frozen desserts, dairy products, and bakery & confectionery. Some common goods containing flavored syrups as a taste and sweetness enhancer ingredient are beverages, especially cocktails, hot and cold beverages, and soft drinks.

    Figure 1: Flavored Syrups Market, by Distribution Channel, 2022 & 2032 (USD Billion)

    Source: Secondary Research, Primary Research, Market Research Future Database and Analyst Review

    Get more detailed insights about Flavored Syrups Market Research Report—Global Forecast till 2034

    Regional Insights

    By region, the study provides the market insights into North America, Europe, Asia-Pacific and Rest of the World. The North American flavored syrups market will dominate this market due to the widespread use of fruit syrups in the United States and Canada and the growing preference of consumers for flavored syrups in everyday foods such as snacks, cereals, beverages, and desserts. Due to the abundance of high-quality toppings, chocolates, flavors, and fillings in this area, the bakery business is predicted to have tremendous expansion.

    Further, the major countries studied in the market report are The US, Canada, German, France, the UK, Italy, Spain, China, Japan, India, Australia, South Korea, and Brazil.

    Figure 2: FLAVORED SYRUPS MARKET SHARE BY REGION 2022 (USD Billion)

    FLAVORED SYRUPS MARKET SHARE BY REGION 2022 (USD Billion)

    Source: Secondary Research, Primary Research, Market Research Future Database and Analyst Review

    Europe flavored syrups market accounts for the second-largest market share. The growth of the European flavored syrups market is being driven by the rising use of flavored syrups in bakery goods. Additionally, these syrups are used to flavor coffee and tea with a range of flavors. The world's biggest per capita coffee consumption is in Europe, which contributes to the region's high sales of flavored syrups. Further, the German flavored syrups market held the largest market share, and the UK flavored syrups market was the fastest growing market in the European region

    The Asia-Pacific Flavored syrups Market is expected to grow at the fastest CAGR from 2023 to 2032. This is a result of the Asia Pacific region's rising economic standards, expansion of dining options, and widespread consumption of dairy and ice cream. Moreover, China’s flavored syrups market held the largest market share, and the Indian flavored syrups market was the fastest growing market in the Asia-Pacific region.

    Key Players and Competitive Insights

    Leading market players are investing heavily in research and development in order to expand their product lines, which will help the flavored syrups market, grow even more. Market participants are also undertaking a variety of strategic activities to expand their footprint, with important market developments including new product launches, contractual agreements, mergers and acquisitions, higher investments, and collaboration with other organizations. To expand and survive in a more competitive and rising market climate, flavored syrups industry must offer cost-effective items.

    Manufacturing locally to minimize operational costs is one of the key business tactics used by manufacturers in the flavored syrups industry to benefit clients and increase the market sector. In recent years, the flavored syrups industry has offered some of the most significant advantages to market. Major players in the flavored syrups market attempting to increase market demand by investing in research and development operations include The J.M. Smucker Company (US), Wholesome Sweeteners Inc. (US), Conagra Brands, Inc. (US), VKL Seasoning Pvt. Ltd. (India), Nestlé S.A. (Switzerland), The Hershey Company (US), Kerry Group plc (Ireland), R.

    Torre & Co. (Torani) (US), Amoretti (US), and Monin, Inc. (France).

    Conagra Brands, Inc. produces and sells packaged foods to institutions, restaurants, and retail customers. The business sells dinners, meals, sides, snacks, milled grain ingredients, dried veggies and seasonings, mixes and flavors, as well as speciality potatoes. Conagra Brands serve customers in the US. In October 2021, the US-based packaged goods company Pinnacle goods, Inc., with its headquarters in Parsippany, New Jersey, was successfully acquired by Conagra Brands, Inc. Conagra Brands, Inc. was able to broaden its selection of frozen and shelf-stable goods because to this acquisition.

    The French company Monin manufactures and markets syrups, liqueurs, and fruit purees largely for commercial use (in hotels, restaurants, bars, etc.). Monin, Inc make product flavorings. The business sells syrups, raspberry fruit puree, dark chocolate sauce, sweeteners, gourmet sauces, drink concentrates, bottled display racks, bottle pumps and pourers, and samplers. In the USA, Monin conducts business. Various fruit flavors, including raspberry, pomegranate, and peach, are available in sugar-free syrups from Monin. The other sugar-free syrups this company provides are hazelnut, almond, and irish cream.

    Key Companies in the Flavored Syrups Market market include

    Industry Developments

    November 2022: With the flavours Strawberry, Pineapple and Mango, MONIN unveiled Le Crush de MONIN, a collection of fresh products. Due to MONIN, flavor options are now more varied for pastry chefs, bartenders, baristas, ice cream producers, and home mixologists.

    June 2022: First Day Lawson Ltd. bought Quest Ingredients Ltd., a taste and botanical extracts manufacturer. The main objectives of FDL's acquisition strategy are increased primary markets and customer bases in Europe and the US.

    December 2020: Sweet Green Fields, a supplier of stevia, was fully acquired by Tate & Lyle. Tate & Lyle would enhance its stevia solution and capabilities through this acquisition by fusing its supply chain and research and development operations to boost stevia product innovation.

    Future Outlook

    Flavored Syrups Market Future Outlook

    The Global Flavored Syrups Market is projected to grow at a 5.26% CAGR from 2025 to 2035, driven by rising consumer demand for innovative beverage options and health-conscious formulations.

    New opportunities lie in:

    • Develop organic and natural flavored syrups to cater to health-conscious consumers.
    • Leverage e-commerce platforms for direct-to-consumer sales and broader market reach.
    • Create unique flavor combinations targeting niche markets like craft beverages and gourmet cooking.

    By 2035, the Flavored Syrups Market is expected to exhibit robust growth, reflecting evolving consumer preferences and innovative product offerings.

    Market Segmentation

    Flavored Syrups Category Outlook (USD Billion, 2018-2032)

    • Conventional Organic
    • Conventional
    • Organic

    Flavored Syrups Regional Outlook (USD Billion, 2018-2032)

    • North America US Canada
    • US Canada
    • US
    • Canada
    • Europe Germany France UK Italy Spain Rest of Europe
    • Germany France UK Italy Spain Rest of Europe
    • Germany
    • France
    • UK
    • Italy
    • Spain
    • Rest of Europe
    • Asia-Pacific China Japan India Australia South Korea Australia Rest of Asia-Pacific Rest of the World Middle East Africa Latin America
    • China Japan India Australia South Korea Australia Rest of Asia-Pacific
    • China
    • Japan
    • India
    • Australia
    • South Korea
    • Rest of Asia-Pacific
    • Rest of the World Middle East Africa Latin America
    • Middle East
    • Africa
    • Latin America

    Flavored Syrups Flavor Type Outlook (USD Billion, 2018-2032)

    • Fruits Coffee Chocolate Vanilla Mint Nuts Caramel Blends
    • Fruits
    • Coffee
    • Chocolate
    • Vanilla
    • Mint
    • Nuts
    • Caramel
    • Blends

    Flavored Syrups Distribution Channel Outlook (USD Billion, 2018-2032)

    • Food Service Food Retail
    • Food Service
    • Food Retail

    Report Scope

    Report Attribute/Metric Details
    Market Size 2024 USD 47.24 Billion
    Market Size 2025 USD 49.72 Billion
    Market Size 2035 83.03 (Value (USD Billion))
    Compound Annual Growth Rate (CAGR) 5.26% (2025 - 2035)
    Base Year 2024
    Market Forecast Period 2025 - 2035
    Historical Data 2019- 2023
    Market Forecast Units Value (USD Billion)
    Report Coverage Revenue Forecast, Market Competitive Landscape, Growth Factors, and Trends
    Segments Covered Flavor Type, Category, Distribution Channel and Region
    Geographies Covered North America, Europe, Asia Pacific, and the Rest of the World
    Countries Covered The US, Canada, German, France, UK, Italy, Spain, China, Japan, India, Australia, South Korea, and Brazil
    Key Companies Profiled The J.M. Smucker Company (US), Wholesome Sweeteners Inc. (US), Conagra Brands, Inc. (US), VKL Seasoning Pvt. Ltd. (India), Nestlé S.A. (Switzerland), The Hershey Company (US), Kerry Group plc (Ireland), R. Torre & Co. (Torani) (US), Amoretti (US), and Monin, Inc. (France)
    Key Market Opportunities Demand for new flavors
    Key Market Dynamics Growth of the food service industry

    Market Highlights

    Author

    Snehal Singh
    Assistant Manager - Research

    She holds an experience of about 6+ years in market research and business consulting, working under the spectrum of information communication technology, telecommunications and semiconductor domains. aarti conceptualizes and implements a scalable business strategy and provides strategic leadership to the clients. her expertise lies in market estimation, competitive intelligence, pipeline analysis, customer assessment, etc.

    Leave a Comment

    Latest Comments

    John Doe
    john@example.com

    This is a great article! Really helped me understand the topic better.

    Posted on July 23, 2025, 10:15 AM
    Jane Smith
    jane@domain.com

    Thanks for sharing this. I’ve bookmarked it for later reference.

    Posted on July 22, 2025, 7:45 PM

    FAQs

    How much is the flavored syrups market?

    The flavored syrups market size was valued at USD 44.87 Billion in 2023.

    What is the growth rate of the flavored syrups market?

    The market is projected to grow at a CAGR of 5.3% during the forecast period, 2025-2034.

    Which region held the largest market share in the flavored syrups market?

    North America had the largest share in the market

    Who are the key players in the flavored syrups market?

    The key players in the market are The J.M. Smucker Company (US), Wholesome Sweeteners Inc. (US), Conagra Brands, Inc. (US), VKL Seasoning Pvt. Ltd. (India), Nestlé S.A. (Switzerland), The Hershey Company (US), Kerry Group plc (Ireland), R. Torre & Co. (Torani) (US), Amoretti (US), and Monin, Inc. (France).

    Which flavor type led the flavored syrups market?

    The fruits category dominated the market in 2023.

    Which distribution channel had the largest market share in the flavored syrups market?

    The food service category had the largest share in the market.

    1. Table of Contents
    2. Executive Summary 15
      1. MARKET ATTRACTIVENESS ANALYSIS 16
        1. GLOBAL FLAVORED SYRUPS MARKET, BY FLAVOR TYPE 17
        2. GLOBAL FLAVORED SYRUPS MARKET, BY CATEGORY 18
        3. GLOBAL FLAVORED SYRUPS MARKET, BY DISTRIBUTION CHANNEL 19
        4. GLOBAL FLAVORED SYRUPS MARKET, BY REGION 20
    3. Market Introduction 21
      1. DEFINITION 21
      2. Scope of the Study 21
      3. RESEARCH OBJECTIVE 21
      4. MARKET STRUCTURE 22
      5. KEY BUYING CRITERIA 23
    4. Research Methodology 24
      1. RESEARCH PROCESS 24
      2. PRIMARY RESEARCH 25
      3. SECONDARY RESEARCH 26
      4. MARKET SIZE ESTIMATION 26
      5. FORECAST MODEL 28
      6. LIST OF ASSUMPTIONS 29
    5. MARKET DYNAMICS 30
      1. INTRODUCTION 30
      2. DRIVERS 31
        1. GROWTH OF THE FOOD SERVICE INDUSTRY 31
        2. INCREASING CONSUMPTION OF CONVENIENCE FOODS 31
        3. GROWTH OF THE ORGANIZED RETAIL SECTOR IN ASIA-PACIFIC 32
        4. DRIVERS IMPACT ANALYSIS 33
      3. RESTRAINT 33
        1. RISING HEALTH CONCERNS 33
        2. RESTRAINTS IMPACT ANALYSIS 34
      4. OPPORTUNITIES 34
        1. RISING CONSUMER PREFERENCE FOR NATURAL AND ORGANIC PRODUCTS 34
        2. DEMAND FOR NEW FLAVORS 35
    6. MARKET FACTOR ANALYSIS 36
      1. VALUE CHAIN ANALYSIS 36
        1. RAW MATERIAL PROCUREMENT 37
        2. PROCESSING 38
        3. PACKAGING 38
      2. SUPPLY CHAIN ANALYSIS 38
      3. PORTER’S FIVE FORCES MODEL 39
        1. THREAT OF NEW ENTRANTS 40
        2. BARGAINING POWER OF SUPPLIERS 40
        3. BARGAINING POWER OF BUYERS 40
        4. THREAT OF SUBSTITUTES 40
        5. RIVALRY 40
    7. IMPACT OF THE COVID-19 OUTBREAK ON GLOBAL FLAVORED SYRUPS MARKET 41
    8. GLOBAL FLAVORED SYRUPS MARKET, BY FLAVOR TYPE 43
      1. OVERVIEW 43
        1. GLOBAL FLAVORED SYRUPS MARKET ESTIMATES & FORECAST, BY FLAVOR TYPE, 2025–2034 44
      2. FRUITS 45
        1. FRUITS: MARKET ESTIMATES & FORECAST, BY REGION, 2025–2034 45
      3. COFFEE 45
        1. COFFEE: MARKET ESTIMATES & FORECAST, BY REGION, 2025–2034 45
      4. CHOCOLATE 46
        1. CHOCOLATE: MARKET ESTIMATES & FORECAST, BY REGION, 2025–2034 46
      5. VANILLA 47
        1. VANILLA: MARKET ESTIMATES & FORECAST, BY REGION, 2025–2034 47
      6. MINT 47
        1. MINT: MARKET ESTIMATES & FORECAST, BY REGION, 2025–2034 47
      7. NUTS 48
        1. NUTS: MARKET ESTIMATES & FORECAST, BY REGION, 2025–2034 48
      8. CARAMEL 48
        1. CARAMEL: MARKET ESTIMATES & FORECAST, BY REGION, 2025–2034 48
      9. BLENDS 49
        1. BLENDS: MARKET ESTIMATES & FORECAST, BY REGION, 2025–2034 49
      10. OTHERS 50
        1. OTHERS: MARKET ESTIMATES & FORECAST, BY REGION, 2025–2034 50
    9. GLOBAL FLAVORED SYRUPS MARKET, BY CATEGORY 51
      1. OVERVIEW 51
        1. GLOBAL FLAVORED SYRUPS MARKET ESTIMATES & FORECAST, BY CATEGORY, 2025–2034 52
      2. CONVENTIONAL 52
        1. CONVENTIONAL: MARKET ESTIMATES & FORECAST, BY REGION, 2025–2034 52
      3. ORGANIC 53
        1. ORGANIC: MARKET ESTIMATES & FORECAST, BY REGION, 2025–2034 53
    10. GLOBAL FLAVORED SYRUPS MARKET, BY DISTRIBUTION CHANNEL 54
      1. OVERVIEW 54
        1. GLOBAL FLAVORED SYRUPS MARKET ESTIMATES & FORECAST, BY DISTRIBUTION CHANNEL, 2025–2034 55
      2. FOODSERVICE 56
        1. FOODSERVICE: MARKET ESTIMATES & FORECAST, BY REGION, 2025–2034 56
      3. FOOD RETAIL 56
        1. FOOD RETAIL: MARKET ESTIMATES & FORECAST, BY REGION, 2025–2034 57
    11. GLOBAL FLAVORED SYRUPS MARKET, BY REGION 58
      1. OVERVIEW 58
      2. NORTH AMERICA 60
        1. US 63
        2. CANADA 65
        3. MEXICO 67
      3. EUROPE 69
        1. GERMANY 72
        2. UK 74
        3. FRANCE 76
        4. SPAIN 78
        5. ITALY 80
        6. DENMARK 82
        7. REST OF EUROPE 84
      4. ASIA-PACIFIC 86
        1. CHINA 89
        2. JAPAN 91
        3. INDIA 93
        4. AUSTRALIA & NEW ZEALAND 95
        5. INDONESIA 97
        6. SOUTH KOREA 99
        7. REST OF ASIA-PACIFIC 101
      5. REST OF THE WORLD 103
        1. SOUTH AMERICA 106
        2. MIDDLE EAST 108
        3. AFRICA 110
    12. Competitive Landscape 112
      1. INTRODUCTION 112
        1. MARKET STRATEGY ANALYSIS 112
      2. COMPETITIVE BENCHMARKING 113
      3. COMPANY MARKET SHARE ANALYSIS, 2023 114
      4. KEY DEVELOPMENTS & GROWTH STRATEGIES 114
        1. PRODUCT LAUNCHES 114
        2. EXPANSIONS 115
        3. ACQUISITIONS 115
        4. COLLABORATIONS 115
    13. COMPANY PROFILES 116
      1. MONIN, INC. 116
        1. COMPANY OVERVIEW 116
        2. FINANCIAL OVERVIEW 116
        3. PRODUCTS OFFERED 116
        4. KEY DEVELOPMENTS 117
        5. SWOT ANALYSIS 118
        6. KEY STRATEGIES 118
      2. AMORETTI 119
        1. COMPANY OVERVIEW 119
        2. FINANCIAL OVERVIEW 119
        3. PRODUCTS OFFERED 119
        4. KEY DEVELOPMENTS 119
        5. SWOT ANALYSIS 120
        6. KEY STRATEGIES 120
      3. R. TORRE & CO. (TORANI) 121
        1. COMPANY OVERVIEW 121
        2. FINANCIAL OVERVIEW 121
        3. PRODUCTS OFFERED 121
        4. KEY DEVELOPMENTS 122
        5. SWOT ANALYSIS 123
        6. KEY STRATEGIES 123
      4. KERRY GROUP PLC 124
        1. COMPANY OVERVIEW 124
        2. FINANCIAL OVERVIEW 124
        3. PRODUCTS OFFERED 125
        4. KEY DEVELOPMENTS 126
        5. SWOT ANALYSIS 127
        6. KEY STRATEGIES 127
      5. THE HERSHEY COMPANY 128
        1. COMPANY OVERVIEW 128
        2. FINANCIAL OVERVIEW 128
        3. PRODUCTS OFFERED 129
        4. KEY DEVELOPMENTS 129
        5. SWOT ANALYSIS 130
        6. KEY STRATEGIES 130
      6. NESTLÉ S.A. 131
        1. COMPANY OVERVIEW 131
        2. FINANCIAL OVERVIEW 131
        3. PRODUCTS OFFERED 132
        4. KEY DEVELOPMENTS 132
        5. KEY STRATEGIES 132
      7. VKL SEASONING PVT. LTD 133
        1. COMPANY OVERVIEW 133
        2. FINANCIAL OVERVIEW 133
        3. PRODUCTS OFFERED 133
        4. KEY DEVELOPMENTS 133
        5. KEY STRATEGIES 133
      8. CONAGRA BRANDS, INC. 134
        1. COMPANY OVERVIEW 134
        2. FINANCIAL OVERVIEW 134
        3. PRODUCTS OFFERED 135
        4. KEY DEVELOPMENTS 135
        5. KEY STRATEGIES 135
      9. WHOLESOME SWEETENERS INC. 136
        1. COMPANY OVERVIEW 136
        2. FINANCIAL OVERVIEW 136
        3. PRODUCTS OFFERED 136
        4. KEY DEVELOPMENTS 136
        5. KEY STRATEGIES 136
      1. THE J.M. SMUCKER COMPANY 137
        1. COMPANY OVERVIEW 137
        2. FINANCIAL OVERVIEW 137
        3. PRODUCTS OFFERED 138
        4. KEY DEVELOPMENTS 138
        5. KEY STRATEGIES 138
    14. APPENDIX 139
      1. REFERENCES 139
    15. List of Tables and Figures
      1. LIST OF TABLES
      2. TABLE 1 PRIMARY INTERVIEWS 25
      3. TABLE 2 LIST OF ASSUMPTIONS 29
      4. TABLE 3 GLOBAL FLAVORED SYRUPS MARKET ESTIMATES & FORECAST, BY FLAVOR TYPE, 2025–2034 (USD MILLION) 44
      5. TABLE 4 FRUITS: MARKET ESTIMATES & FORECAST, BY REGION, 2025–2034 (USD MILLION) 45
      6. TABLE 5 COFFEE: MARKET ESTIMATES & FORECAST, BY REGION, 2025–2034 (USD MILLION) 45
      7. TABLE 6 CHOCOLATE: MARKET ESTIMATES & FORECAST, BY REGION, 2025–2034 (USD MILLION) 46
      8. TABLE 7 VANILLA: MARKET ESTIMATES & FORECAST, BY REGION, 2025–2034 (USD MILLION) 47
      9. TABLE 8 MINT: MARKET ESTIMATES & FORECAST, BY REGION, 2025–2034 (USD MILLION) 47
      10. TABLE 9 NUTS: MARKET ESTIMATES & FORECAST, BY REGION, 2025–2034 (USD MILLION) 48
      11. TABLE 10 CARAMEL: MARKET ESTIMATES & FORECAST, BY REGION, 2025–2034 (USD MILLION) 48
      12. TABLE 11 BLENDS: MARKET ESTIMATES & FORECAST, BY REGION, 2025–2034 (USD MILLION) 49
      13. TABLE 12 OTHERS: MARKET ESTIMATES & FORECAST, BY REGION, 2025–2034 (USD MILLION) 50
      14. TABLE 13 GLOBAL FLAVORED SYRUPS MARKET ESTIMATES & FORECAST, BY CATEGORY, 2025–2034 (USD MILLION) 52
      15. TABLE 14 CONVENTIONAL: MARKET ESTIMATES & FORECAST, BY REGION, 2025–2034 (USD MILLION) 52
      16. TABLE 15 ORGANIC: MARKET ESTIMATES & FORECAST, BY REGION, 2025–2034 (USD MILLION) 53
      17. TABLE 16 GLOBAL FLAVORED SYRUPS MARKET ESTIMATES & FORECAST, BY DISTRIBUTION CHANNEL, 2025–2034 (USD MILLION) 55
      18. TABLE 17 FOODSERVICE: MARKET ESTIMATES & FORECAST, BY REGION, 2025–2034 (USD MILLION) 56
      19. TABLE 18 FOOD RETAIL: MARKET ESTIMATES & FORECAST, BY REGION, 2025–2034 (USD MILLION) 57
      20. TABLE 19 GLOBAL FLAVORED SYRUPS MARKET ESTIMATES & FORECAST, BY REGION, 2025–2034 (USD MILLION) 59
      21. TABLE 20 NORTH AMERICA: MARKET ESTIMATES & FORECAST, BY COUNTRY, 2025–2034 (USD MILLION) 60
      22. TABLE 21 NORTH AMERICA: FLAVORED SYRUPS MARKET, BY FLAVOR TYPE, 2025–2034 (USD MILLION) 61
      23. TABLE 22 NORTH AMERICA: FLAVORED SYRUPS MARKET, BY CATEGORY, 2025–2034 (USD MILLION) 61
      24. TABLE 23 NORTH AMERICA: FLAVORED SYRUPS MARKET, BY DISTRIBUTION CHANNEL, 2025–2034 (USD MILLION) 62
      25. TABLE 24 US: FLAVORED SYRUPS MARKET, BY FLAVOR TYPE, 2025–2034 (USD MILLION) 63
      26. TABLE 25 US: FLAVORED SYRUPS MARKET, BY CATEGORY, 2025–2034 (USD MILLION) 63
      27. TABLE 26 US: FLAVORED SYRUPS MARKET, BY DISTRIBUTION CHANNEL, 2025–2034 (USD MILLION) 64
      28. TABLE 27 CANADA: FLAVORED SYRUPS MARKET, BY FLAVOR TYPE, 2025–2034 (USD MILLION) 65
      29. TABLE 28 CANADA: FLAVORED SYRUPS MARKET, BY CATEGORY, 2025–2034 (USD MILLION) 65
      30. TABLE 29 CANADA: FLAVORED SYRUPS MARKET, BY DISTRIBUTION CHANNEL, 2025–2034 (USD MILLION) 66
      31. TABLE 30 MEXICO: FLAVORED SYRUPS MARKET, BY FLAVOR TYPE, 2025–2034 (USD MILLION) 67
      32. TABLE 31 MEXICO: FLAVORED SYRUPS MARKET, BY CATEGORY, 2025–2034 (USD MILLION) 67
      33. TABLE 32 MEXICO: FLAVORED SYRUPS MARKET, BY DISTRIBUTION CHANNEL, 2025–2034 (USD MILLION) 68
      34. TABLE 33 EUROPE: MARKET ESTIMATES & FORECAST, BY COUNTRY, 2025–2034 (USD MILLION) 69
      35. TABLE 34 EUROPE: FLAVORED SYRUPS MARKET, BY FLAVOR TYPE, 2025–2034 (USD MILLION) 70
      36. TABLE 35 EUROPE: FLAVORED SYRUPS MARKET, BY CATEGORY, 2025–2034 (USD MILLION) 70
      37. TABLE 36 EUROPE: FLAVORED SYRUPS MARKET, BY DISTRIBUTION CHANNEL, 2025–2034 (USD MILLION) 71
      38. TABLE 37 GERMANY: FLAVORED SYRUPS MARKET, BY FLAVOR TYPE, 2025–2034 (USD MILLION) 72
      39. TABLE 38 GERMANY: FLAVORED SYRUPS MARKET, BY CATEGORY, 2025–2034 (USD MILLION) 72
      40. TABLE 39 GERMANY: FLAVORED SYRUPS MARKET, BY DISTRIBUTION CHANNEL, 2025–2034 (USD MILLION) 73
      41. TABLE 40 UK: FLAVORED SYRUPS MARKET, BY FLAVOR TYPE, 2025–2034 (USD MILLION) 74
      42. TABLE 41 UK: FLAVORED SYRUPS MARKET, BY CATEGORY, 2025–2034 (USD MILLION) 74
      43. TABLE 42 UK: FLAVORED SYRUPS MARKET, BY DISTRIBUTION CHANNEL, 2025–2034 (USD MILLION) 75
      44. TABLE 43 FRANCE: FLAVORED SYRUPS MARKET, BY FLAVOR TYPE, 2025–2034 (USD MILLION) 76
      45. TABLE 44 FRANCE: FLAVORED SYRUPS MARKET, BY CATEGORY, 2025–2034 (USD MILLION) 76
      46. TABLE 45 FRANCE: FLAVORED SYRUPS MARKET, BY DISTRIBUTION CHANNEL, 2025–2034 (USD MILLION) 77
      47. TABLE 46 SPAIN: FLAVORED SYRUPS MARKET, BY FLAVOR TYPE, 2025–2034 (USD MILLION) 78
      48. TABLE 47 SPAIN: FLAVORED SYRUPS MARKET, BY CATEGORY, 2025–2034 (USD MILLION) 78
      49. TABLE 48 SPAIN: FLAVORED SYRUPS MARKET, BY DISTRIBUTION CHANNEL, 2025–2034 (USD MILLION) 79
      50. TABLE 49 ITALY: FLAVORED SYRUPS MARKET, BY FLAVOR TYPE, 2025–2034 (USD MILLION) 80
      51. TABLE 50 ITALY: FLAVORED SYRUPS MARKET, BY CATEGORY, 2025–2034 (USD MILLION) 80
      52. TABLE 51 ITALY: FLAVORED SYRUPS MARKET, BY DISTRIBUTION CHANNEL, 2025–2034 (USD MILLION) 81
      53. TABLE 52 DENMARK: FLAVORED SYRUPS MARKET, BY FLAVOR TYPE, 2025–2034 (USD MILLION) 82
      54. TABLE 53 DENMARK: FLAVORED SYRUPS MARKET, BY CATEGORY, 2025–2034 (USD MILLION) 82
      55. TABLE 54 DENMARK: FLAVORED SYRUPS MARKET, BY DISTRIBUTION CHANNEL, 2025–2034 (USD MILLION) 83
      56. TABLE 55 REST OF EUROPE: FLAVORED SYRUPS MARKET, BY FLAVOR TYPE, 2025–2034 (USD MILLION) 84
      57. TABLE 56 REST OF EUROPE: FLAVORED SYRUPS MARKET, BY CATEGORY, 2025–2034 (USD MILLION) 84
      58. TABLE 57 REST OF EUROPE: FLAVORED SYRUPS MARKET, BY DISTRIBUTION CHANNEL, 2025–2034 (USD MILLION) 85
      59. TABLE 58 ASIA-PACIFIC: MARKET ESTIMATES & FORECAST, BY COUNTRY, 2025–2034 (USD MILLION) 86
      60. TABLE 59 ASIA-PACIFIC: FLAVORED SYRUPS MARKET, BY FLAVOR TYPE, 2025–2034 (USD MILLION) 87
      61. TABLE 60 ASIA-PACIFIC: FLAVORED SYRUPS MARKET, BY CATEGORY, 2025–2034 (USD MILLION) 87
      62. TABLE 61 ASIA-PACIFIC: FLAVORED SYRUPS MARKET, BY DISTRIBUTION CHANNEL, 2025–2034 (USD MILLION) 88
      63. TABLE 62 CHINA: FLAVORED SYRUPS MARKET, BY FLAVOR TYPE, 2025–2034 (USD MILLION) 89
      64. TABLE 63 CHINA: FLAVORED SYRUPS MARKET, BY CATEGORY, 2025–2034 (USD MILLION) 89
      65. TABLE 64 CHINA: FLAVORED SYRUPS MARKET, BY DISTRIBUTION CHANNEL, 2025–2034 (USD MILLION) 90
      66. TABLE 65 JAPAN: FLAVORED SYRUPS MARKET, BY FLAVOR TYPE, 2025–2034 (USD MILLION) 91
      67. TABLE 66 JAPAN: FLAVORED SYRUPS MARKET, BY CATEGORY, 2025–2034 (USD MILLION) 91
      68. TABLE 67 JAPAN: FLAVORED SYRUPS MARKET, BY DISTRIBUTION CHANNEL, 2025–2034 (USD MILLION) 92
      69. TABLE 68 INDIA: FLAVORED SYRUPS MARKET, BY FLAVOR TYPE, 2025–2034 (USD MILLION) 93
      70. TABLE 69 INDIA: FLAVORED SYRUPS MARKET, BY CATEGORY, 2025–2034 (USD MILLION) 93
      71. TABLE 70 INDIA: FLAVORED SYRUPS MARKET, BY DISTRIBUTION CHANNEL, 2025–2034 (USD MILLION) 94
      72. TABLE 71 AUSTRALIA & NEW ZEALAND: FLAVORED SYRUPS MARKET, BY FLAVOR TYPE, 2025–2034 (USD MILLION) 95
      73. TABLE 72 AUSTRALIA & NEW ZEALAND: FLAVORED SYRUPS MARKET, BY CATEGORY, 2025–2034 (USD MILLION) 95
      74. TABLE 73 AUSTRALIA & NEW ZEALAND: FLAVORED SYRUPS MARKET, BY DISTRIBUTION CHANNEL, 2025–2034 (USD MILLION) 96
      75. TABLE 74 INDONESIA: FLAVORED SYRUPS MARKET, BY FLAVOR TYPE, 2025–2034 (USD MILLION) 97
      76. TABLE 75 INDONESIA: FLAVORED SYRUPS MARKET, BY CATEGORY, 2025–2034 (USD MILLION) 97
      77. TABLE 76 INDONESIA: FLAVORED SYRUPS MARKET, BY DISTRIBUTION CHANNEL, 2025–2034 (USD MILLION) 98
      78. TABLE 77 SOUTH KOREA: FLAVORED SYRUPS MARKET, BY FLAVOR TYPE, 2025–2034 (USD MILLION) 99
      79. TABLE 78 SOUTH KOREA: FLAVORED SYRUPS MARKET, BY CATEGORY, 2025–2034 (USD MILLION) 99
      80. TABLE 79 SOUTH KOREA: FLAVORED SYRUPS MARKET, BY DISTRIBUTION CHANNEL, 2025–2034 (USD MILLION) 100
      81. TABLE 80 REST OF ASIA-PACIFIC: FLAVORED SYRUPS MARKET, BY FLAVOR TYPE, 2025–2034 (USD MILLION) 101
      82. TABLE 81 REST OF ASIA-PACIFIC: FLAVORED SYRUPS MARKET, BY CATEGORY, 2025–2034 (USD MILLION) 101
      83. TABLE 82 REST OF ASIA-PACIFIC: FLAVORED SYRUPS MARKET, BY DISTRIBUTION CHANNEL, 2025–2034 (USD MILLION) 102
      84. TABLE 83 REST OF THE WORLD: MARKET ESTIMATES & FORECAST, BY REGION, 2025–2034 (USD MILLION) 103
      85. TABLE 84 REST OF THE WORLD: FLAVORED SYRUPS MARKET, BY FLAVOR TYPE, 2025–2034 (USD MILLION) 104

        Market Segmentation

        Flavored Syrups Flavor Type Outlook (USD Billion, 2018-2032)

        • Fruits
        • Coffee
        • Chocolate
        • Vanilla
        • Mint
        • Nuts
        • Caramel
        • Blends

        Flavored Syrups Category Outlook (USD Billion, 2018-2032)

        • Conventional
        • Organic

        Flavored Syrups Distribution Channel Outlook (USD Billion, 2018-2032)

        • Food Service
        • Food Retail

        Flavored Syrups Regional Outlook (USD Billion, 2018-2032)

        • North America Outlook (USD Billion, 2018-2032)
          • North America Flavored Syrups by Flavor Type
            • Fruits
            • Coffee
            • Chocolate
            • Vanilla
            • Mint
            • Nuts
            • Caramel
            • Blends
          • North America Flavored Syrups by Category
            • Conventional
            • Organic
          • North America Flavored Syrups by Distribution Channel
            • Food Service
            • Food Retail
          • US Outlook (USD Billion, 2018-2032)
          • US Flavored Syrups by Flavor Type
            • Fruits
            • Coffee
            • Chocolate
            • Vanilla
            • Mint
            • Nuts
            • Caramel
            • Blends
          • US Flavored Syrups by Category
            • Conventional
            • Organic
          • US Flavored Syrups by Distribution Channel
            • Food Service
            • Food Retail
          • Canada Outlook (USD Billion, 2018-2032)
          • Canada Flavored Syrups by Flavor Type
            • Fruits
            • Coffee
            • Chocolate
            • Vanilla
            • Mint
            • Nuts
            • Caramel
            • Blends
          • Canada Flavored Syrups by Category
            • Conventional
            • Organic
          • Canada Flavored Syrups by Distribution Channel
            • Food Service
            • Food Retail
          • Europe Outlook (USD Billion, 2018-2032)
            • Europe Flavored Syrups by Flavor Type
              • Fruits
              • Coffee
              • Chocolate
              • Vanilla
              • Mint
              • Nuts
              • Caramel
              • Blends
            • Europe Flavored Syrups by Category
              • Conventional
              • Organic
            • Europe Flavored Syrups by Distribution Channel
              • Food Service
              • Food Retail
            • Germany Outlook (USD Billion, 2018-2032)
            • Germany Flavored Syrups by Flavor Type
              • Fruits
              • Coffee
              • Chocolate
              • Vanilla
              • Mint
              • Nuts
              • Caramel
              • Blends
            • Germany Flavored Syrups by Category
              • Conventional
              • Organic
            • Germany Flavored Syrups by Distribution Channel
              • Food Service
              • Food Retail
            • France Outlook (USD Billion, 2018-2032)
            • France Flavored Syrups by Flavor Type
              • Fruits
              • Coffee
              • Chocolate
              • Vanilla
              • Mint
              • Nuts
              • Caramel
              • Blends
            • France Flavored Syrups by Category
              • Conventional
              • Organic
            • France Flavored Syrups by Distribution Channel
              • Food Service
              • Food Retail
            • UK Outlook (USD Billion, 2018-2032)
            • UK Flavored Syrups by Flavor Type
              • Fruits
              • Coffee
              • Chocolate
              • Vanilla
              • Mint
              • Nuts
              • Caramel
              • Blends
            • UK Flavored Syrups by Category
              • Conventional
              • Organic
            • UK Flavored Syrups by Distribution Channel
              • Food Service
              • Food Retail
            • Italy Outlook (USD Billion, 2018-2032)
            • Italy Flavored Syrups by Flavor Type
              • Fruits
              • Coffee
              • Chocolate
              • Vanilla
              • Mint
              • Nuts
              • Caramel
              • Blends
            • Italy Flavored Syrups by Category
              • Conventional
              • Organic
            • Italy Flavored Syrups by Distribution Channel
              • Food Service
              • Food Retail
            • Spain Outlook (USD Billion, 2018-2032)
            • Spain Flavored Syrups by Flavor Type
              • Fruits
              • Coffee
              • Chocolate
              • Vanilla
              • Mint
              • Nuts
              • Caramel
              • Blends
            • Spain Flavored Syrups by Category
              • Conventional
              • Organic
            • Spain Flavored Syrups by Distribution Channel
              • Food Service
              • Food Retail
            • Rest Of Europe Outlook (USD Billion, 2018-2032)
            • Rest Of Europe Flavored Syrups by Flavor Type
              • Fruits
              • Coffee
              • Chocolate
              • Vanilla
              • Mint
              • Nuts
              • Caramel
              • Blends
            • Rest Of Europe Flavored Syrups by Category
              • Conventional
              • Organic
            • Rest Of Europe Flavored Syrups by Distribution Channel
              • Food Service
              • Food Retail
            • Asia-Pacific Outlook (USD Billion, 2018-2032)
              • Asia-Pacific Flavored Syrups by Flavor Type
                • Fruits
                • Coffee
                • Chocolate
                • Vanilla
                • Mint
                • Nuts
                • Caramel
                • Blends
              • Asia-Pacific Flavored Syrups by Category
                • Conventional
                • Organic
              • Asia-Pacific Flavored Syrups by Distribution Channel
                • Food Service
                • Food Retail
              • China Outlook (USD Billion, 2018-2032)
              • China Flavored Syrups by Flavor Type
                • Fruits
                • Coffee
                • Chocolate
                • Vanilla
                • Mint
                • Nuts
                • Caramel
                • Blends
              • China Flavored Syrups by Category
                • Conventional
                • Organic
              • China Flavored Syrups by Distribution Channel
                • Food Service
                • Food Retail
              • Japan Outlook (USD Billion, 2018-2032)
              • Japan Flavored Syrups by Flavor Type
                • Fruits
                • Coffee
                • Chocolate
                • Vanilla
                • Mint
                • Nuts
                • Caramel
                • Blends
              • Japan Flavored Syrups by Category
                • Conventional
                • Organic
              • Japan Flavored Syrups by Distribution Channel
                • Food Service
                • Food Retail
              • India Outlook (USD Billion, 2018-2032)
              • India Flavored Syrups by Flavor Type
                • Fruits
                • Coffee
                • Chocolate
                • Vanilla
                • Mint
                • Nuts
                • Caramel
                • Blends
              • India Flavored Syrups by Category
                • Conventional
                • Organic
              • India Flavored Syrups by Distribution Channel
                • Food Service
                • Food Retail
              • Australia Outlook (USD Billion, 2018-2032)
              • Australia Flavored Syrups by Flavor Type
                • Fruits
                • Coffee
                • Chocolate
                • Vanilla
                • Mint
                • Nuts
                • Caramel
                • Blends
              • Australia Flavored Syrups by Category
                • Conventional
                • Organic
              • Australia Flavored Syrups by Distribution Channel
                • Food Service
                • Food Retail
              • Rest of Asia-Pacific Outlook (USD Billion, 2018-2032)
              • Rest of Asia-Pacific Flavored Syrups by Flavor Type
                • Fruits
                • Coffee
                • Chocolate
                • Vanilla
                • Mint
                • Nuts
                • Caramel
                • Blends
              • Rest of Asia-Pacific Flavored Syrups by Category
                • Conventional
                • Organic
              • Rest of Asia-Pacific Flavored Syrups by Distribution Channel
                • Food Service
                • Food Retail
              • Rest of the World Outlook (USD Billion, 2018-2032)
                • Rest of the World Flavored Syrups by Flavor Type
                  • Fruits
                  • Coffee
                  • Chocolate
                  • Vanilla
                  • Mint
                  • Nuts
                  • Caramel
                  • Blends
                • Rest of the World Flavored Syrups by Category
                  • Conventional
                  • Organic
                • Rest of the World Flavored Syrups by Distribution Channel
                  • Food Service
                  • Food Retail
                • Middle East Outlook (USD Billion, 2018-2032)
                • Middle East Flavored Syrups by Flavor Type
                  • Fruits
                  • Coffee
                  • Chocolate
                  • Vanilla
                  • Mint
                  • Nuts
                  • Caramel
                  • Blends
                • Middle East Flavored Syrups by Category
                  • Conventional
                  • Organic
                • Middle East Flavored Syrups by Distribution Channel
                  • Food Service
                  • Food Retail
                • Africa Outlook (USD Billion, 2018-2032)
                • Africa Flavored Syrups by Flavor Type
                  • Fruits
                  • Coffee
                  • Chocolate
                  • Vanilla
                  • Mint
                  • Nuts
                  • Caramel
                  • Blends
                • Africa Flavored Syrups by Category
                  • Conventional
                  • Organic
                • Africa Flavored Syrups by Distribution Channel
                  • Food Service
                  • Food Retail
                • Latin America Outlook (USD Billion, 2018-2032)
                • Latin America Flavored Syrups by Flavor Type
                  • Fruits
                  • Coffee
                  • Chocolate
                  • Vanilla
                  • Mint
                  • Nuts
                  • Caramel
                  • Blends
                • Latin America Flavored Syrups by Category
                  • Conventional
                  • Organic
                • Latin America Flavored Syrups by Distribution Channel
                  • Food Service
                  • Food Retail


    Infographic

    Free Sample Request

    Kindly complete the form below to receive a free sample of this Report

    Get Free Sample

    Customer Strories

    “I am very pleased with how market segments have been defined in a relevant way for my purposes (such as "Portable Freezers & refrigerators" and "last-mile"). In general the report is well structured. Thanks very much for your efforts.”

    Victoria Milne

    Founder
    Case Study
    Chemicals and Materials