• Cat-intel
  • MedIntelliX
  • Resources
  • About Us
  • Hero Background
    English
    Chinese
    French
    Japanese
    Korean
    German
    Spanish

    Europe UPS Market Analysis

    ID: MRFR/E&P/14671-HCR
    128 Pages
    Garvit Vyas
    October 2025

    Europe UPS Market Research Report Information By Capacity (Less than 10kVA, 10-100Kva, and Above 100 kVA), By Type (Standby UPS System, Online UPS System, and Line-interactive UPS System), By Application (Data Centers, Telecommunications, Healthcare (Hospitals & Clinics), Industrial and Others) –and Europe Market Forecast Till 2035

    Share:
    Download PDF ×

    We do not share your information with anyone. However, we may send you emails based on your report interest from time to time. You may contact us at any time to opt-out.

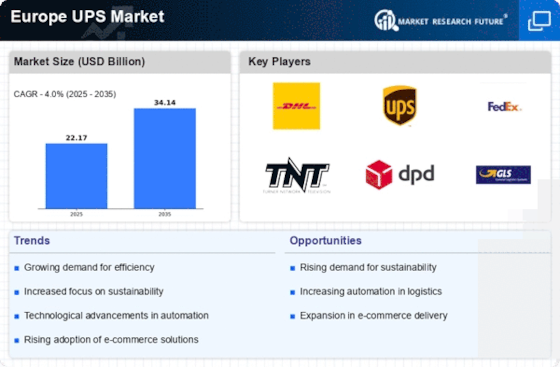
    Europe UPS Market Infographic
    Purchase Options

    Market Analysis

    In-depth Analysis of Europe UPS Market Industry Landscape

    The Europe Uninterruptible Power Supply (UPS) market is influenced by various factors that collectively shape its dynamics and growth. One of the key drivers of this market is the increasing reliance on digital technology and the need for uninterrupted power to support critical infrastructure. With businesses, industries, and individuals relying heavily on electronic devices and data centers, the demand for UPS systems has grown to ensure a continuous and stable power supply, mitigating the impact of power outages or fluctuations.

    Government policies and regulations are critical market factors in the European UPS sector. The European Union (EU) and national governments have established regulations and standards to ensure the reliability and efficiency of power supply systems. Additionally, environmental considerations drive policies encouraging energy efficiency and the use of greener technologies. Incentives and regulations that promote the adoption of energy-efficient UPS systems contribute to the market's growth and alignment with broader sustainability goals.

    Technological advancements play a significant role in shaping the European UPS market. Innovations in UPS design, battery technologies, and energy storage solutions enhance the efficiency and performance of UPS systems. Lithium-ion batteries, for example, are gaining popularity for their longer lifespan and higher energy density. Advanced features such as remote monitoring, predictive maintenance, and integration with smart grids contribute to the appeal and effectiveness of UPS systems in the European market.

    Economic factors are pivotal in influencing the European UPS market. The increasing digitization of industries and the growing reliance on data centers contribute to the market's expansion. Businesses recognize the financial implications of downtime and data loss, driving investments in reliable UPS systems to safeguard operations and critical data. The Total Cost of Ownership (TCO) considerations, including initial costs, maintenance, and energy efficiency, play a crucial role in the decision-making process for businesses and organizations.

    The energy transition towards sustainability is a key market factor in Europe. As the region emphasizes reducing carbon emissions and transitioning towards greener energy sources, UPS systems are expected to align with these goals. Energy-efficient UPS systems and those capable of integrating with renewable energy sources contribute to a more sustainable power infrastructure, fostering a positive market environment in the context of broader environmental initiatives.

    Infrastructure development is another critical market factor influencing the European UPS market. The expansion of data centers, the modernization of industrial facilities, and the growth of telecommunications infrastructure drive the demand for reliable power protection solutions. UPS systems are integral to ensuring the continuous operation of critical infrastructure, and as these infrastructures expand and evolve, the demand for advanced UPS solutions is likely to increase.

    Market competitiveness and industry collaborations contribute to the dynamics of the European UPS market. The presence of various UPS manufacturers, service providers, and technology developers fosters competition, driving innovation and efficiency improvements. Collaborations between industry players and technology partners lead to the development of UPS solutions that address specific challenges and requirements in the European market, ensuring a diverse range of products to meet various needs.

    Consumer awareness and preferences also impact the European UPS market. While end consumers may not directly purchase UPS systems, businesses and organizations are increasingly aware of the importance of reliable power protection. Consumer preferences for energy-efficient solutions, reliability, and the ability to integrate with modern technologies influence the selection and adoption of UPS systems in the European market.

    The European UPS market is shaped by a combination of factors, including government policies, technological advancements, economic considerations, and consumer preferences. As the region continues to advance towards a digital and sustainable future, UPS systems play a crucial role in ensuring the reliability of power supply for critical applications. The interplay of these market factors ensures that the European UPS market remains dynamic, adapting to the evolving needs of businesses, industries, and the broader energy landscape.

    Author
    Garvit Vyas
    Analyst

    Explore the profile of Garvit Vyas, one of our esteemed authors at Market Research Future, and access their expert research contributions in the field of market research and industry analysis

    Leave a Comment

    FAQs

    How much is the UPS market?

    The Europe UPS market size was valued at USD 12.5 Billion in 2024.

    What is the growth rate of the UPS market?

    The market is projected to grow at a CAGR of 4.51% during the forecast period, 2025-2034.

    Who are the key players in the UPS market?

    The key players in the market are Emerson Electric Co., ABB Ltd, Schneider Electric SE, Riello Elettronica SPA, and EATON Corporation PLC.

    Which capacity led the UPS market?

    The less than 10kVA category dominated the market in 2022.

    Which type led the UPS market?

    The standby UPS system category dominated the market in 2022.

    Which application had the largest market share in the UPS market?

    The data centers category had the largest share of the market.

    Market Summary

    The Europe UPS market is projected to grow from 22.17 USD Billion in 2024 to 34.14 USD Billion by 2035.

    Key Market Trends & Highlights

    Europe UPS Key Trends and Highlights

    • The market is expected to experience a compound annual growth rate of 4.51 percent from 2025 to 2035. By 2035, the market valuation is anticipated to reach 20.3 USD Billion, indicating robust growth potential. in 2024, the market is valued at 22.17 USD Billion, reflecting the current demand for UPS solutions. Growing adoption of advanced battery technologies due to increasing energy efficiency concerns is a major market driver.

    Market Size & Forecast

    2024 Market Size 22.17 (USD Billion)
    2035 Market Size 34.14 (USD Billion)
    CAGR (2025 - 2035) 4.00%
    Largest Regional Market Share in 2024 -)

    Major Players

    <p>Apple Inc (US), Microsoft Corp (US), Amazon.com Inc (US), Alphabet Inc (US), Berkshire Hathaway Inc (US), Tesla Inc (US), Meta Platforms Inc (US), Johnson &amp; Johnson (US), Visa Inc (US), Procter &amp; Gamble Co (US)</p>

    Market Trends

    Growing adoption of lithium-ion batteries is driving the market growth

    They are known for their faster charging capabilities and improved efficiency, providing a more reliable and responsive power backup solution. As businesses and data centers in Europe prioritize energy efficiency and sustainability, the shift towards lithium-ion batteries in UPS systems aligns with these goals.

    Furthermore, the growth of the Europe UPS market is influenced by the integration of smart technologies and the Internet of Things (IoT) to enhance system monitoring, management, and efficiency. UPS systems are becoming more intelligent and capable of self-diagnosis, predictive maintenance, and remote monitoring. IoT-enabled sensors and connectivity features allow for real-time data collection on UPS performance, battery status, and overall health. 

    It can be leveraged to optimize energy usage, pre-emptively identify potential issues, and streamline maintenance activities. The involvement of smart technologies improves UPS systems' reliability and contributes to energy conservation and cost savings. As industries across Europe embrace Industry 4.0 principles, incorporating IoT into UPS solutions aligns with the broader trend of digital transformation and intelligent infrastructure. Thus driving the UPS market revenue.

    <p>The ongoing transition towards renewable energy sources is driving a notable increase in demand for uninterruptible power supply systems across Europe, as industries seek to enhance energy resilience and sustainability.</p>

    European Commission

    Europe UPS Market Market Drivers

    Market Growth Projections

    The Global Europe UPS Market Industry is poised for substantial growth, with projections indicating a market size of 12.5 USD Billion in 2024 and an anticipated increase to 20.3 USD Billion by 2035. This growth trajectory reflects the increasing reliance on UPS systems across various sectors, driven by factors such as e-commerce expansion, technological advancements, and regulatory compliance. The market is expected to exhibit a CAGR of 4.51% from 2025 to 2035, suggesting a robust demand for UPS solutions in the coming years. These projections underscore the critical role of UPS systems in ensuring reliable power supply and operational continuity across industries.

    Technological Advancements

    Technological innovations play a pivotal role in shaping the Global Europe UPS Market Industry. The introduction of smart UPS systems equipped with IoT capabilities allows for real-time monitoring and management of power supply. These advancements not only improve energy efficiency but also enhance the reliability of power delivery. As businesses increasingly prioritize sustainability, the demand for energy-efficient UPS solutions is likely to rise. The market's growth trajectory, with a projected CAGR of 4.51% from 2025 to 2035, indicates that companies are investing in cutting-edge technologies to optimize their operations and reduce their carbon footprint.

    Rising Demand for E-commerce

    The Global Europe UPS Market Industry experiences a notable surge in demand driven by the rapid growth of e-commerce. As online shopping becomes increasingly prevalent, businesses require efficient logistics solutions to meet consumer expectations for fast and reliable delivery. In 2024, the market is projected to reach 12.5 USD Billion, reflecting the critical role of UPS systems in facilitating e-commerce operations. This trend is likely to continue, with the market expected to expand significantly as more retailers adopt online platforms. The integration of advanced technologies in UPS systems further enhances their efficiency, catering to the evolving needs of the e-commerce sector.

    Growing Data Center Infrastructure

    The expansion of data center infrastructure significantly influences the Global Europe UPS Market Industry. With the increasing reliance on digital services and cloud computing, data centers require robust power backup solutions to ensure uninterrupted operations. UPS systems are essential for protecting sensitive equipment and maintaining data integrity. As the demand for data storage and processing capabilities continues to rise, the market for UPS systems is likely to expand. This growth is reflected in the projected market size of 12.5 USD Billion in 2024, as businesses recognize the critical role of UPS in supporting their digital infrastructure.

    Regulatory Compliance and Standards

    Regulatory compliance and industry standards are crucial drivers of the Global Europe UPS Market Industry. As governments implement stringent regulations regarding power quality and reliability, businesses are compelled to invest in UPS systems that meet these requirements. Compliance with standards not only ensures operational continuity but also enhances the reputation of organizations. The increasing focus on regulatory frameworks is likely to propel market growth, as companies seek to align their operations with legal mandates. This trend may contribute to the projected CAGR of 4.51% from 2025 to 2035, highlighting the importance of compliance in shaping the UPS market.

    Increased Focus on Energy Efficiency

    The Global Europe UPS Market Industry is witnessing a heightened emphasis on energy efficiency as organizations strive to minimize operational costs and environmental impact. Regulatory frameworks across Europe are encouraging businesses to adopt energy-efficient practices, including the use of advanced UPS systems. These systems not only provide reliable power backup but also contribute to reduced energy consumption. As a result, companies are increasingly investing in UPS solutions that align with sustainability goals. This trend is expected to drive market growth, with projections indicating a market size of 20.3 USD Billion by 2035, underscoring the importance of energy-efficient technologies in the UPS sector.

    Market Segment Insights

    UPS Capacity Insights

    <p>The Europe UPS market segmentation, based on capacity, includes Less than 10kVA, 10-100KVA, and Above 100 kVA. The less than 10kVA segment dominated the market. It caters to various applications, offering compact and efficient solutions for diverse industries and applications. UPS systems with capacities below 10kVA are suitable for powering smaller electronic devices, ensuring uninterrupted power supply and safeguarding against potential disruptions in various settings.</p>

    UPS Type Insights

    <p>The Europe UPS market segmentation, based on type, includes Standby UPS System, Online UPS System, and Line-interactive UPS System. The standby UPS system segment dominated the market. It provides crucial power backup by swiftly switching to battery mode during outages, ensuring an uninterrupted energy supply. This segment is pivotal for various industries and applications, safeguarding critical equipment and data against power disruptions. As technology advances, Standby UPS Systems continue to play a major role in maintaining operational continuity across diverse sectors in the European market.</p>

    <p>Figure 1: Europe UPS Market, by Type, 2022 &amp; 2032 (USD Billion)</p>

    <p>Source: Secondary Research, Primary Research, MRFR Database and Analyst Review</p>

    UPS Application Insights

    <p>The Europe UPS market segmentation, based on application, includes Data Centers, Telecommunications, Healthcare (Hospitals and clinics), industries, and Others. The data centers category generated the most income. UPS systems are pivotal in ensuring uninterrupted power supply to data centers, safeguarding against potential disruptions and data loss. The growing demand for reliable power solutions in the data center industry is driving the adoption of UPS technology, making it a key segment in the European market for <a href="https://www.marketresearchfuture.com/reports/uninterruptible-power-supply-ups-market-6623">Uninterruptible Power Supply</a> (UPS) systems.</p>

    UPS Country Insights

    <p>The rapid expansion of digital technologies and cloud computing has resulted in a recent boom in demand for UPS in Europe. As an economic powerhouse, Germany leads in adopting UPS due to its robust industrial sector. The United Kingdom emphasizes data center expansion, driving UPS demand. France prioritizes sustainable solutions, fostering growth in eco-friendly UPS technologies.&nbsp;</p>

    <p>Italy experiences steady growth with increasing reliance on electronic devices. Spain focuses on the integration of smart grid solutions within its UPS infrastructure. Eastern European countries like Poland and Hungary witness growing UPS demand driven by industrial and IT sectors. Europe's UPS market showcases a blend of industrial, technological, and environmental considerations, with each country contributing to the region's evolving power protection landscape.</p>

    Get more detailed insights about Europe UPS Market Research Report – Forecast till 2035

    Regional Insights

    Key Players and Competitive Insights

    Leading market players are investing majorly in research and development to spread their product lines, which will help the UPS market grow even more. The participants also undertake various strategic activities to spread their footprint with new market developments, including product launches, contractual agreements, mergers and acquisitions, major investments, and collaboration with other organizations. The UPS industry must offer cost-effective items to spread and survive in a competitive and rising market climate.

    Major players in the UPS market are attempting to raise market demand by investing in research and development operations, including Emerson Electric Co., ABB Ltd, Schneider Electric SE, Riello Elettronica SPA, and EATON Corporation PLC.

    Key Companies in the Europe UPS Market market include

    Industry Developments

    February 2022:Mitsubishi Electric Corporation announced that its United States subsidiary, Mitsubishi Electric Power Products, Inc. (MEPPI), acquired Computer Protection Technology, Inc. (CPT), headquartered in California, aiming to expand its Uninterruptible Power Supply (UPS) business in North America. With this acquisition, MEPPI and CPT were expected to strengthen their respective business structures to provide highly reliable and professional one-stop services for UPS systems in the North American market, from installation to maintenance.

    Future Outlook

    Europe UPS Market Future Outlook

    <p>The Europe UPS Market is projected to grow at a 4.51% CAGR from 2025 to 2035, driven by increasing demand for reliable power solutions and technological advancements.</p>

    New opportunities lie in:

    • <p>Invest in smart UPS systems integrating IoT for enhanced monitoring and efficiency. Expand service offerings to include renewable energy integration for UPS solutions. Develop customized UPS solutions for emerging sectors like electric vehicles and data centers.</p>

    <p>By 2035, the Europe UPS Market is expected to be robust, reflecting substantial growth and innovation.</p>

    Market Segmentation

    UPS Type Outlook

    • Standby UPS System
    • Online UPS System
    • Line-interactive UPS System

    UPS Capacity Outlook

    • Less than 10kVA
    • 10-100kVA
    • Above 100kVA

    UPS Regional Outlook

    • {""=>["Germany"
    • "France"
    • "UK"
    • "Italy"
    • "Spain"
    • "Sweden"
    • "Denmark"
    • "Luxembourg"
    • "Norway"
    • "Austria"
    • "Rest of Europe"]}

    UPS Application Outlook

    • Data Centers
    • Telecommunications
    • Healthcare (Hospitals & Clinics)
    • Industrial
    • Others

    Report Scope

    Report Attribute/MetricDetails
    Market Size 2024  12.5 (USD Billion)
    Market Size 2025  23.06 (USD Billion)
    Market Size 203534.14 (USD Billion)
    Compound Annual Growth Rate (CAGR)4.00% (2025 - 2035)
    Report CoverageRevenue Forecast, Competitive Landscape, Growth Factors, and Trends
    Base Year2024
    Market Forecast Period2025 - 2035
    Historical Data2019 - 2023
    Report CoverageRevenue Forecast, Market Competitive Landscape, Growth Factors, and Trends
    Segments CoveredCapacity, Type, Application, and Region
    Region CoveredEurope
    Countries CoveredGermany, France, UK, Italy, Spain, Sweden, Denmark, Luxembourg, Norway, Austria, and Rest of Europe
    Key Companies ProfiledEmerson Electric Co., ABB Ltd, Schneider Electric SE, Riello Elettronica SPA, and EATON Corporation PLC
    Key Market OpportunitiesGrowing demand for digital technologies
    Key Market DynamicsGrowing awareness of power quality issues Increasing expansion of telecommunication networks

    FAQs

    How much is the UPS market?

    The Europe UPS market size was valued at USD 12.5 Billion in 2024.

    What is the growth rate of the UPS market?

    The market is projected to grow at a CAGR of 4.51% during the forecast period, 2025-2034.

    Who are the key players in the UPS market?

    The key players in the market are Emerson Electric Co., ABB Ltd, Schneider Electric SE, Riello Elettronica SPA, and EATON Corporation PLC.

    Which capacity led the UPS market?

    The less than 10kVA category dominated the market in 2022.

    Which type led the UPS market?

    The standby UPS system category dominated the market in 2022.

    Which application had the largest market share in the UPS market?

    The data centers category had the largest share of the market.

    1. SECTION I: EXECUTIVE SUMMARY AND KEY HIGHLIGHTS
      1. | 1.1 EXECUTIVE SUMMARY
      2. | | 1.1.1 Market Overview
      3. | | 1.1.2 Key Findings
      4. | | 1.1.3 Market Segmentation
      5. | | 1.1.4 Competitive Landscape
      6. | | 1.1.5 Challenges and Opportunities
      7. | | 1.1.6 Future Outlook
    2. SECTION II: SCOPING, METHODOLOGY AND MARKET STRUCTURE
      1. | 2.1 MARKET INTRODUCTION
      2. | | 2.1.1 Definition
      3. | | 2.1.2 Scope of the study
      4. | | | 2.1.2.1 Research Objective
      5. | | | 2.1.2.2 Assumption
      6. | | | 2.1.2.3 Limitations
      7. | 2.2 RESEARCH METHODOLOGY
      8. | | 2.2.1 Overview
      9. | | 2.2.2 Data Mining
      10. | | 2.2.3 Secondary Research
      11. | | 2.2.4 Primary Research
      12. | | | 2.2.4.1 Primary Interviews and Information Gathering Process
      13. | | | 2.2.4.2 Breakdown of Primary Respondents
      14. | | 2.2.5 Forecasting Model
      15. | | 2.2.6 Market Size Estimation
      16. | | | 2.2.6.1 Bottom-Up Approach
      17. | | | 2.2.6.2 Top-Down Approach
      18. | | 2.2.7 Data Triangulation
      19. | | 2.2.8 Validation
    3. SECTION III: QUALITATIVE ANALYSIS
      1. | 3.1 MARKET DYNAMICS
      2. | | 3.1.1 Overview
      3. | | 3.1.2 Drivers
      4. | | 3.1.3 Restraints
      5. | | 3.1.4 Opportunities
      6. | 3.2 MARKET FACTOR ANALYSIS
      7. | | 3.2.1 Value chain Analysis
      8. | | 3.2.2 Porter's Five Forces Analysis
      9. | | | 3.2.2.1 Bargaining Power of Suppliers
      10. | | | 3.2.2.2 Bargaining Power of Buyers
      11. | | | 3.2.2.3 Threat of New Entrants
      12. | | | 3.2.2.4 Threat of Substitutes
      13. | | | 3.2.2.5 Intensity of Rivalry
      14. | | 3.2.3 COVID-19 Impact Analysis
      15. | | | 3.2.3.1 Market Impact Analysis
      16. | | | 3.2.3.2 Regional Impact
      17. | | | 3.2.3.3 Opportunity and Threat Analysis
    4. SECTION IV: QUANTITATIVE ANALYSIS
      1. | 4.1 Energy & Power, BY Capacity (USD Billion)
      2. | | 4.1.1 Less than 10kVA
      3. | | 4.1.2 10-100kVA
      4. | | 4.1.3 Above 100 kVA
      5. | 4.2 Energy & Power, BY Type (USD Billion)
      6. | | 4.2.1 Standby UPS System
      7. | | 4.2.2 Online UPS System
      8. | | 4.2.3 Line-interactive UPS System
      9. | 4.3 Energy & Power, BY Application (USD Billion)
      10. | | 4.3.1 Data Centers
      11. | | 4.3.2 Telecommunications
      12. | | 4.3.3 Healthcare (Hospitals & Clinics)
      13. | | 4.3.4 Industrial
      14. | | 4.3.5 Others
      15. | 4.4 Energy & Power, BY Region (USD Billion)
      16. | | 4.4.1 North America
      17. | | | 4.4.1.1 US
      18. | | | 4.4.1.2 Canada
      19. | | 4.4.2 Europe
      20. | | | 4.4.2.1 Germany
      21. | | | 4.4.2.2 UK
      22. | | | 4.4.2.3 France
      23. | | | 4.4.2.4 Russia
      24. | | | 4.4.2.5 Italy
      25. | | | 4.4.2.6 Spain
      26. | | | 4.4.2.7 Rest of Europe
      27. | | 4.4.3 APAC
      28. | | | 4.4.3.1 China
      29. | | | 4.4.3.2 India
      30. | | | 4.4.3.3 Japan
      31. | | | 4.4.3.4 South Korea
      32. | | | 4.4.3.5 Malaysia
      33. | | | 4.4.3.6 Thailand
      34. | | | 4.4.3.7 Indonesia
      35. | | | 4.4.3.8 Rest of APAC
      36. | | 4.4.4 South America
      37. | | | 4.4.4.1 Brazil
      38. | | | 4.4.4.2 Mexico
      39. | | | 4.4.4.3 Argentina
      40. | | | 4.4.4.4 Rest of South America
      41. | | 4.4.5 MEA
      42. | | | 4.4.5.1 GCC Countries
      43. | | | 4.4.5.2 South Africa
      44. | | | 4.4.5.3 Rest of MEA
    5. SECTION V: COMPETITIVE ANALYSIS
      1. | 5.1 Competitive Landscape
      2. | | 5.1.1 Overview
      3. | | 5.1.2 Competitive Analysis
      4. | | 5.1.3 Market share Analysis
      5. | | 5.1.4 Major Growth Strategy in the Energy & Power
      6. | | 5.1.5 Competitive Benchmarking
      7. | | 5.1.6 Leading Players in Terms of Number of Developments in the Energy & Power
      8. | | 5.1.7 Key developments and growth strategies
      9. | | | 5.1.7.1 New Product Launch/Service Deployment
      10. | | | 5.1.7.2 Merger & Acquisitions
      11. | | | 5.1.7.3 Joint Ventures
      12. | | 5.1.8 Major Players Financial Matrix
      13. | | | 5.1.8.1 Sales and Operating Income
      14. | | | 5.1.8.2 Major Players R&D Expenditure. 2023
      15. | 5.2 Company Profiles
      16. | | 5.2.1 DHL (DE)
      17. | | | 5.2.1.1 Financial Overview
      18. | | | 5.2.1.2 Products Offered
      19. | | | 5.2.1.3 Key Developments
      20. | | | 5.2.1.4 SWOT Analysis
      21. | | | 5.2.1.5 Key Strategies
      22. | | 5.2.2 UPS (US)
      23. | | | 5.2.2.1 Financial Overview
      24. | | | 5.2.2.2 Products Offered
      25. | | | 5.2.2.3 Key Developments
      26. | | | 5.2.2.4 SWOT Analysis
      27. | | | 5.2.2.5 Key Strategies
      28. | | 5.2.3 FedEx (US)
      29. | | | 5.2.3.1 Financial Overview
      30. | | | 5.2.3.2 Products Offered
      31. | | | 5.2.3.3 Key Developments
      32. | | | 5.2.3.4 SWOT Analysis
      33. | | | 5.2.3.5 Key Strategies
      34. | | 5.2.4 TNT (NL)
      35. | | | 5.2.4.1 Financial Overview
      36. | | | 5.2.4.2 Products Offered
      37. | | | 5.2.4.3 Key Developments
      38. | | | 5.2.4.4 SWOT Analysis
      39. | | | 5.2.4.5 Key Strategies
      40. | | 5.2.5 DPD (FR)
      41. | | | 5.2.5.1 Financial Overview
      42. | | | 5.2.5.2 Products Offered
      43. | | | 5.2.5.3 Key Developments
      44. | | | 5.2.5.4 SWOT Analysis
      45. | | | 5.2.5.5 Key Strategies
      46. | | 5.2.6 GLS (NL)
      47. | | | 5.2.6.1 Financial Overview
      48. | | | 5.2.6.2 Products Offered
      49. | | | 5.2.6.3 Key Developments
      50. | | | 5.2.6.4 SWOT Analysis
      51. | | | 5.2.6.5 Key Strategies
      52. | | 5.2.7 Hermes (DE)
      53. | | | 5.2.7.1 Financial Overview
      54. | | | 5.2.7.2 Products Offered
      55. | | | 5.2.7.3 Key Developments
      56. | | | 5.2.7.4 SWOT Analysis
      57. | | | 5.2.7.5 Key Strategies
      58. | | 5.2.8 Royal Mail (GB)
      59. | | | 5.2.8.1 Financial Overview
      60. | | | 5.2.8.2 Products Offered
      61. | | | 5.2.8.3 Key Developments
      62. | | | 5.2.8.4 SWOT Analysis
      63. | | | 5.2.8.5 Key Strategies
      64. | | 5.2.9 PostNL (NL)
      65. | | | 5.2.9.1 Financial Overview
      66. | | | 5.2.9.2 Products Offered
      67. | | | 5.2.9.3 Key Developments
      68. | | | 5.2.9.4 SWOT Analysis
      69. | | | 5.2.9.5 Key Strategies
      70. | 5.3 Appendix
      71. | | 5.3.1 References
      72. | | 5.3.2 Related Reports
    6. LIST OF FIGURES
      1. | 6.1 MARKET SYNOPSIS
      2. | 6.2 NORTH AMERICA MARKET ANALYSIS
      3. | 6.3 US MARKET ANALYSIS BY CAPACITY
      4. | 6.4 US MARKET ANALYSIS BY TYPE
      5. | 6.5 US MARKET ANALYSIS BY APPLICATION
      6. | 6.6 CANADA MARKET ANALYSIS BY CAPACITY
      7. | 6.7 CANADA MARKET ANALYSIS BY TYPE
      8. | 6.8 CANADA MARKET ANALYSIS BY APPLICATION
      9. | 6.9 EUROPE MARKET ANALYSIS
      10. | 6.10 GERMANY MARKET ANALYSIS BY CAPACITY
      11. | 6.11 GERMANY MARKET ANALYSIS BY TYPE
      12. | 6.12 GERMANY MARKET ANALYSIS BY APPLICATION
      13. | 6.13 UK MARKET ANALYSIS BY CAPACITY
      14. | 6.14 UK MARKET ANALYSIS BY TYPE
      15. | 6.15 UK MARKET ANALYSIS BY APPLICATION
      16. | 6.16 FRANCE MARKET ANALYSIS BY CAPACITY
      17. | 6.17 FRANCE MARKET ANALYSIS BY TYPE
      18. | 6.18 FRANCE MARKET ANALYSIS BY APPLICATION
      19. | 6.19 RUSSIA MARKET ANALYSIS BY CAPACITY
      20. | 6.20 RUSSIA MARKET ANALYSIS BY TYPE
      21. | 6.21 RUSSIA MARKET ANALYSIS BY APPLICATION
      22. | 6.22 ITALY MARKET ANALYSIS BY CAPACITY
      23. | 6.23 ITALY MARKET ANALYSIS BY TYPE
      24. | 6.24 ITALY MARKET ANALYSIS BY APPLICATION
      25. | 6.25 SPAIN MARKET ANALYSIS BY CAPACITY
      26. | 6.26 SPAIN MARKET ANALYSIS BY TYPE
      27. | 6.27 SPAIN MARKET ANALYSIS BY APPLICATION
      28. | 6.28 REST OF EUROPE MARKET ANALYSIS BY CAPACITY
      29. | 6.29 REST OF EUROPE MARKET ANALYSIS BY TYPE
      30. | 6.30 REST OF EUROPE MARKET ANALYSIS BY APPLICATION
      31. | 6.31 APAC MARKET ANALYSIS
      32. | 6.32 CHINA MARKET ANALYSIS BY CAPACITY
      33. | 6.33 CHINA MARKET ANALYSIS BY TYPE
      34. | 6.34 CHINA MARKET ANALYSIS BY APPLICATION
      35. | 6.35 INDIA MARKET ANALYSIS BY CAPACITY
      36. | 6.36 INDIA MARKET ANALYSIS BY TYPE
      37. | 6.37 INDIA MARKET ANALYSIS BY APPLICATION
      38. | 6.38 JAPAN MARKET ANALYSIS BY CAPACITY
      39. | 6.39 JAPAN MARKET ANALYSIS BY TYPE
      40. | 6.40 JAPAN MARKET ANALYSIS BY APPLICATION
      41. | 6.41 SOUTH KOREA MARKET ANALYSIS BY CAPACITY
      42. | 6.42 SOUTH KOREA MARKET ANALYSIS BY TYPE
      43. | 6.43 SOUTH KOREA MARKET ANALYSIS BY APPLICATION
      44. | 6.44 MALAYSIA MARKET ANALYSIS BY CAPACITY
      45. | 6.45 MALAYSIA MARKET ANALYSIS BY TYPE
      46. | 6.46 MALAYSIA MARKET ANALYSIS BY APPLICATION
      47. | 6.47 THAILAND MARKET ANALYSIS BY CAPACITY
      48. | 6.48 THAILAND MARKET ANALYSIS BY TYPE
      49. | 6.49 THAILAND MARKET ANALYSIS BY APPLICATION
      50. | 6.50 INDONESIA MARKET ANALYSIS BY CAPACITY
      51. | 6.51 INDONESIA MARKET ANALYSIS BY TYPE
      52. | 6.52 INDONESIA MARKET ANALYSIS BY APPLICATION
      53. | 6.53 REST OF APAC MARKET ANALYSIS BY CAPACITY
      54. | 6.54 REST OF APAC MARKET ANALYSIS BY TYPE
      55. | 6.55 REST OF APAC MARKET ANALYSIS BY APPLICATION
      56. | 6.56 SOUTH AMERICA MARKET ANALYSIS
      57. | 6.57 BRAZIL MARKET ANALYSIS BY CAPACITY
      58. | 6.58 BRAZIL MARKET ANALYSIS BY TYPE
      59. | 6.59 BRAZIL MARKET ANALYSIS BY APPLICATION
      60. | 6.60 MEXICO MARKET ANALYSIS BY CAPACITY
      61. | 6.61 MEXICO MARKET ANALYSIS BY TYPE
      62. | 6.62 MEXICO MARKET ANALYSIS BY APPLICATION
      63. | 6.63 ARGENTINA MARKET ANALYSIS BY CAPACITY
      64. | 6.64 ARGENTINA MARKET ANALYSIS BY TYPE
      65. | 6.65 ARGENTINA MARKET ANALYSIS BY APPLICATION
      66. | 6.66 REST OF SOUTH AMERICA MARKET ANALYSIS BY CAPACITY
      67. | 6.67 REST OF SOUTH AMERICA MARKET ANALYSIS BY TYPE
      68. | 6.68 REST OF SOUTH AMERICA MARKET ANALYSIS BY APPLICATION
      69. | 6.69 MEA MARKET ANALYSIS
      70. | 6.70 GCC COUNTRIES MARKET ANALYSIS BY CAPACITY
      71. | 6.71 GCC COUNTRIES MARKET ANALYSIS BY TYPE
      72. | 6.72 GCC COUNTRIES MARKET ANALYSIS BY APPLICATION
      73. | 6.73 SOUTH AFRICA MARKET ANALYSIS BY CAPACITY
      74. | 6.74 SOUTH AFRICA MARKET ANALYSIS BY TYPE
      75. | 6.75 SOUTH AFRICA MARKET ANALYSIS BY APPLICATION
      76. | 6.76 REST OF MEA MARKET ANALYSIS BY CAPACITY
      77. | 6.77 REST OF MEA MARKET ANALYSIS BY TYPE
      78. | 6.78 REST OF MEA MARKET ANALYSIS BY APPLICATION
      79. | 6.79 KEY BUYING CRITERIA OF ENERGY & POWER
      80. | 6.80 RESEARCH PROCESS OF MRFR
      81. | 6.81 DRO ANALYSIS OF ENERGY & POWER
      82. | 6.82 DRIVERS IMPACT ANALYSIS: ENERGY & POWER
      83. | 6.83 RESTRAINTS IMPACT ANALYSIS: ENERGY & POWER
      84. | 6.84 SUPPLY / VALUE CHAIN: ENERGY & POWER
      85. | 6.85 ENERGY & POWER, BY CAPACITY, 2024 (% SHARE)
      86. | 6.86 ENERGY & POWER, BY CAPACITY, 2024 TO 2035 (USD Billion)
      87. | 6.87 ENERGY & POWER, BY TYPE, 2024 (% SHARE)
      88. | 6.88 ENERGY & POWER, BY TYPE, 2024 TO 2035 (USD Billion)
      89. | 6.89 ENERGY & POWER, BY APPLICATION, 2024 (% SHARE)
      90. | 6.90 ENERGY & POWER, BY APPLICATION, 2024 TO 2035 (USD Billion)
      91. | 6.91 BENCHMARKING OF MAJOR COMPETITORS
    7. LIST OF TABLES
      1. | 7.1 LIST OF ASSUMPTIONS
      2. | | 7.1.1
      3. | 7.2 North America MARKET SIZE ESTIMATES; FORECAST
      4. | | 7.2.1 BY CAPACITY, 2025-2035 (USD Billion)
      5. | | 7.2.2 BY TYPE, 2025-2035 (USD Billion)
      6. | | 7.2.3 BY APPLICATION, 2025-2035 (USD Billion)
      7. | 7.3 US MARKET SIZE ESTIMATES; FORECAST
      8. | | 7.3.1 BY CAPACITY, 2025-2035 (USD Billion)
      9. | | 7.3.2 BY TYPE, 2025-2035 (USD Billion)
      10. | | 7.3.3 BY APPLICATION, 2025-2035 (USD Billion)
      11. | 7.4 Canada MARKET SIZE ESTIMATES; FORECAST
      12. | | 7.4.1 BY CAPACITY, 2025-2035 (USD Billion)
      13. | | 7.4.2 BY TYPE, 2025-2035 (USD Billion)
      14. | | 7.4.3 BY APPLICATION, 2025-2035 (USD Billion)
      15. | 7.5 Europe MARKET SIZE ESTIMATES; FORECAST
      16. | | 7.5.1 BY CAPACITY, 2025-2035 (USD Billion)
      17. | | 7.5.2 BY TYPE, 2025-2035 (USD Billion)
      18. | | 7.5.3 BY APPLICATION, 2025-2035 (USD Billion)
      19. | 7.6 Germany MARKET SIZE ESTIMATES; FORECAST
      20. | | 7.6.1 BY CAPACITY, 2025-2035 (USD Billion)
      21. | | 7.6.2 BY TYPE, 2025-2035 (USD Billion)
      22. | | 7.6.3 BY APPLICATION, 2025-2035 (USD Billion)
      23. | 7.7 UK MARKET SIZE ESTIMATES; FORECAST
      24. | | 7.7.1 BY CAPACITY, 2025-2035 (USD Billion)
      25. | | 7.7.2 BY TYPE, 2025-2035 (USD Billion)
      26. | | 7.7.3 BY APPLICATION, 2025-2035 (USD Billion)
      27. | 7.8 France MARKET SIZE ESTIMATES; FORECAST
      28. | | 7.8.1 BY CAPACITY, 2025-2035 (USD Billion)
      29. | | 7.8.2 BY TYPE, 2025-2035 (USD Billion)
      30. | | 7.8.3 BY APPLICATION, 2025-2035 (USD Billion)
      31. | 7.9 Russia MARKET SIZE ESTIMATES; FORECAST
      32. | | 7.9.1 BY CAPACITY, 2025-2035 (USD Billion)
      33. | | 7.9.2 BY TYPE, 2025-2035 (USD Billion)
      34. | | 7.9.3 BY APPLICATION, 2025-2035 (USD Billion)
      35. | 7.10 Italy MARKET SIZE ESTIMATES; FORECAST
      36. | | 7.10.1 BY CAPACITY, 2025-2035 (USD Billion)
      37. | | 7.10.2 BY TYPE, 2025-2035 (USD Billion)
      38. | | 7.10.3 BY APPLICATION, 2025-2035 (USD Billion)
      39. | 7.11 Spain MARKET SIZE ESTIMATES; FORECAST
      40. | | 7.11.1 BY CAPACITY, 2025-2035 (USD Billion)
      41. | | 7.11.2 BY TYPE, 2025-2035 (USD Billion)
      42. | | 7.11.3 BY APPLICATION, 2025-2035 (USD Billion)
      43. | 7.12 Rest of Europe MARKET SIZE ESTIMATES; FORECAST
      44. | | 7.12.1 BY CAPACITY, 2025-2035 (USD Billion)
      45. | | 7.12.2 BY TYPE, 2025-2035 (USD Billion)
      46. | | 7.12.3 BY APPLICATION, 2025-2035 (USD Billion)
      47. | 7.13 APAC MARKET SIZE ESTIMATES; FORECAST
      48. | | 7.13.1 BY CAPACITY, 2025-2035 (USD Billion)
      49. | | 7.13.2 BY TYPE, 2025-2035 (USD Billion)
      50. | | 7.13.3 BY APPLICATION, 2025-2035 (USD Billion)
      51. | 7.14 China MARKET SIZE ESTIMATES; FORECAST
      52. | | 7.14.1 BY CAPACITY, 2025-2035 (USD Billion)
      53. | | 7.14.2 BY TYPE, 2025-2035 (USD Billion)
      54. | | 7.14.3 BY APPLICATION, 2025-2035 (USD Billion)
      55. | 7.15 India MARKET SIZE ESTIMATES; FORECAST
      56. | | 7.15.1 BY CAPACITY, 2025-2035 (USD Billion)
      57. | | 7.15.2 BY TYPE, 2025-2035 (USD Billion)
      58. | | 7.15.3 BY APPLICATION, 2025-2035 (USD Billion)
      59. | 7.16 Japan MARKET SIZE ESTIMATES; FORECAST
      60. | | 7.16.1 BY CAPACITY, 2025-2035 (USD Billion)
      61. | | 7.16.2 BY TYPE, 2025-2035 (USD Billion)
      62. | | 7.16.3 BY APPLICATION, 2025-2035 (USD Billion)
      63. | 7.17 South Korea MARKET SIZE ESTIMATES; FORECAST
      64. | | 7.17.1 BY CAPACITY, 2025-2035 (USD Billion)
      65. | | 7.17.2 BY TYPE, 2025-2035 (USD Billion)
      66. | | 7.17.3 BY APPLICATION, 2025-2035 (USD Billion)
      67. | 7.18 Malaysia MARKET SIZE ESTIMATES; FORECAST
      68. | | 7.18.1 BY CAPACITY, 2025-2035 (USD Billion)
      69. | | 7.18.2 BY TYPE, 2025-2035 (USD Billion)
      70. | | 7.18.3 BY APPLICATION, 2025-2035 (USD Billion)
      71. | 7.19 Thailand MARKET SIZE ESTIMATES; FORECAST
      72. | | 7.19.1 BY CAPACITY, 2025-2035 (USD Billion)
      73. | | 7.19.2 BY TYPE, 2025-2035 (USD Billion)
      74. | | 7.19.3 BY APPLICATION, 2025-2035 (USD Billion)
      75. | 7.20 Indonesia MARKET SIZE ESTIMATES; FORECAST
      76. | | 7.20.1 BY CAPACITY, 2025-2035 (USD Billion)
      77. | | 7.20.2 BY TYPE, 2025-2035 (USD Billion)
      78. | | 7.20.3 BY APPLICATION, 2025-2035 (USD Billion)
      79. | 7.21 Rest of APAC MARKET SIZE ESTIMATES; FORECAST
      80. | | 7.21.1 BY CAPACITY, 2025-2035 (USD Billion)
      81. | | 7.21.2 BY TYPE, 2025-2035 (USD Billion)
      82. | | 7.21.3 BY APPLICATION, 2025-2035 (USD Billion)
      83. | 7.22 South America MARKET SIZE ESTIMATES; FORECAST
      84. | | 7.22.1 BY CAPACITY, 2025-2035 (USD Billion)
      85. | | 7.22.2 BY TYPE, 2025-2035 (USD Billion)
      86. | | 7.22.3 BY APPLICATION, 2025-2035 (USD Billion)
      87. | 7.23 Brazil MARKET SIZE ESTIMATES; FORECAST
      88. | | 7.23.1 BY CAPACITY, 2025-2035 (USD Billion)
      89. | | 7.23.2 BY TYPE, 2025-2035 (USD Billion)
      90. | | 7.23.3 BY APPLICATION, 2025-2035 (USD Billion)
      91. | 7.24 Mexico MARKET SIZE ESTIMATES; FORECAST
      92. | | 7.24.1 BY CAPACITY, 2025-2035 (USD Billion)
      93. | | 7.24.2 BY TYPE, 2025-2035 (USD Billion)
      94. | | 7.24.3 BY APPLICATION, 2025-2035 (USD Billion)
      95. | 7.25 Argentina MARKET SIZE ESTIMATES; FORECAST
      96. | | 7.25.1 BY CAPACITY, 2025-2035 (USD Billion)
      97. | | 7.25.2 BY TYPE, 2025-2035 (USD Billion)
      98. | | 7.25.3 BY APPLICATION, 2025-2035 (USD Billion)
      99. | 7.26 Rest of South America MARKET SIZE ESTIMATES; FORECAST
      100. | | 7.26.1 BY CAPACITY, 2025-2035 (USD Billion)
      101. | | 7.26.2 BY TYPE, 2025-2035 (USD Billion)
      102. | | 7.26.3 BY APPLICATION, 2025-2035 (USD Billion)
      103. | 7.27 MEA MARKET SIZE ESTIMATES; FORECAST
      104. | | 7.27.1 BY CAPACITY, 2025-2035 (USD Billion)
      105. | | 7.27.2 BY TYPE, 2025-2035 (USD Billion)
      106. | | 7.27.3 BY APPLICATION, 2025-2035 (USD Billion)
      107. | 7.28 GCC Countries MARKET SIZE ESTIMATES; FORECAST
      108. | | 7.28.1 BY CAPACITY, 2025-2035 (USD Billion)
      109. | | 7.28.2 BY TYPE, 2025-2035 (USD Billion)
      110. | | 7.28.3 BY APPLICATION, 2025-2035 (USD Billion)
      111. | 7.29 South Africa MARKET SIZE ESTIMATES; FORECAST
      112. | | 7.29.1 BY CAPACITY, 2025-2035 (USD Billion)
      113. | | 7.29.2 BY TYPE, 2025-2035 (USD Billion)
      114. | | 7.29.3 BY APPLICATION, 2025-2035 (USD Billion)
      115. | 7.30 Rest of MEA MARKET SIZE ESTIMATES; FORECAST
      116. | | 7.30.1 BY CAPACITY, 2025-2035 (USD Billion)
      117. | | 7.30.2 BY TYPE, 2025-2035 (USD Billion)
      118. | | 7.30.3 BY APPLICATION, 2025-2035 (USD Billion)
      119. | 7.31 PRODUCT LAUNCH/PRODUCT DEVELOPMENT/APPROVAL
      120. | | 7.31.1
      121. | 7.32 ACQUISITION/PARTNERSHIP
      122. | | 7.32.1

    Europe UPS Market Segmentation

    Market Segmentation Overview

    • Detailed segmentation data will be available in the full report
    • Comprehensive analysis by multiple parameters
    • Regional and country-level breakdowns
    • Market size forecasts by segment
    Infographic

    Free Sample Request

    Kindly complete the form below to receive a free sample of this Report

    Get Free Sample

    Customer Strories

    “I am very pleased with how market segments have been defined in a relevant way for my purposes (such as "Portable Freezers & refrigerators" and "last-mile"). In general the report is well structured. Thanks very much for your efforts.”

    Victoria Milne

    Founder
    Case Study
    Chemicals and Materials

    Compare Licence

    ×
    Features License Type
    Single User Multiuser License Enterprise User
    Price $4,950 $5,950 $7,250
    Maximum User Access Limit 1 User Upto 10 Users Unrestricted Access Throughout the Organization
    Free Customization
    Direct Access to Analyst
    Deliverable Format
    Platform Access
    Discount on Next Purchase 10% 15% 15%
    Printable Versions