• Cat-intel
  • MedIntelliX
  • Resources
  • About Us
  • Hero Background
    English
    Chinese
    French
    Japanese
    Korean
    German
    Spanish

    Europe Biodiesel Fuel Additive Market Size

    ID: MRFR/CnM/10913-HCR
    128 Pages
    Anshula Mandaokar
    October 2025

    Europe Biodiesel Fuel Additive Market Research Report Information By Source (Rapessed Oil/Canola Oil, Soybean Oil, Sunflower Oil, Palm Oil, Used Kitchen Oil Ester, Animal Fat, and Others), By Type (Antioxidants, Cold Flow Improvers, Octane & Cetane Improvers, Biocides, Dispersants, and Others), By End-Use (Transportation, Power Generation, Industrial, and Others) – and Europe Market Forecas...

    Share:
    Download PDF ×

    We do not share your information with anyone. However, we may send you emails based on your report interest from time to time. You may contact us at any time to opt-out.

    Europe Biodiesel Fuel Additive Market Infographic
    Purchase Options

    Europe Biodiesel Fuel Additive Size

    Europe Biodiesel Fuel Additive Market Growth Projections and Opportunities

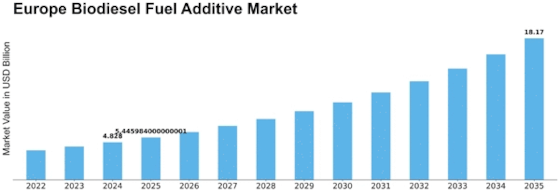
    The Europe Biodiesel Fuel Additive Market is greatly affected by government regulations and policies. Demand for biodiesel additives is driven by stringent environmental regulations and policies promoting sustainable fuels. Subsidies and incentives for biofuel production affect market development. Furthermore, continuing improvements in biodiesel production techniques and additive compositions also boost market growth. Also attracting the attention and investment of industry are innovations that improve biodiesel as a fuel additive in terms of efficiency, stability, or environmental performance. As consumers become acquainted with the environmental benefits of biodiesel and biodiesel fuel additives, a positive impact on market growth has resulted. Increasing consumer acceptance of cleaner and greener fuel choices is behind the strong demand seen in biodiesel fuel additives market. The market also is shaped by economic conditions and trends. Economic stability and growth can prompt increased investment in renewable energy, which benefits the biodiesel fuel additive market. The move towards sustainable, renewable sources of energy around the world is in line with Europe Biodiesel Fuel Additives Market aspirations. The market is expanding due to trends in global energy, such as the need to reduce emissions of carbon dioxide. The competitive environment, including the existence of major competitors and market competition itself is one factor influencing biodiesel fuel additive demand. The strategies adopted by market players--whether they merge with other companies, buy them out or set up joint operations with them--affect the concentration and development of the markets. An important factor of course is the development of infrastructure to produce, distribute and use biodiesel. A sound infrastructure makes it easier for biodiesel to fit into the existing fuel supply system, and this will greatly promote market expansion. Environmental concerns about sustainability and climate change are behind the use of biodiesel, fuel additives. Heightened concern over the environmental impact of traditional fuels is one aspect contributing to a healthy market for Europe Biodiesel Fuel Additive.

    Europe Biodiesel Fuel Additive Market Size Graph
    Author
    Anshula Mandaokar
    Team Lead - Research

    Anshula Mandaokar holds an academic degree in Chemical Engineering and has been contributing to the field for more than 5 years. She has expertise in Market Research and Business Consulting and serves as a Team Lead for a reputed Market Research firm under the Chemicals and Materials domain spectrum. She has worked on multiple projects, generating explicit results in a quick turnaround time. Her understanding of data interpretation justifies her role as a leader.

    Leave a Comment

    FAQs

    How much is the biodiesel fuel additive market?

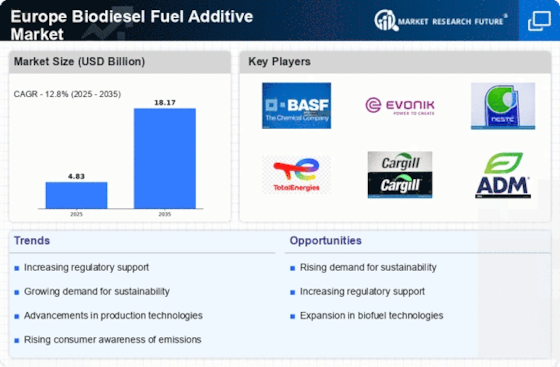
    The Europe Biodiesel Fuel Additive market size was valued at USD 4.83 Billion in 2024.

    What is the growth rate of the biodiesel fuel additive market?

    Europe Biodiesel Fuel Additive Market is expected to grow with a CAGR of 12.8% in the period 2025-2035

    Who are the key players in the biodiesel fuel additive market?

    The key players in the market are Fuel Quality Services, Inc. (FQS), Chemiphase Ltd, CLARIANT AG, E-ZOIL, Eastman Chemical Company, The Lubrizol Corporation, Afton Chemical Corporation, EVONIK INDUSTRIES AG, Chevron Oronite Company LLC, Biofuel Systems Group Ltd., TotalEnergies, NALCO, Infineum International Ltd., Innospec Inc., Renewable Oil International, Kemin Industries Inc., Lubrizol Corporation, PMC Biogenix Inc., Power Service Products Inc., and Vanderbilt Chemicals, LLC.

    Which source led the biodiesel fuel additive market?

    The rapessed oil/canola oil category dominated the market in 2024.

    Which end-use had the largest market share in the biodiesel fuel additive market?

    The power generation category had the largest share in the market.

    Market Summary

    The Europe Biodiesel Fuel Additive Market is projected to grow significantly from 4.83 USD Million in 2024 to 18.17 USD Million by 2035.

    Key Market Trends & Highlights

    Europe Biodiesel Fuel Additive Key Trends and Highlights

    • The market is expected to expand at a compound annual growth rate (CAGR) of 9.81 percent from 2025 to 2035.
    • By 2035, the market valuation is anticipated to reach 3500 USD Million, indicating robust growth potential.
    • in 2024, the market is valued at 4.83 USD Million, reflecting a strong foundation for future expansion.
    • Growing adoption of biodiesel fuel additives due to increasing environmental regulations is a major market driver.

    Market Size & Forecast

    2024 Market Size 4.83 (USD Million)
    2035 Market Size 18.17 (USD Million)
    CAGR (2025 - 2035) 12.80%
    Largest Regional Market Share in 2024 -)

    Major Players

    Apple Inc (US), Microsoft Corp (US), Amazon.com Inc (US), Alphabet Inc (US), Berkshire Hathaway Inc (US), Tesla Inc (US), Meta Platforms Inc (US), Johnson & Johnson (US), Visa Inc (US), Samsung Electronics Co Ltd (KR)

    Market Trends

    Rising concerns related to the environment are driving market growth

    Furthermore, additives for biodiesel work by augmenting the environmentally beneficial properties of biodiesel, increasing its efficiency and consciousness. There is a growing need for biodiesel and related additives as people, companies, and governments strive to reduce their environmental effect and carbon footprint. This is because a more sustainable and environmentally friendly energy landscape is required.

    The market for biodiesel fuel additives is largely driven by engine performance and efficiency. The environmental benefits of biodiesel have been tempered by concerns about its energy density, performance in cold climates, and possible effects on engine parts. This has made the creation and use of additives necessary to improve the general efficiency of engines running on biodiesel. These additives make biodiesel a feasible option for areas with varying climates by enhancing its cold flow characteristics and lubricity, which allows it to perform ideally in a wider temperature range.

    Furthermore, producers of vehicles and equipment find biodiesel additives to be an appealing alternative due to the higher energy efficiency they achieve, which results in lower fuel consumption and longer engine lifespans. The increased cetane rating of biodiesel—which can be further enhanced with additives—leads to improved combustion efficiency and lower emissions. Thus, driving the biodiesel fuel additive market revenue.

    The increasing emphasis on sustainable energy sources is likely to drive the demand for biodiesel fuel additives across Europe, as governments implement stricter regulations aimed at reducing carbon emissions.

    European Commission

    Europe Biodiesel Fuel Additive Market Market Drivers

    Rising Demand for Renewable Energy

    The Global Europe Biodiesel Fuel Additive Market Industry is experiencing a notable surge in demand for renewable energy sources. This trend is largely driven by the European Union's commitment to reducing greenhouse gas emissions and promoting sustainable energy. As countries strive to meet the EU's Renewable Energy Directive, the adoption of biodiesel and its additives is expected to increase significantly. In 2024, the market is projected to reach 1250 USD Million, reflecting the growing emphasis on eco-friendly alternatives to fossil fuels. This shift not only supports energy independence but also aligns with global sustainability goals.

    Market Segment Insights

    Biodiesel Fuel Additive Source Insights

    The Europe Biodiesel Fuel Additive market segmentation, based on source includes Rapessed Oil/Canola Oil, Soybean Oil, Sunflower Oil, Palm Oil, Used Kitchen Oil Ester, Animal Fat, and Others. The rapessed oil/canola oil segment dominated the market mostly. One popular feedstock used in the manufacturing of biodiesel is rapeseed oil, also referred to as canola oil. Under the biodiesel fuel additive market, it is categorized as "vegetable oil-based biodiesel feedstocks." By a procedure known as transesterification, the oil is transformed into biodiesel fuel using these feedstocks to create biodiesel.

    A renewable and more ecologically friendly substitute for conventional diesel fuel is biodiesel, which can be mixed with it.

    Biodiesel Fuel Additive Type Insights

    The Europe Biodiesel Fuel Additive market segmentation, based on type, includes Antioxidants, Cold Flow Improvers, Octane & Cetane Improvers, Biocides, Dispersants, and Others. The octane & cetane improvers category generated the most income. Admixtures, commonly referred to as octane & cetane improvers, are added to fuels to improve system performance. Maximum Octane and Cetane diesel fuels have a host of positive environmental effects, including decreased fuel consumption, white smoke during warm-up, and engine noise. They also minimize the ignition delay and emit less PM, HC, CO, and NOx.

    Biodiesel Fuel Additive End-Use Insights

    The Europe Biodiesel Fuel Additive market segmentation, based on end-use, includes Transportation, Power Generation, Industrial, and Others. The power generation category generated the most income. Renewable and sustainable energy options include the use of biodiesel fuel additives in power generation. Fuel additives for biodiesel can enhance the fuel's environmental qualities and performance. Biodiesel is a renewable fuel source. These additives can decrease emissions, increase fuel stability, and improve combustion efficiency.

    Figure 1: Europe Biodiesel Fuel Additive Market, by End-Use, 2022 & 2032 (USD Billion)Source: Secondary Research, Primary Research, Market Research Future Database and Analyst Review

    Get more detailed insights about Europe Biodiesel Fuel Additive Market Research Report - Forecast till 2035

    Regional Insights

    The Europe Biodiesel Fuel Additive market is growing rapidly over the forecast period. Stringent government emission regulations and rising public awareness of environmental deterioration are the primary factors behind the growth. Because of the strict emission regulations for vehicles set by the European Union, biodiesel fuel additives are used to reduce harmful emissions from automobiles. Moreover, the presence of significant automakers in the area has increased the demand for high-performance biodiesel fuel additives.

    Additionally, manufacturers from a variety of industries, including equipment manufacturers, suppliers of materials and components, engine producers, and full system integrators, call Germany home as one of the primary manufacturing hubs for the aircraft sector. Owing to all of these reasons, the nation's fuel additive market is anticipated to rise steadily over the projection year.

    Figure 2: EUROPE BIODIESEL FUEL ADDITIVE MARKET SHARE BY REGION 2022 (USD Billion)EUROPE BIODIESEL FUEL ADDITIVE MARKET SHARE BY REGION 2022Source: Secondary Research, Primary Research, Market Research Future Database and Analyst Review

    Key Players and Competitive Insights

    Leading market players are investing heavily in research and development in order to expand their product lines, which will help the biodiesel fuel additive market, grow even more. Market participants are also undertaking a variety of strategic activities to expand their footprint, with important market developments including new product launches, contractual agreements, mergers and acquisitions, higher investments, and collaboration with other organizations. To expand and survive in a more competitive and rising market climate, biodiesel fuel additive industry must offer cost-effective items.

    Key Companies in the Europe Biodiesel Fuel Additive Market market include

    Industry Developments

    Future Outlook

    Europe Biodiesel Fuel Additive Market Future Outlook

    The Europe Biodiesel Fuel Additive Market is projected to grow at a 12.80% CAGR from 2025 to 2035, driven by regulatory support, technological advancements, and increasing demand for sustainable fuels.

    New opportunities lie in:

    • Develop innovative biodiesel additives to enhance fuel efficiency and reduce emissions.
    • Invest in R&D for bio-based additives to meet evolving regulatory standards.
    • Expand distribution networks to capitalize on emerging markets in Eastern Europe.

    By 2035, the market is expected to achieve robust growth, positioning itself as a leader in sustainable fuel solutions.

    Market Segmentation

    Biodiesel Fuel Additive Source Outlook

    • Rapessed Oil/Canola Oil
    • Soybean Oil
    • Sunflower Oil
    • Palm Oil
    • Used Kitchen Oil Ester
    • Animal Fat
    • Others

    Biodiesel Fuel Additive Type Outlook

    • Antioxidants
    • Cold Flow Improvers
    • Octane & Cetane Improvers
    • Biocides
    • Dispersants
    • Others

    Biodiesel Fuel Additive Regional Outlook

    • Europe
    • Germany
    • France
    • UK
    • Italy
    • Spain
    • Rest of Europe

    Biodiesel Fuel Additive End-Use Outlook

    • Transportation
    • Power Generation
    • Industrial
    • Others

    Report Scope

    Report Attribute/Metric Details  
    Market Size 2024 USD 4.83 Billion
    Market Size 2025 USD 5.45 Billion
    Market Size 2035 18.17 (Value (USD Billion))
    Compound Annual Growth Rate (CAGR) 12.80% (2025 - 2035)
    Base Year 2024
    Market Forecast Period 2025 - 2035
    Historical Data 2020- 2024
    Market Forecast Units Value (USD Billion)
    Report Coverage Revenue Forecast, Market Competitive Landscape, Growth Factors, and Trends
    Segments Covered Source, Type, End-Use, and Region
    Region Covered Europe
    Countries Covered German, France, UK, Italy, Spain
    Key Companies Profiled Fuel Quality Services, Inc. (FQS), Chemiphase Ltd, CLARIANT AG, E-ZOIL, Eastman Chemical Company, The Lubrizol Corporation, Afton Chemical Corporation, EVONIK INDUSTRIES AG, Chevron Oronite Company LLC, Biofuel Systems Group Ltd., TotalEnergies, NALCO, Infineum International Ltd., Innospec Inc., Renewable Oil International, Kemin Industries Inc., Lubrizol Corporation, PMC Biogenix Inc., Power Service Products Inc., and Vanderbilt Chemicals, LLC
    Key Market Opportunities Growing environmental concerns are fueling market expansion
    Key Market Dynamics Rising demand from automotive and aerospace sector

    FAQs

    How much is the biodiesel fuel additive market?

    The Europe Biodiesel Fuel Additive market size was valued at USD 4.83 Billion in 2024.

    What is the growth rate of the biodiesel fuel additive market?

    Europe Biodiesel Fuel Additive Market is expected to grow with a CAGR of 12.8% in the period 2025-2035

    Who are the key players in the biodiesel fuel additive market?

    The key players in the market are Fuel Quality Services, Inc. (FQS), Chemiphase Ltd, CLARIANT AG, E-ZOIL, Eastman Chemical Company, The Lubrizol Corporation, Afton Chemical Corporation, EVONIK INDUSTRIES AG, Chevron Oronite Company LLC, Biofuel Systems Group Ltd., TotalEnergies, NALCO, Infineum International Ltd., Innospec Inc., Renewable Oil International, Kemin Industries Inc., Lubrizol Corporation, PMC Biogenix Inc., Power Service Products Inc., and Vanderbilt Chemicals, LLC.

    Which source led the biodiesel fuel additive market?

    The rapessed oil/canola oil category dominated the market in 2024.

    Which end-use had the largest market share in the biodiesel fuel additive market?

    The power generation category had the largest share in the market.

    1. MARKET DYNAMICS
      1. \r\n4.1. Overview
      2. \r\n4.2. Drivers
      3. \r\n4.3. Restraints
      4. \r\n4.4.
      5. Opportunities
      6. \r\n5. MARKET FACTOR ANALYSIS
      7. \r\n5.1. Value Chain Analysis
      8. \r\n5.2.
      9. Porter’s Five Forces Analysis
      10. \r\n5.2.1. Bargaining Power of Suppliers
      11. \r\n5.2.2.
      12. Bargaining Power of Buyers
      13. \r\n5.2.3. Threat of New Entrants
      14. \r\n5.2.4.
      15. Threat of Substitutes
      16. \r\n5.2.5. Intensity of Rivalry
      17. \r\n5.3. COVID-19
      18. Impact Analysis
      19. \r\n5.3.1. Market Impact Analysis
      20. \r\n5.3.2. Regional
      21. Impact
      22. \r\n5.3.3. Opportunity and Threat Analysis
      23. \r\n6. EUROPE BIODIESEL
    2. FUEL ADDITIVE MARKET, BY SOURCE
      1. \r\n6.1. Overview
      2. \r\n6.2. Rapessed
      3. Oil/Canola Oil
      4. \r\n6.3. Soybean Oil
      5. \r\n6.4. Sunflower Oil
      6. \r\n6.5.
      7. Palm Oil
      8. \r\n6.6. Used Kitchen Oil Ester
      9. \r\n6.7. Animal Fat
      10. \r\n6.8.
      11. Others
    3. \r\n7. EUROPE BIODIESEL FUEL ADDITIVE MARKET, BY TYPE
      1. \r\n7.1.
      2. Overview
      3. \r\n7.2. Antioxidants
      4. \r\n7.3. Cold Flow Improvers
      5. \r\n7.4.
      6. Octane & Cetane Improvers
      7. \r\n7.5. Biocides
      8. \r\n7.6. Dispersants
      9. \r\n7.7.
      10. Others
    4. \r\n8. EUROPE BIODIESEL FUEL ADDITIVE MARKET, BY END-USE
      1. \r\n8.1.
      2. Overview
      3. \r\n8.2. Transportation
      4. \r\n8.3. Power Generation
      5. \r\n8.4.
      6. Industrial
      7. \r\n8.5. Others
      8. \r\n9. EUROPE BIODIESEL FUEL ADDITIVE MARKET,
      9. BY REGION
      10. \r\n9.1. Overview
      11. \r\n9.2. Europe
      12. \r\n9.2.1. Germany
      13. \r\n9.2.2.
      14. France
      15. \r\n9.2.3. UK
      16. \r\n9.2.4. Italy
      17. \r\n9.2.5. Spain
      18. \r\n9.2.6.
      19. Rest of Europe
      20. \r\n10. COMPETITIVE LANDSCAPE
      21. \r\n10.1. Overview
      22. \r\n10.2.
      23. Competitive Analysis
      24. \r\n10.3. Market Share Analysis
      25. \r\n10.4. Major
      26. Growth Strategy in the Europe Biodiesel Fuel Additive Market,
      27. \r\n10.5. Competitive
      28. Benchmarking
      29. \r\n10.6. Leading Players in Terms of Number of Developments
      30. in the Europe Biodiesel Fuel Additive Market,
      31. \r\n10.7. Key developments and
      32. Growth Strategies
      33. \r\n10.7.1. New Product Launch/Service Deployment
      34. \r\n10.7.2.
      35. Merger & Acquisitions
      36. \r\n10.7.3. Joint Ventures
      37. \r\n10.8. Major
      38. Players Financial Matrix
      39. \r\n10.8.1. Sales & Operating Income, 2022
      40. \r\n10.8.2.
      41. Major Players R&D Expenditure. 2022
      42. \r\n11. COMPANY PROFILES
      43. \r\n11.1.
      44. Fuel Quality Services, Inc. (FQS)
      45. \r\n11.1.1. Company Overview
      46. \r\n11.1.2.
      47. Financial Overview
      48. \r\n11.1.3. Products Offered
      49. \r\n11.1.4. Key Developments
      50. \r\n11.1.5.
      51. SWOT Analysis
      52. \r\n11.1.6. Key Strategies
      53. \r\n11.2. CHEMIPHASE LTD
      54. \r\n11.2.1.
      55. Company Overview
      56. \r\n11.2.2. Financial Overview
      57. \r\n11.2.3. Products
      58. Offered
      59. \r\n11.2.4. Key Developments
      60. \r\n11.2.5. SWOT Analysis
      61. \r\n11.2.6.
      62. Key Strategies
      63. \r\n11.3. CLARIANT AG
      64. \r\n11.3.1. Company Overview
      65. \r\n11.3.2.
      66. Financial Overview
      67. \r\n11.3.3. Products Offered
      68. \r\n11.3.4. Key Developments
      69. \r\n11.3.5.
      70. SWOT Analysis
      71. \r\n11.3.6. Key Strategies
      72. \r\n11.4. E-ZOIL
      73. \r\n11.4.1.
      74. Company Overview
      75. \r\n11.4.2. Financial Overview
      76. \r\n11.4.3. Products
      77. Offered
      78. \r\n11.4.4. Key Developments
      79. \r\n11.4.5. SWOT Analysis
      80. \r\n11.4.6.
      81. Key Strategies
      82. \r\n11.5. Eastman Chemical Company
      83. \r\n11.5.1. Company
      84. Overview
      85. \r\n11.5.2. Financial Overview
      86. \r\n11.5.3. Products Offered
      87. \r\n11.5.4.
      88. Key Developments
      89. \r\n11.5.5. SWOT Analysis
      90. \r\n11.5.6. Key Strategies
      91. \r\n11.6.
      92. The Lubrizol Corporation
      93. \r\n11.6.1. Company Overview
      94. \r\n11.6.2. Financial
      95. Overview
      96. \r\n11.6.3. Products Offered
      97. \r\n11.6.4. Key Developments
      98. \r\n11.6.5.
      99. SWOT Analysis
      100. \r\n11.6.6. Key Strategies
      101. \r\n11.7. Afton Chemical Corporation
      102. \r\n11.7.1.
      103. Company Overview
      104. \r\n11.7.2. Financial Overview
      105. \r\n11.7.3. Products
      106. Offered
      107. \r\n11.7.4. Key Developments
      108. \r\n11.7.5. SWOT Analysis
      109. \r\n11.7.6.
      110. Key Strategies
      111. \r\n11.8. EVONIK INDUSTRIES AG
      112. \r\n11.8.1. Company Overview
      113. \r\n11.8.2.
      114. Financial Overview
      115. \r\n11.8.3. Products Offered
      116. \r\n11.8.4. Key Developments
      117. \r\n11.8.5.
      118. SWOT Analysis
      119. \r\n11.8.6. Key Strategies
      120. \r\n11.9. Chevron Oronite Company
      121. LLC
      122. \r\n11.9.1. Company Overview
      123. \r\n11.9.2. Financial Overview
      124. \r\n11.9.3.
      125. Products Offered
      126. \r\n11.9.4. Key Developments
      127. \r\n11.9.5. SWOT Analysis
      128. \r\n11.9.6.
      129. Key Strategies
      130. \r\n11.10. Biofuel Systems Group Ltd.
      131. \r\n11.10.1. Company
      132. Overview
      133. \r\n11.10.2. Financial Overview
      134. \r\n11.10.3. Products Offered
      135. \r\n11.10.4.
      136. Key Developments
      137. \r\n11.10.5. SWOT Analysis
      138. \r\n11.10.6. Key Strategies
      139. \r\n11.11.
      140. TotalEnergies
      141. \r\n11.11.1. Company Overview
      142. \r\n11.11.2. Financial Overview
      143. \r\n11.11.3.
      144. Products Offered
      145. \r\n11.11.4. Key Developments
      146. \r\n11.11.5. SWOT Analysis
      147. \r\n11.11.6.
      148. Key Strategies
      149. \r\n11.12. NALCO
      150. \r\n11.12.1. Company Overview
      151. \r\n11.12.2.
      152. Financial Overview
      153. \r\n11.12.3. Products Offered
      154. \r\n11.12.4. Key Developments
      155. \r\n11.12.5.
      156. SWOT Analysis
      157. \r\n11.12.6. Key Strategies
      158. \r\n11.13. Infineum International
      159. Ltd.
      160. \r\n11.13.1. Company Overview
      161. \r\n11.13.2. Financial Overview
      162. \r\n11.13.3.
      163. Products Offered
      164. \r\n11.13.4. Key Developments
      165. \r\n11.13.5. SWOT Analysis
      166. \r\n11.13.6.
      167. Key Strategies
      168. \r\n11.14. Innospec Inc.
      169. \r\n11.14.1. Company Overview
      170. \r\n11.14.2.
      171. Financial Overview
      172. \r\n11.14.3. Products Offered
      173. \r\n11.14.4. Key Developments
      174. \r\n11.14.5.
      175. SWOT Analysis
      176. \r\n11.14.6. Key Strategies
      177. \r\n11.15. Renewable Oil International
      178. \r\n11.15.1.
      179. Company Overview
      180. \r\n11.15.2. Financial Overview
      181. \r\n11.15.3. Products
      182. Offered
      183. \r\n11.15.4. Key Developments
      184. \r\n11.15.5. SWOT Analysis
      185. \r\n11.15.6.
      186. Key Strategies
      187. \r\n11.16. Kemin Industries Inc.
      188. \r\n11.16.1. Company
      189. Overview
      190. \r\n11.16.2. Financial Overview
      191. \r\n11.16.3. Products Offered
      192. \r\n11.16.4.
      193. Key Developments
      194. \r\n11.16.5. SWOT Analysis
      195. \r\n11.16.6. Key Strategies
      196. \r\n11.17.
      197. Lubrizol Corporation
      198. \r\n11.17.1. Company Overview
      199. \r\n11.17.2. Financial
      200. Overview
      201. \r\n11.17.3. Products Offered
      202. \r\n11.17.4. Key Developments
      203. \r\n11.17.5.
      204. SWOT Analysis
      205. \r\n11.17.6. Key Strategies
      206. \r\n11.18. PMC Biogenix Inc.
      207. \r\n11.18.1.
      208. Company Overview
      209. \r\n11.18.2. Financial Overview
      210. \r\n11.18.3. Products
      211. Offered
      212. \r\n11.18.4. Key Developments
      213. \r\n11.18.5. SWOT Analysis
      214. \r\n11.18.6.
      215. Key Strategies
      216. \r\n11.19. Power Service Products Inc.
      217. \r\n11.19.1. Company
      218. Overview
      219. \r\n11.19.2. Financial Overview
      220. \r\n11.19.3. Products Offered
      221. \r\n11.19.4.
      222. Key Developments
      223. \r\n11.19.5. SWOT Analysis
      224. \r\n11.19.6. Key Strategies
      225. \r\n11.20.
      226. VANDERBILT CHEMICALS, LLC
      227. \r\n11.20.1. Company Overview
      228. \r\n11.20.2.
      229. Financial Overview
      230. \r\n11.20.3. Products Offered
      231. \r\n11.20.4. Key Developments
      232. \r\n11.20.5.
      233. SWOT Analysis
      234. \r\n11.20.6. Key Strategies
      235. \r\n12. APPENDIX
      236. \r\n12.1.
      237. References
      238. \r\n12.2. Related Reports
      239. \r\n 
      240. \r\nLIST OF TABLES
      241. \r\nTABLE
    5. EUROPE BIODIESEL FUEL ADDITIVE MARKET, SYNOPSIS, 2025 - 2034
      1. \r\nTABLE 2
      2. EUROPE BIODIESEL FUEL ADDITIVE MARKET, ESTIMATES & FORECAST, 2025 - 2034 (USD
      3. BILLION)
    6. \r\nTABLE 3 EUROPE BIODIESEL FUEL ADDITIVE MARKET, BY SOURCE, 2025
      1. - 2034 (USD BILLION)
      2. \r\nTABLE 4 EUROPE BIODIESEL FUEL ADDITIVE MARKET, BY
      3. TYPE, 2025 - 2034 (USD BILLION)
      4. \r\nTABLE 5 EUROPE BIODIESEL FUEL ADDITIVE
    7. MARKET, BY END-USE, 2025 - 2034 (USD BILLION)
      1. \r\nTABLE 1 GERMANY: BIODIESEL
    8. FUEL ADDITIVE MARKET, BY SOURCE, 2025 - 2034 (USD BILLION)
      1. \r\nTABLE 2 GERMANY:
    9. BIODIESEL FUEL ADDITIVE MARKET, BY TYPE, 2025 - 2034 (USD BILLION)
      1. \r\nTABLE
    10. GERMANY: BIODIESEL FUEL ADDITIVE MARKET, BY END-USE, 2025 - 2034 (USD BILLION)
      1. \r\nTABLE
    11. FRANCE: BIODIESEL FUEL ADDITIVE MARKET, BY SOURCE, 2025 - 2034 (USD BILLION)
      1. \r\nTABLE
    12. FRANCE: BIODIESEL FUEL ADDITIVE MARKET, BY TYPE, 2025 - 2034 (USD BILLION)
      1. \r\nTABLE
    13. FRANCE: BIODIESEL FUEL ADDITIVE MARKET, BY END-USE, 2025 - 2034 (USD BILLION)
      1. \r\nTABLE
    14. ITALY: BIODIESEL FUEL ADDITIVE MARKET, BY SOURCE, 2025 - 2034 (USD BILLION)
      1. \r\nTABLE
    15. ITALY: BIODIESEL FUEL ADDITIVE MARKET, BY TYPE, 2025 - 2034 (USD BILLION)
      1. \r\nTABLE
    16. ITALY: BIODIESEL FUEL ADDITIVE MARKET, BY END-USE, 2025 - 2034 (USD BILLION)
      1. \r\nTABLE
    17. SPAIN: BIODIESEL FUEL ADDITIVE MARKET, BY SOURCE, 2025 - 2034 (USD BILLION)
      1. \r\nTABLE
    18. SPAIN: BIODIESEL FUEL ADDITIVE MARKET, BY TYPE, 2025 - 2034 (USD BILLION)
      1. \r\nTABLE
    19. SPAIN: BIODIESEL FUEL ADDITIVE MARKET, BY END-USE, 2025 - 2034 (USD BILLION)
      1. \r\nTABLE
    20. UK: BIODIESEL FUEL ADDITIVE MARKET, BY SOURCE, 2025 - 2034 (USD BILLION)
      1. \r\nTABLE
    21. UK: BIODIESEL FUEL ADDITIVE MARKET, BY TYPE, 2025 - 2034 (USD BILLION)
      1. \r\nTABLE
    22. UK: BIODIESEL FUEL ADDITIVE MARKET, BY END-USE, 2025 - 2034 (USD BILLION)
      1. \r\nTABLE
    23. REST OF EUROPE: BIODIESEL FUEL ADDITIVE MARKET, BY SOURCE, 2025 - 2034 (USD BILLION)
      1. \r\nTABLE
    24. REST OF EUROPE: BIODIESEL FUEL ADDITIVE MARKET, BY TYPE, 2025 - 2034 (USD BILLION)
      1. \r\nTABLE
    25. REST OF EUROPE: BIODIESEL FUEL ADDITIVE MARKET, BY END-USE, 2025 - 2034 (USD
      1. BILLION)
      2. \r\nLIST OF FIGURES
      3. \r\nFIGURE 1 RESEARCH PROCESS
      4. \r\nFIGURE
    26. MARKET STRUCTURE FOR THE EUROPE BIODIESEL FUEL ADDITIVE MARKET
      1. \r\nFIGURE
    27. MARKET DYNAMICS FOR THE EUROPE BIODIESEL FUEL ADDITIVE MARKET
      1. \r\nFIGURE
    28. EUROPE BIODIESEL FUEL ADDITIVE MARKET, SHARE (%), BY SOURCE, 2021
      1. \r\nFIGURE
    29. EUROPE BIODIESEL FUEL ADDITIVE MARKET, SHARE (%), BY TYPE, 2021
      1. \r\nFIGURE
    30. EUROPE BIODIESEL FUEL ADDITIVE MARKET, SHARE (%), BY END-USE, 2021
      1. \r\nFIGURE
    31. EUROPE BIODIESEL FUEL ADDITIVE MARKET, SHARE (%), BY REGION, 2021
      1. \r\nFIGURE
    32. EUROPE BIODIESEL FUEL ADDITIVE MARKET: COMPANY SHARE ANALYSIS, 2021 (%)
      1. \r\nFIGURE
    33. FUEL QUALITY SERVICES, INC. (FQS): FINANCIAL OVERVIEW SNAPSHOT
      1. \r\nFIGURE
    34. FUEL QUALITY SERVICES, INC. (FQS): SWOT ANALYSIS
      1. \r\nFIGURE 11 CHEMIPHASE
      2. LTD: FINANCIAL OVERVIEW SNAPSHOT
      3. \r\nFIGURE 12 CHEMIPHASE LTD: SWOT ANALYSIS
      4. \r\nFIGURE
    35. CLARIANT AG: FINANCIAL OVERVIEW SNAPSHOT
      1. \r\nFIGURE 14 CLARIANT AG: SWOT
      2. ANALYSIS
      3. \r\nFIGURE 15 E-ZOIL: FINANCIAL OVERVIEW SNAPSHOT
      4. \r\nFIGURE
    36. E-ZOIL: SWOT ANALYSIS
      1. \r\nFIGURE 17 EASTMAN CHEMICAL COMPANY: FINANCIAL
      2. OVERVIEW SNAPSHOT
      3. \r\nFIGURE 18 EASTMAN CHEMICAL COMPANY: SWOT ANALYSIS
      4. \r\nFIGURE
    37. THE LUBRIZOL CORPORATION: FINANCIAL OVERVIEW SNAPSHOT
      1. \r\nFIGURE 20 THE
      2. LUBRIZOL CORPORATION: SWOT ANALYSIS
      3. \r\nFIGURE 21 AFTON CHEMICAL CORPORATION:
      4. FINANCIAL OVERVIEW SNAPSHOT
      5. \r\nFIGURE 22 AFTON CHEMICAL CORPORATION: SWOT
      6. ANALYSIS
      7. \r\nFIGURE 23 EVONIK INDUSTRIES AG: FINANCIAL OVERVIEW SNAPSHOT
      8. \r\nFIGURE
    38. EVONIK INDUSTRIES AG: SWOT ANALYSIS
      1. \r\nFIGURE 25 CHEVRON ORONITE COMPANY
      2. LLC: FINANCIAL OVERVIEW SNAPSHOT
      3. \r\nFIGURE 26 CHEVRON ORONITE COMPANY LLC:
    39. SWOT ANALYSIS
      1. \r\nFIGURE 27 BIOFUEL SYSTEMS GROUP LTD.,: FINANCIAL OVERVIEW
      2. SNAPSHOT
      3. \r\nFIGURE 28 BIOFUEL SYSTEMS GROUP LTD.,: SWOT ANALYSIS
      4. \r\nFIGURE
    40. TOTALENERGIES: FINANCIAL OVERVIEW SNAPSHOT
      1. \r\nFIGURE 30 TOTALENERGIES:
    41. SWOT ANALYSIS
      1. \r\nFIGURE 31 NALCO: FINANCIAL OVERVIEW SNAPSHOT
      2. \r\nFIGURE
    42. NALCO: SWOT ANALYSIS
      1. \r\nFIGURE 33 INFINEUM INTERNATIONAL LTD.: FINANCIAL
      2. OVERVIEW SNAPSHOT
      3. \r\nFIGURE 34 INFINEUM INTERNATIONAL LTD.: SWOT ANALYSIS
      4. \r\nFIGURE
    43. INNOSPEC INC.: FINANCIAL OVERVIEW SNAPSHOT
      1. \r\nFIGURE 36 INNOSPEC INC.:
    44. SWOT ANALYSIS
      1. \r\nFIGURE 37 RENEWABLE OIL INTERNATIONAL: FINANCIAL OVERVIEW
      2. SNAPSHOT
      3. \r\nFIGURE 38 RENEWABLE OIL INTERNATIONAL: SWOT ANALYSIS
      4. \r\nFIGURE
    45. KEMIN INDUSTRIES INC.: FINANCIAL OVERVIEW SNAPSHOT
      1. \r\nFIGURE 40 KEMIN
      2. INDUSTRIES INC.: SWOT ANALYSIS
      3. \r\nFIGURE 41 LUBRIZOL CORPORATION: FINANCIAL
      4. OVERVIEW SNAPSHOT
      5. \r\nFIGURE 42 LUBRIZOL CORPORATION: SWOT ANALYSIS
      6. \r\nFIGURE
    46. PMC BIOGENIX INC.: FINANCIAL OVERVIEW SNAPSHOT
      1. \r\nFIGURE 44 PMC BIOGENIX
      2. INC.: SWOT ANALYSIS
      3. \r\nFIGURE 45 POWER SERVICE PRODUCTS INC.: FINANCIAL OVERVIEW
      4. SNAPSHOT
      5. \r\nFIGURE 46 POWER SERVICE PRODUCTS INC.: SWOT ANALYSIS
      6. \r\nFIGURE
    47. VANDERBILT CHEMICALS, LLC: FINANCIAL OVERVIEW SNAPSHOT
      1. \r\nFIGURE 48 VANDERBILT
      2. CHEMICALS, LLC: SWOT ANALYSIS

    Europe Biodiesel Fuel Additive Market Segmentation

    Market Segmentation Overview

    • Detailed segmentation data will be available in the full report
    • Comprehensive analysis by multiple parameters
    • Regional and country-level breakdowns
    • Market size forecasts by segment
    Infographic

    Free Sample Request

    Kindly complete the form below to receive a free sample of this Report

    Get Free Sample

    Customer Strories

    “I am very pleased with how market segments have been defined in a relevant way for my purposes (such as "Portable Freezers & refrigerators" and "last-mile"). In general the report is well structured. Thanks very much for your efforts.”

    Victoria Milne

    Founder
    Case Study
    Chemicals and Materials

    Compare Licence

    ×
    Features License Type
    Single User Multiuser License Enterprise User
    Price $4,950 $5,950 $7,250
    Maximum User Access Limit 1 User Upto 10 Users Unrestricted Access Throughout the Organization
    Free Customization
    Direct Access to Analyst
    Deliverable Format
    Platform Access
    Discount on Next Purchase 10% 15% 15%
    Printable Versions