×
  • Cat-intel
  • MedIntelliX
  • Resources
  • About Us
  • Hero Background
    English
    Chinese
    French
    Japanese
    Korean
    German
    Spanish

    Dermatoscopes Market Trends

    ID: MRFR/HC/10637-HCR
    128 Pages
    Rahul Gotadki
    October 2025

    Dermatoscopes Market Research Report Information By Product (Contact Dermatoscope, Hybrid Dermatoscope and Noncontact Dermatoscope), By Technology (LED, Xenon, Halogen, and Ultraviolet), By Modality (Handheld, Trolley Mounted, and Headband), By End-use (Dermatology Clinics, and Hospital) And By Region (North America, Europe, Asia-Pacific, And Rest Of The World) –Market Forecast Till 2035

    Share:
    Download PDF ×

    We do not share your information with anyone. However, we may send you emails based on your report interest from time to time. You may contact us at any time to opt-out.

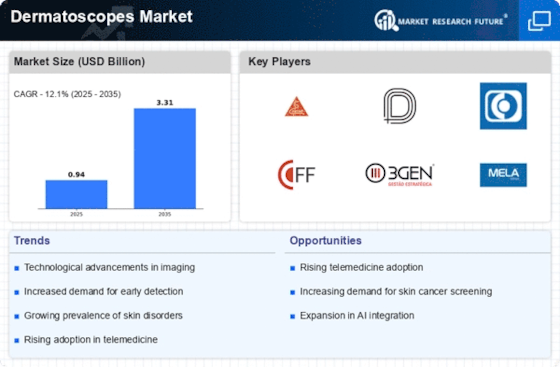
    Dermatoscopes Market Infographic
    Purchase Options

    Market Trends

    Key Emerging Trends in the Dermatoscopes Market

    In the Dermatoscopes Market, there have been significant developments such as advancements in dermatological diagnostics, a growing focus on early skin cancer detection and technology integration into dermatology practices. Dermatoscopes are devices that help dermatologists and medical experts in magnifying skin lesions for early detection of skin cancers and other dermatologic problems. Among recent trends that impacted the Dermatoscopes Market significantly include teledermatology, personalized care and improved diagnostic accuracy.

    One major trend in the Dermatoscopes Market is the adoption of digital dermatoscopy technologies. Traditional dermatoscopes have evolved into digital or electronic dermatoscopes with ability to capture and store high resolution images or videos of skin lesions. These digital capabilities enhance documentation of changes in skin over time thus enabling better monitoring and analysis. The transition towards digital dermatoscopy also aligns with a general tendency to integrate digital health technologies into medical practice for more accurate diagnosis that improves patient outcomes.

    Dermatoscopic imaging has witnessed technological advancements that are stimulating innovation within the market for Dermatoscopes. Such advances include polarized light sources, non-polarized lighting sources, cross-polarization filters designed to improve visualization of dermal structures leading to increased levels of diagnostic accuracy. Another emerging trend is artificial intelligence (AI) as well as machine learning algorithms being incorporated in dermatoscopy. This technology assists health professionals in analysing dermoscopical images by providing automated lesion recognition and risk assessment. Ultimately, AI aims to increase the efficiency and accuracy with which physicians detect malignant pigmented melanocytic neoplasms.

    Handheld or portable forms of Dermatoscopes are becoming increasingly common in the industry today. This mobility augments flexibility in clinical settings thereby making it possible to operate even from remote locations such as those without any other form of healthcare facility nearby apart from primary care clinics &dermatology offices themselves On-site examination using handheld dermoscopical tools enables physicians to conduct quick and practical skin checks for early detection of cancerous structures. This is consistent with the broader trend towards portable dermatoscopy driven by a growing emphasis on prevention and early detection as means of improving patient prognosis.

    Teledermatology has emerged as one of the leading trends influencing the Dermatoscopes Market today. The ability to remotely capture and transmit dermatoscopic images for expert evaluation expands access to dermatological expertise, especially in regions with limited access to dermatologists. Teledermatology applications enable healthcare providers to share dermatoscopic images securely, allowing for remote consultations and enhancing collaborative efforts among healthcare professionals. This trend emphasizes the importance ofdermatoscopy in supporting telemedicine initiatives thus opening up specialized dermatology care for larger populations.

    Additionally, there has been an increase in adoption of dermoscopy by non-dermatology specialists such as general practitioners (GPs) or internists working in primary care setting due its ease of use and effectiveness in preliminary assessment of skin conditions. For instance, GPs can identify suspicious lesions earlier than their patients would have done themselves, thus making appropriate referrals sooner than later. This trend indicates that various medical fields are becoming aware about skin cancer screening and that they are now embracing dermatoscopy as an important diagnostic tool outside the field of dermatology itself.

    Collaborations between manufacturers Dermatoscope manufacturers partnering with health institutions drive research and development activities within this market. These collaborations foster innovative creation of new imaging technologies that include enhanced diagnostic features, user-friendly interfaces among others. Such partnerships between industry players and healthcare providers promote continuous improvements and customization towards better meeting ever-changing requirements from diagnosis in clinical practice.

    However, the market for dermatoscopes is not without its share of problems. These include the absence of a uniform approach to teaching dermoscopy, regulatory frameworks and the expensive nature of advanced dermatoscopic technologies. In answer to these challenges, training programs have been initiated, with ongoing research being conducted to establish evidence-based practice and efforts made towards making the devices more affordable and accessible.

    Author
    Rahul Gotadki
    Assistant Manager

    He holds an experience of about 7+ years in Market Research and Business Consulting, working under the spectrum of Life Sciences and Healthcare domains. Rahul conceptualizes and implements a scalable business strategy and provides strategic leadership to the clients. His expertise lies in market estimation, competitive intelligence, pipeline analysis, customer assessment, etc. In addition to the above, his other responsibility includes strategic tracking of high growth markets & advising clients on the potential areas of focus they could direct their business initiatives

    Leave a Comment

    FAQs

    What is the projected market valuation of the Dermatoscopes Market by 2035?

    The Dermatoscopes Market is projected to reach a valuation of 3.309 USD Billion by 2035.

    What was the market valuation of the Dermatoscopes Market in 2024?

    In 2024, the Dermatoscopes Market was valued at 0.9417 USD Billion.

    What is the expected CAGR for the Dermatoscopes Market during the forecast period 2025 - 2035?

    The expected CAGR for the Dermatoscopes Market during the forecast period 2025 - 2035 is 12.1%.

    Which product segment is anticipated to have the highest valuation by 2035?

    The Contact Dermatoscope segment is anticipated to reach a valuation of 1.3295 USD Billion by 2035.

    What are the leading companies in the Dermatoscopes Market?

    Key players in the Dermatoscopes Market include Heine Optotechnik GmbH, Dermlite, and Canfield Scientific, Inc.

    How does the Handheld modality segment perform in terms of market valuation?

    The Handheld modality segment was valued at 0.47 USD Billion in 2024 and is expected to grow to 1.65 USD Billion by 2035.

    Market Summary

    As per MRFR analysis, the Dermatoscopes Market Size was estimated at 0.9417 USD Billion in 2024. The Dermatoscopes industry is projected to grow from 1.056 USD Billion in 2025 to 3.309 USD Billion by 2035, exhibiting a compound annual growth rate (CAGR) of 12.1 during the forecast period 2025 - 2035.

    Key Market Trends & Highlights

    The Dermatoscopes Market is poised for substantial growth driven by technological advancements and increasing demand for early detection.

    • North America remains the largest market for dermatoscopes, reflecting a strong emphasis on advanced dermatological practices.
    • The Asia-Pacific region is emerging as the fastest-growing market, fueled by rising healthcare investments and awareness of skin health.
    • Contact dermatoscopes dominate the market, while hybrid dermatoscopes are rapidly gaining traction due to their innovative features.
    • Technological advancements and the rising demand for early detection are key drivers propelling market growth.

    Market Size & Forecast

    2024 Market Size 0.9417 (USD Billion)
    2035 Market Size 3.309 (USD Billion)
    CAGR (2025 - 2035) 12.1%
    Largest Regional Market Share in 2024 North America

    Major Players

    <p>Heine Optotechnik GmbH (DE), Dermlite (AU), Canfield Scientific, Inc. (US), FotoFinder Systems GmbH (DE), 3Gen (US), Mela Sciences, Inc. (US), Nikon Corporation (JP), Welch Allyn (US)</p>

    Market Trends

    The Dermatoscopes Market is currently experiencing a notable evolution, driven by advancements in technology and an increasing emphasis on early skin cancer detection. The integration of digital imaging and artificial intelligence into dermatoscopes enhances diagnostic accuracy, allowing healthcare professionals to make more informed decisions. This trend appears to be fostering a greater acceptance of dermatoscopes among dermatologists and general practitioners alike, as they seek to improve patient outcomes through precise assessments. Furthermore, the growing awareness of skin health and the rising incidence of skin disorders are likely contributing to the heightened demand for these devices. In addition, the Dermatoscopes Market is witnessing a shift towards portable and user-friendly designs, catering to the needs of practitioners who require mobility and ease of use in various clinical settings. This trend suggests that manufacturers are focusing on creating devices that not only deliver high-quality imaging but also offer convenience for healthcare providers. As the market continues to evolve, it seems poised for further growth, driven by innovation and a commitment to enhancing dermatological care.

    Technological Advancements

    The Dermatoscopes Market is increasingly influenced by technological innovations, particularly in digital imaging and artificial intelligence. These advancements enhance diagnostic capabilities, allowing for more accurate assessments of skin conditions.

    Rising Demand for Early Detection

    There is a growing emphasis on early detection of skin cancers and other dermatological issues, which is likely driving the demand for dermatoscopes. Healthcare providers are increasingly recognizing the importance of these tools in improving patient outcomes.

    Shift Towards Portability

    The market is experiencing a trend towards more portable and user-friendly dermatoscopes. This shift caters to the needs of practitioners who require mobility and ease of use, indicating a focus on convenience in clinical settings.

    Dermatoscopes Market Market Drivers

    Shift Towards Portability in Dermatoscopes Market

    The trend towards portability is reshaping the Dermatoscopes Market, as healthcare professionals increasingly seek lightweight and compact devices. Portable dermatoscopes enable dermatologists to conduct examinations in various settings, including clinics, hospitals, and even at home. This flexibility is particularly beneficial in enhancing patient access to dermatological care. The market is witnessing a rise in demand for handheld dermatoscopes, which are equipped with advanced features such as wireless connectivity and high-definition imaging. This shift is expected to contribute to a market growth rate of around 8% annually, as practitioners recognize the value of mobility in their diagnostic processes. Consequently, the Dermatoscopes Market is adapting to meet these evolving needs.

    Technological Advancements in Dermatoscopes Market

    The Dermatoscopes Market is experiencing a notable transformation due to rapid technological advancements. Innovations such as digital dermatoscopes, which integrate high-resolution imaging and artificial intelligence, are enhancing diagnostic accuracy. These devices allow for real-time analysis and improved visualization of skin lesions, which is crucial for early detection of skin cancers. The market is projected to grow at a compound annual growth rate of approximately 10% over the next five years, driven by these advancements. Furthermore, the integration of teledermatology solutions is expanding access to dermatological care, particularly in remote areas. This trend indicates a shift towards more efficient and effective patient management, thereby propelling the Dermatoscopes Market forward.

    Growing Awareness of Skin Health in Dermatoscopes Market

    The rising awareness of skin health among the general population is a pivotal driver for the Dermatoscopes Market. Educational campaigns and initiatives aimed at promoting skin cancer awareness are encouraging individuals to seek regular skin examinations. This cultural shift is fostering a greater acceptance of dermatological consultations, leading to increased utilization of dermatoscopes in clinical practice. Market analysis indicates that as more people become proactive about their skin health, the demand for dermatoscopes is likely to rise. This trend not only supports the growth of the Dermatoscopes Market but also emphasizes the importance of early detection and preventive care in dermatology.

    Rising Demand for Early Detection in Dermatoscopes Market

    The increasing awareness regarding skin cancer and other dermatological conditions is driving the demand for early detection tools within the Dermatoscopes Market. As skin cancer rates continue to rise, healthcare providers are prioritizing early diagnosis to improve patient outcomes. This has led to a surge in the adoption of dermatoscopes, which facilitate thorough examinations of skin lesions. Market data suggests that the demand for dermatoscopes is expected to rise significantly, with a projected market value reaching over 500 million USD by 2026. This growing emphasis on preventive healthcare is likely to further stimulate innovation and investment in the Dermatoscopes Market, as stakeholders seek to enhance diagnostic capabilities.

    Increasing Investment in Dermatology Research within Dermatoscopes Market

    Investment in dermatology research is on the rise, significantly impacting the Dermatoscopes Market. As research institutions and pharmaceutical companies allocate more resources towards understanding skin diseases, the demand for advanced diagnostic tools, including dermatoscopes, is likely to increase. This trend is evidenced by the growing number of clinical trials focused on skin conditions, which often require precise diagnostic equipment. The Dermatoscopes Market stands to benefit from these investments, as enhanced research capabilities lead to the development of more sophisticated dermatoscopes. Furthermore, collaborations between technology firms and research institutions are expected to yield innovative solutions, thereby driving market growth and expanding the scope of dermatological diagnostics.

    Market Segment Insights

    By Product: Contact Dermatoscope (Largest) vs. Hybrid Dermatoscope (Fastest-Growing)

    <p>In the Dermatoscopes Market, the distribution of market share is largely dominated by Contact Dermatoscopes, which hold the largest segment share due to their wide use in clinical settings for skin examinations. Hybrid Dermatoscopes follow as the fastest-growing segment, attracting attention for their versatility and advanced imaging capabilities. Noncontact Dermatoscopes, while essential, currently command a smaller share due to their niche applications and higher costs associated with devices designed for specialized uses.</p>

    <p>Product Types: Contact Dermatoscope (Dominant) vs. Hybrid Dermatoscope (Emerging)</p>

    <p>Contact Dermatoscopes are characterized by their straightforward operation and efficiency in providing detailed skin imaging, making them the preferred choice for many dermatologists. They facilitate quick assessments and have established a strong foothold in routine skin checking. In contrast, Hybrid Dermatoscopes are emerging as popular alternatives, due to their ability to combine various technologies, offering enhanced flexibility and functionality for diverse diagnostic needs. Both segments play crucial roles in improving patient outcomes, but Contact Dermatoscopes currently enjoy greater market acceptance while Hybrid options are rapidly gaining traction as new innovations enter the space.</p>

    By Technology: LED (Largest) vs. Xenon (Fastest-Growing)

    <p>In the Dermatoscopes Market, LED technology currently holds the largest market share, thanks to its energy efficiency, longevity, and superior illumination capabilities. In contrast, Xenon and Halogen technologies are also notable segments but are overshadowed by the versatility and performance of LED. While LED continues to dominate, Ultraviolent technology is carving out a niche with specific applications in dermatology.</p>

    <p>Technology: LED (Dominant) vs. Xenon (Emerging)</p>

    <p>LED dermatoscopes are recognized for their bright, focused light that aids in the clear visualization of skin lesions, making them the preferred choice among dermatologists. Their durability, low power consumption, and longer lifespan increase their popularity in various medical settings. Conversely, Xenon dermatoscopes, though emerging, offer powerful illumination with a high color rendering index. This makes them suitable for precise examinations that require enhanced visibility, appealing to professionals who prioritize light quality. As demand grows for advanced diagnostics in dermatology, both technologies are positioned to evolve further, indicating a competitive landscape characterized by innovation.</p>

    By Modality: Handheld (Largest) vs. Trolley Mounted (Fastest-Growing)

    <p>In the Dermatoscopes Market, the modality segment is characterized by distinct configurations including handheld, trolley mounted, and headband dermatoscopes. Handheld units currently dominate the market due to their portability and ease of use, accounting for a significant portion of the overall market share. Trolley mounted systems, while less prevalent, are witnessing a notable increase in adoption, primarily in clinical settings where stationary devices are favored for comprehensive examinations. The growth in the modality segment can be attributed to several factors. Handheld dermatoscopes are increasingly favored by dermatologists and general practitioners for their convenience and versatility. On the other hand, trolley mounted systems are gaining traction due to the rising demand for advanced diagnostic tools and improved patient management in hospitals and clinics. The trend towards minimally invasive procedures and the enhancement of telemedicine services is further driving the uptake of these modalities.</p>

    <p>Modality: Handheld (Dominant) vs. Trolley Mounted (Emerging)</p>

    <p>In the Dermatoscopes Market, handheld dermatoscopes represent the dominant modality, recognized for their portability and ability to meet the needs of a diverse range of medical professionals. These devices are favored for spot-checks in outpatient settings, making them essential tools for quick and efficient skin examinations. On the other hand, trolley mounted dermatoscopes, while emerging, are increasingly being integrated into clinical workflows. They offer advanced features such as enhanced imaging capabilities and the ability to accommodate multiple attachments for different procedures. This modality is preferred in specialized clinics and hospitals, where detailed analysis and prolonged use are essential. The contrasting characteristics of these modalities underline the evolving dynamics within the dermatoscopes market, highlighting the diverse needs of healthcare providers.</p>

    By End Use: Dermatology Clinics (Largest) vs. Hospitals (Fastest-Growing)

    <p>In the Dermatoscopes Market, dermatology clinics hold the largest market share due to their specialized focus on skin conditions and the rising number of skin disease diagnoses. Dermatology clinics are equipped with advanced dermatoscopes, enhancing the accuracy of diagnoses and facilitating detailed skin examinations. This specialized equipment is integral to the operational efficacy of these clinics, ensuring a significant share as they continue to grow in prominence within the healthcare sector. On the other hand, hospitals are emerging as the fastest-growing segment in the Dermatoscopes Market. The increasing prevalence of skin disorders and a heightened focus on dermatological care within hospitals are driving this growth. Hospitals are investing in advanced diagnostic technologies, including dermatoscopes, to improve patient outcomes and streamline operations. This trend signifies a shift in dermatological practices from specialist clinics to more inclusive hospital settings, resulting in a faster growth trajectory for hospitals.</p>

    <p>Dermatology Clinics: Dominant vs. Hospitals: Emerging</p>

    <p>Dermatology clinics represent the dominant force in the Dermatoscopes Market, characterized by their specialized approach to skincare and a strong focus on diagnosing dermatological issues. These clinics are well-equipped with high-quality dermatoscopes, enabling healthcare professionals to perform detailed examinations that are crucial for accurate diagnoses. Their concentrated expertise fosters patient trust and loyalty, often leading to repeated visits and referrals. In contrast, hospitals are becoming an emerging player in this market segment, driven by an increasing demand for comprehensive healthcare services. As more hospitals integrate dermatology departments, the utilization of dermatoscopes is on the rise. This trend is fueled by the need to address rising skin-related health issues across diverse patient populations, ultimately promoting growth in this segment.</p>

    Get more detailed insights about Dermatoscopes Market Research Report 2035

    Regional Insights

    North America : Leading Innovation and Demand

    North America is the largest market for dermatoscopes, holding approximately 45% of the global market share. The growth is driven by increasing skin cancer incidences, heightened awareness of dermatological health, and advancements in technology. Regulatory support from health authorities further catalyzes market expansion, with a focus on improving diagnostic accuracy and patient outcomes. The United States is the primary contributor, followed by Canada, with a competitive landscape featuring key players like Canfield Scientific, Inc. and Mela Sciences, Inc. The presence of advanced healthcare infrastructure and a strong emphasis on research and development bolster the market. Companies are increasingly investing in innovative solutions to enhance diagnostic capabilities, ensuring a dynamic competitive environment.

    Europe : Emerging Regulatory Frameworks

    Europe is the second-largest market for dermatoscopes, accounting for around 30% of the global share. The region's growth is fueled by rising skin cancer rates, increased healthcare expenditure, and a strong focus on preventive healthcare. Regulatory frameworks, such as the EU Medical Device Regulation, are enhancing product safety and efficacy, thereby driving market demand. Germany and the UK are the leading countries in this market, with significant contributions from France and Italy. The competitive landscape is characterized by established players like Heine Optotechnik GmbH and FotoFinder Systems GmbH. The presence of advanced healthcare systems and a growing number of dermatology clinics further support market growth, fostering innovation and collaboration among key stakeholders.

    Asia-Pacific : Rapidly Expanding Market Potential

    Asia-Pacific is witnessing rapid growth in the dermatoscope market, holding approximately 20% of the global share. The increasing prevalence of skin diseases, coupled with rising disposable incomes and healthcare investments, are key drivers of this growth. Countries like China and India are experiencing significant demand due to their large populations and improving healthcare infrastructure. China is the largest market in the region, followed by Japan and Australia. The competitive landscape is evolving, with both local and international players, including Dermlite and Nikon Corporation, striving to capture market share. The region's focus on enhancing dermatological services and increasing awareness of skin health is expected to further propel market growth, making it a key area for investment and innovation.

    Middle East and Africa : Untapped Market Opportunities

    The Middle East and Africa represent an emerging market for dermatoscopes, holding about 5% of the global share. The growth is driven by increasing awareness of skin health, rising incidences of skin disorders, and improvements in healthcare infrastructure. Regulatory initiatives aimed at enhancing healthcare quality are also contributing to market expansion, albeit at a slower pace compared to other regions. Countries like South Africa and the UAE are leading the market, with a growing number of dermatology clinics and healthcare facilities. The competitive landscape is characterized by a mix of local and international players, with opportunities for growth as healthcare systems continue to evolve. Investment in training and education for healthcare professionals is crucial for maximizing the potential of this market.

    Key Players and Competitive Insights

    The Dermatoscopes Market is currently characterized by a dynamic competitive landscape, driven by technological advancements and an increasing emphasis on early skin cancer detection. Key players such as Heine Optotechnik GmbH (Germany), Dermlite (Australia), and Canfield Scientific, Inc. (United States) are at the forefront, each adopting distinct strategies to enhance their market positioning. Heine Optotechnik GmbH focuses on innovation, particularly in developing high-quality optical devices that cater to dermatologists' needs. Meanwhile, Dermlite (Australia) emphasizes partnerships with healthcare providers to expand its reach and enhance product offerings. Canfield Scientific, Inc. (United States) is leveraging digital transformation, integrating advanced imaging technologies into its dermatoscopes to provide comprehensive skin analysis, thereby shaping a competitive environment that prioritizes technological superiority and customer-centric solutions.

    The business tactics employed by these companies reflect a concerted effort to optimize operations and enhance market presence. Localizing manufacturing has emerged as a key tactic, allowing companies to reduce costs and improve supply chain efficiency. The Dermatoscopes Market appears moderately fragmented, with several players vying for market share. However, the collective influence of major companies is significant, as they drive innovation and set industry standards, thereby shaping the overall market structure.

    In August 2025, Heine Optotechnik GmbH (Germany) announced the launch of its latest dermatoscope model, which incorporates artificial intelligence for enhanced diagnostic capabilities. This strategic move not only underscores the company's commitment to innovation but also positions it to meet the growing demand for advanced diagnostic tools in dermatology. The integration of AI is likely to improve diagnostic accuracy, thereby enhancing patient outcomes and solidifying Heine's competitive edge.

    In September 2025, Dermlite (Australia) entered into a strategic partnership with a leading telemedicine platform to facilitate remote skin assessments. This collaboration is indicative of a broader trend towards digital health solutions, allowing dermatologists to conduct consultations and assessments remotely. Such a move not only expands Dermlite's market reach but also aligns with the increasing demand for telehealth services, particularly in dermatology, where timely diagnosis is crucial.

    In July 2025, Canfield Scientific, Inc. (United States) unveiled a new software update for its dermatoscopes, enhancing image analysis capabilities through machine learning algorithms. This update is strategically significant as it positions Canfield at the intersection of technology and dermatology, enabling practitioners to leverage data-driven insights for better patient care. The emphasis on software enhancements reflects a growing trend towards integrating technology into traditional medical practices, thereby fostering a more efficient healthcare delivery model.

    As of October 2025, the competitive trends in the Dermatoscopes Market are increasingly defined by digitalization, sustainability, and the integration of artificial intelligence. Strategic alliances, such as those seen between Dermlite and telemedicine platforms, are reshaping the landscape, fostering innovation and expanding access to dermatological care. Looking ahead, it is anticipated that competitive differentiation will evolve, with a shift from price-based competition to a focus on innovation, technological advancements, and supply chain reliability. Companies that prioritize these aspects are likely to thrive in an increasingly competitive environment.

    Key Companies in the Dermatoscopes Market market include

    Industry Developments

    • Q3 2025: GHO Capital to acquire FotoFinder Systems GHO Capital Partners LLP announced it has signed an agreement to acquire a majority holding in FotoFinder Systems, a global leader in analogue and digital dermatoscopes, total body photography systems, and AI diagnostic software for skin cancer detection and dermatology. The acquisition follows FotoFinder's 2024 acquisition of DermLite and aims to support further global expansion and commercialization into adjacent segments such as aesthetics.
    • Q3 2025: GHO Capital to acquire FotoFinder Systems GHO Capital Partners LLP announced the acquisition of a majority stake in FotoFinder Systems, a pioneer in dermoscopy and total body mapping, offering software/AI-enabled skin imaging devices for skin cancer detection and dermatology. The deal expands GHO's MedTech portfolio and supports FotoFinder's global growth strategy.
    • Q1 2024: Venable Represents EMZ Portfolio Company FotoFinder Systems, Inc. in Acquisition of DermLite LLC FotoFinder Systems, Inc., a global leader in skin imaging solutions, acquired DermLite LLC, a renowned provider of handheld dermoscopy devices. The transaction, which closed on March 15, 2024, unites two complementary businesses and marks EMZ’s first direct investment in the United States.

    .webp

    Future Outlook

    Dermatoscopes Market Future Outlook

    <p>The Dermatoscopes Market is projected to grow at a 12.1% CAGR from 2024 to 2035, driven by technological advancements, increasing skin cancer awareness, and rising demand for early diagnosis.</p>

    New opportunities lie in:

    • <p>Development of AI-integrated dermatoscopes for enhanced diagnostic accuracy.</p>
    • <p>Expansion into emerging markets with tailored product offerings.</p>
    • <p>Partnerships with telemedicine platforms for remote skin assessments.</p>

    <p>By 2035, the Dermatoscopes Market is expected to be robust, reflecting substantial growth and innovation.</p>

    Market Segmentation

    Dermatoscopes Market End Use Outlook

    • Dermatology Clinics
    • Hospitals

    Dermatoscopes Market Product Outlook

    • Contact Dermatoscope
    • Hybrid Dermatoscope
    • Noncontact Dermatoscope

    Dermatoscopes Market Modality Outlook

    • Handheld
    • Trolley Mounted
    • Headband

    Dermatoscopes Market Technology Outlook

    • LED
    • Xenon
    • Halogen
    • Ultraviolet

    Report Scope

    MARKET SIZE 20240.9417(USD Billion)
    MARKET SIZE 20251.056(USD Billion)
    MARKET SIZE 20353.309(USD Billion)
    COMPOUND ANNUAL GROWTH RATE (CAGR)12.1% (2024 - 2035)
    REPORT COVERAGERevenue Forecast, Competitive Landscape, Growth Factors, and Trends
    BASE YEAR2024
    Market Forecast Period2025 - 2035
    Historical Data2019 - 2024
    Market Forecast UnitsUSD Billion
    Key Companies ProfiledMarket analysis in progress
    Segments CoveredMarket segmentation analysis in progress
    Key Market OpportunitiesIntegration of artificial intelligence in Dermatoscopes Market enhances diagnostic accuracy and efficiency.
    Key Market DynamicsTechnological advancements in dermatoscopes drive competitive dynamics and enhance diagnostic accuracy in dermatology.
    Countries CoveredNorth America, Europe, APAC, South America, MEA

    FAQs

    What is the projected market valuation of the Dermatoscopes Market by 2035?

    The Dermatoscopes Market is projected to reach a valuation of 3.309 USD Billion by 2035.

    What was the market valuation of the Dermatoscopes Market in 2024?

    In 2024, the Dermatoscopes Market was valued at 0.9417 USD Billion.

    What is the expected CAGR for the Dermatoscopes Market during the forecast period 2025 - 2035?

    The expected CAGR for the Dermatoscopes Market during the forecast period 2025 - 2035 is 12.1%.

    Which product segment is anticipated to have the highest valuation by 2035?

    The Contact Dermatoscope segment is anticipated to reach a valuation of 1.3295 USD Billion by 2035.

    What are the leading companies in the Dermatoscopes Market?

    Key players in the Dermatoscopes Market include Heine Optotechnik GmbH, Dermlite, and Canfield Scientific, Inc.

    How does the Handheld modality segment perform in terms of market valuation?

    The Handheld modality segment was valued at 0.47 USD Billion in 2024 and is expected to grow to 1.65 USD Billion by 2035.

    1. SECTION I: EXECUTIVE SUMMARY AND KEY HIGHLIGHTS
      1. | 1.1 EXECUTIVE SUMMARY
      2. | | 1.1.1 Market Overview
      3. | | 1.1.2 Key Findings
      4. | | 1.1.3 Market Segmentation
      5. | | 1.1.4 Competitive Landscape
      6. | | 1.1.5 Challenges and Opportunities
      7. | | 1.1.6 Future Outlook
    2. SECTION II: SCOPING, METHODOLOGY AND MARKET STRUCTURE
      1. | 2.1 MARKET INTRODUCTION
      2. | | 2.1.1 Definition
      3. | | 2.1.2 Scope of the study
      4. | | | 2.1.2.1 Research Objective
      5. | | | 2.1.2.2 Assumption
      6. | | | 2.1.2.3 Limitations
      7. | 2.2 RESEARCH METHODOLOGY
      8. | | 2.2.1 Overview
      9. | | 2.2.2 Data Mining
      10. | | 2.2.3 Secondary Research
      11. | | 2.2.4 Primary Research
      12. | | | 2.2.4.1 Primary Interviews and Information Gathering Process
      13. | | | 2.2.4.2 Breakdown of Primary Respondents
      14. | | 2.2.5 Forecasting Model
      15. | | 2.2.6 Market Size Estimation
      16. | | | 2.2.6.1 Bottom-Up Approach
      17. | | | 2.2.6.2 Top-Down Approach
      18. | | 2.2.7 Data Triangulation
      19. | | 2.2.8 Validation
    3. SECTION III: QUALITATIVE ANALYSIS
      1. | 3.1 MARKET DYNAMICS
      2. | | 3.1.1 Overview
      3. | | 3.1.2 Drivers
      4. | | 3.1.3 Restraints
      5. | | 3.1.4 Opportunities
      6. | 3.2 MARKET FACTOR ANALYSIS
      7. | | 3.2.1 Value chain Analysis
      8. | | 3.2.2 Porter's Five Forces Analysis
      9. | | | 3.2.2.1 Bargaining Power of Suppliers
      10. | | | 3.2.2.2 Bargaining Power of Buyers
      11. | | | 3.2.2.3 Threat of New Entrants
      12. | | | 3.2.2.4 Threat of Substitutes
      13. | | | 3.2.2.5 Intensity of Rivalry
      14. | | 3.2.3 COVID-19 Impact Analysis
      15. | | | 3.2.3.1 Market Impact Analysis
      16. | | | 3.2.3.2 Regional Impact
      17. | | | 3.2.3.3 Opportunity and Threat Analysis
    4. SECTION IV: QUANTITATIVE ANALYSIS
      1. | 4.1 Healthcare, BY Product (USD Billion)
      2. | | 4.1.1 Contact Dermatoscope
      3. | | 4.1.2 Hybrid Dermatoscope
      4. | | 4.1.3 Noncontact Dermatoscope
      5. | 4.2 Healthcare, BY Technology (USD Billion)
      6. | | 4.2.1 LED
      7. | | 4.2.2 Xenon
      8. | | 4.2.3 Halogen
      9. | | 4.2.4 Ultraviolet
      10. | 4.3 Healthcare, BY Modality (USD Billion)
      11. | | 4.3.1 Handheld
      12. | | 4.3.2 Trolley Mounted
      13. | | 4.3.3 Headband
      14. | 4.4 Healthcare, BY End Use (USD Billion)
      15. | | 4.4.1 Dermatology Clinics
      16. | | 4.4.2 Hospitals
      17. | 4.5 Healthcare, BY Region (USD Billion)
      18. | | 4.5.1 North America
      19. | | | 4.5.1.1 US
      20. | | | 4.5.1.2 Canada
      21. | | 4.5.2 Europe
      22. | | | 4.5.2.1 Germany
      23. | | | 4.5.2.2 UK
      24. | | | 4.5.2.3 France
      25. | | | 4.5.2.4 Russia
      26. | | | 4.5.2.5 Italy
      27. | | | 4.5.2.6 Spain
      28. | | | 4.5.2.7 Rest of Europe
      29. | | 4.5.3 APAC
      30. | | | 4.5.3.1 China
      31. | | | 4.5.3.2 India
      32. | | | 4.5.3.3 Japan
      33. | | | 4.5.3.4 South Korea
      34. | | | 4.5.3.5 Malaysia
      35. | | | 4.5.3.6 Thailand
      36. | | | 4.5.3.7 Indonesia
      37. | | | 4.5.3.8 Rest of APAC
      38. | | 4.5.4 South America
      39. | | | 4.5.4.1 Brazil
      40. | | | 4.5.4.2 Mexico
      41. | | | 4.5.4.3 Argentina
      42. | | | 4.5.4.4 Rest of South America
      43. | | 4.5.5 MEA
      44. | | | 4.5.5.1 GCC Countries
      45. | | | 4.5.5.2 South Africa
      46. | | | 4.5.5.3 Rest of MEA
    5. SECTION V: COMPETITIVE ANALYSIS
      1. | 5.1 Competitive Landscape
      2. | | 5.1.1 Overview
      3. | | 5.1.2 Competitive Analysis
      4. | | 5.1.3 Market share Analysis
      5. | | 5.1.4 Major Growth Strategy in the Healthcare
      6. | | 5.1.5 Competitive Benchmarking
      7. | | 5.1.6 Leading Players in Terms of Number of Developments in the Healthcare
      8. | | 5.1.7 Key developments and growth strategies
      9. | | | 5.1.7.1 New Product Launch/Service Deployment
      10. | | | 5.1.7.2 Merger & Acquisitions
      11. | | | 5.1.7.3 Joint Ventures
      12. | | 5.1.8 Major Players Financial Matrix
      13. | | | 5.1.8.1 Sales and Operating Income
      14. | | | 5.1.8.2 Major Players R&D Expenditure. 2023
      15. | 5.2 Company Profiles
      16. | | 5.2.1 Heine Optotechnik GmbH (DE)
      17. | | | 5.2.1.1 Financial Overview
      18. | | | 5.2.1.2 Products Offered
      19. | | | 5.2.1.3 Key Developments
      20. | | | 5.2.1.4 SWOT Analysis
      21. | | | 5.2.1.5 Key Strategies
      22. | | 5.2.2 Dermlite (AU)
      23. | | | 5.2.2.1 Financial Overview
      24. | | | 5.2.2.2 Products Offered
      25. | | | 5.2.2.3 Key Developments
      26. | | | 5.2.2.4 SWOT Analysis
      27. | | | 5.2.2.5 Key Strategies
      28. | | 5.2.3 Canfield Scientific, Inc. (US)
      29. | | | 5.2.3.1 Financial Overview
      30. | | | 5.2.3.2 Products Offered
      31. | | | 5.2.3.3 Key Developments
      32. | | | 5.2.3.4 SWOT Analysis
      33. | | | 5.2.3.5 Key Strategies
      34. | | 5.2.4 FotoFinder Systems GmbH (DE)
      35. | | | 5.2.4.1 Financial Overview
      36. | | | 5.2.4.2 Products Offered
      37. | | | 5.2.4.3 Key Developments
      38. | | | 5.2.4.4 SWOT Analysis
      39. | | | 5.2.4.5 Key Strategies
      40. | | 5.2.5 3Gen (US)
      41. | | | 5.2.5.1 Financial Overview
      42. | | | 5.2.5.2 Products Offered
      43. | | | 5.2.5.3 Key Developments
      44. | | | 5.2.5.4 SWOT Analysis
      45. | | | 5.2.5.5 Key Strategies
      46. | | 5.2.6 Mela Sciences, Inc. (US)
      47. | | | 5.2.6.1 Financial Overview
      48. | | | 5.2.6.2 Products Offered
      49. | | | 5.2.6.3 Key Developments
      50. | | | 5.2.6.4 SWOT Analysis
      51. | | | 5.2.6.5 Key Strategies
      52. | | 5.2.7 Nikon Corporation (JP)
      53. | | | 5.2.7.1 Financial Overview
      54. | | | 5.2.7.2 Products Offered
      55. | | | 5.2.7.3 Key Developments
      56. | | | 5.2.7.4 SWOT Analysis
      57. | | | 5.2.7.5 Key Strategies
      58. | | 5.2.8 Welch Allyn (US)
      59. | | | 5.2.8.1 Financial Overview
      60. | | | 5.2.8.2 Products Offered
      61. | | | 5.2.8.3 Key Developments
      62. | | | 5.2.8.4 SWOT Analysis
      63. | | | 5.2.8.5 Key Strategies
      64. | 5.3 Appendix
      65. | | 5.3.1 References
      66. | | 5.3.2 Related Reports
    6. LIST OF FIGURES
      1. | 6.1 MARKET SYNOPSIS
      2. | 6.2 NORTH AMERICA MARKET ANALYSIS
      3. | 6.3 US MARKET ANALYSIS BY PRODUCT
      4. | 6.4 US MARKET ANALYSIS BY TECHNOLOGY
      5. | 6.5 US MARKET ANALYSIS BY MODALITY
      6. | 6.6 US MARKET ANALYSIS BY END USE
      7. | 6.7 CANADA MARKET ANALYSIS BY PRODUCT
      8. | 6.8 CANADA MARKET ANALYSIS BY TECHNOLOGY
      9. | 6.9 CANADA MARKET ANALYSIS BY MODALITY
      10. | 6.10 CANADA MARKET ANALYSIS BY END USE
      11. | 6.11 EUROPE MARKET ANALYSIS
      12. | 6.12 GERMANY MARKET ANALYSIS BY PRODUCT
      13. | 6.13 GERMANY MARKET ANALYSIS BY TECHNOLOGY
      14. | 6.14 GERMANY MARKET ANALYSIS BY MODALITY
      15. | 6.15 GERMANY MARKET ANALYSIS BY END USE
      16. | 6.16 UK MARKET ANALYSIS BY PRODUCT
      17. | 6.17 UK MARKET ANALYSIS BY TECHNOLOGY
      18. | 6.18 UK MARKET ANALYSIS BY MODALITY
      19. | 6.19 UK MARKET ANALYSIS BY END USE
      20. | 6.20 FRANCE MARKET ANALYSIS BY PRODUCT
      21. | 6.21 FRANCE MARKET ANALYSIS BY TECHNOLOGY
      22. | 6.22 FRANCE MARKET ANALYSIS BY MODALITY
      23. | 6.23 FRANCE MARKET ANALYSIS BY END USE
      24. | 6.24 RUSSIA MARKET ANALYSIS BY PRODUCT
      25. | 6.25 RUSSIA MARKET ANALYSIS BY TECHNOLOGY
      26. | 6.26 RUSSIA MARKET ANALYSIS BY MODALITY
      27. | 6.27 RUSSIA MARKET ANALYSIS BY END USE
      28. | 6.28 ITALY MARKET ANALYSIS BY PRODUCT
      29. | 6.29 ITALY MARKET ANALYSIS BY TECHNOLOGY
      30. | 6.30 ITALY MARKET ANALYSIS BY MODALITY
      31. | 6.31 ITALY MARKET ANALYSIS BY END USE
      32. | 6.32 SPAIN MARKET ANALYSIS BY PRODUCT
      33. | 6.33 SPAIN MARKET ANALYSIS BY TECHNOLOGY
      34. | 6.34 SPAIN MARKET ANALYSIS BY MODALITY
      35. | 6.35 SPAIN MARKET ANALYSIS BY END USE
      36. | 6.36 REST OF EUROPE MARKET ANALYSIS BY PRODUCT
      37. | 6.37 REST OF EUROPE MARKET ANALYSIS BY TECHNOLOGY
      38. | 6.38 REST OF EUROPE MARKET ANALYSIS BY MODALITY
      39. | 6.39 REST OF EUROPE MARKET ANALYSIS BY END USE
      40. | 6.40 APAC MARKET ANALYSIS
      41. | 6.41 CHINA MARKET ANALYSIS BY PRODUCT
      42. | 6.42 CHINA MARKET ANALYSIS BY TECHNOLOGY
      43. | 6.43 CHINA MARKET ANALYSIS BY MODALITY
      44. | 6.44 CHINA MARKET ANALYSIS BY END USE
      45. | 6.45 INDIA MARKET ANALYSIS BY PRODUCT
      46. | 6.46 INDIA MARKET ANALYSIS BY TECHNOLOGY
      47. | 6.47 INDIA MARKET ANALYSIS BY MODALITY
      48. | 6.48 INDIA MARKET ANALYSIS BY END USE
      49. | 6.49 JAPAN MARKET ANALYSIS BY PRODUCT
      50. | 6.50 JAPAN MARKET ANALYSIS BY TECHNOLOGY
      51. | 6.51 JAPAN MARKET ANALYSIS BY MODALITY
      52. | 6.52 JAPAN MARKET ANALYSIS BY END USE
      53. | 6.53 SOUTH KOREA MARKET ANALYSIS BY PRODUCT
      54. | 6.54 SOUTH KOREA MARKET ANALYSIS BY TECHNOLOGY
      55. | 6.55 SOUTH KOREA MARKET ANALYSIS BY MODALITY
      56. | 6.56 SOUTH KOREA MARKET ANALYSIS BY END USE
      57. | 6.57 MALAYSIA MARKET ANALYSIS BY PRODUCT
      58. | 6.58 MALAYSIA MARKET ANALYSIS BY TECHNOLOGY
      59. | 6.59 MALAYSIA MARKET ANALYSIS BY MODALITY
      60. | 6.60 MALAYSIA MARKET ANALYSIS BY END USE
      61. | 6.61 THAILAND MARKET ANALYSIS BY PRODUCT
      62. | 6.62 THAILAND MARKET ANALYSIS BY TECHNOLOGY
      63. | 6.63 THAILAND MARKET ANALYSIS BY MODALITY
      64. | 6.64 THAILAND MARKET ANALYSIS BY END USE
      65. | 6.65 INDONESIA MARKET ANALYSIS BY PRODUCT
      66. | 6.66 INDONESIA MARKET ANALYSIS BY TECHNOLOGY
      67. | 6.67 INDONESIA MARKET ANALYSIS BY MODALITY
      68. | 6.68 INDONESIA MARKET ANALYSIS BY END USE
      69. | 6.69 REST OF APAC MARKET ANALYSIS BY PRODUCT
      70. | 6.70 REST OF APAC MARKET ANALYSIS BY TECHNOLOGY
      71. | 6.71 REST OF APAC MARKET ANALYSIS BY MODALITY
      72. | 6.72 REST OF APAC MARKET ANALYSIS BY END USE
      73. | 6.73 SOUTH AMERICA MARKET ANALYSIS
      74. | 6.74 BRAZIL MARKET ANALYSIS BY PRODUCT
      75. | 6.75 BRAZIL MARKET ANALYSIS BY TECHNOLOGY
      76. | 6.76 BRAZIL MARKET ANALYSIS BY MODALITY
      77. | 6.77 BRAZIL MARKET ANALYSIS BY END USE
      78. | 6.78 MEXICO MARKET ANALYSIS BY PRODUCT
      79. | 6.79 MEXICO MARKET ANALYSIS BY TECHNOLOGY
      80. | 6.80 MEXICO MARKET ANALYSIS BY MODALITY
      81. | 6.81 MEXICO MARKET ANALYSIS BY END USE
      82. | 6.82 ARGENTINA MARKET ANALYSIS BY PRODUCT
      83. | 6.83 ARGENTINA MARKET ANALYSIS BY TECHNOLOGY
      84. | 6.84 ARGENTINA MARKET ANALYSIS BY MODALITY
      85. | 6.85 ARGENTINA MARKET ANALYSIS BY END USE
      86. | 6.86 REST OF SOUTH AMERICA MARKET ANALYSIS BY PRODUCT
      87. | 6.87 REST OF SOUTH AMERICA MARKET ANALYSIS BY TECHNOLOGY
      88. | 6.88 REST OF SOUTH AMERICA MARKET ANALYSIS BY MODALITY
      89. | 6.89 REST OF SOUTH AMERICA MARKET ANALYSIS BY END USE
      90. | 6.90 MEA MARKET ANALYSIS
      91. | 6.91 GCC COUNTRIES MARKET ANALYSIS BY PRODUCT
      92. | 6.92 GCC COUNTRIES MARKET ANALYSIS BY TECHNOLOGY
      93. | 6.93 GCC COUNTRIES MARKET ANALYSIS BY MODALITY
      94. | 6.94 GCC COUNTRIES MARKET ANALYSIS BY END USE
      95. | 6.95 SOUTH AFRICA MARKET ANALYSIS BY PRODUCT
      96. | 6.96 SOUTH AFRICA MARKET ANALYSIS BY TECHNOLOGY
      97. | 6.97 SOUTH AFRICA MARKET ANALYSIS BY MODALITY
      98. | 6.98 SOUTH AFRICA MARKET ANALYSIS BY END USE
      99. | 6.99 REST OF MEA MARKET ANALYSIS BY PRODUCT
      100. | 6.100 REST OF MEA MARKET ANALYSIS BY TECHNOLOGY
      101. | 6.101 REST OF MEA MARKET ANALYSIS BY MODALITY
      102. | 6.102 REST OF MEA MARKET ANALYSIS BY END USE
      103. | 6.103 KEY BUYING CRITERIA OF HEALTHCARE
      104. | 6.104 RESEARCH PROCESS OF MRFR
      105. | 6.105 DRO ANALYSIS OF HEALTHCARE
      106. | 6.106 DRIVERS IMPACT ANALYSIS: HEALTHCARE
      107. | 6.107 RESTRAINTS IMPACT ANALYSIS: HEALTHCARE
      108. | 6.108 SUPPLY / VALUE CHAIN: HEALTHCARE
      109. | 6.109 HEALTHCARE, BY PRODUCT, 2024 (% SHARE)
      110. | 6.110 HEALTHCARE, BY PRODUCT, 2024 TO 2035 (USD Billion)
      111. | 6.111 HEALTHCARE, BY TECHNOLOGY, 2024 (% SHARE)
      112. | 6.112 HEALTHCARE, BY TECHNOLOGY, 2024 TO 2035 (USD Billion)
      113. | 6.113 HEALTHCARE, BY MODALITY, 2024 (% SHARE)
      114. | 6.114 HEALTHCARE, BY MODALITY, 2024 TO 2035 (USD Billion)
      115. | 6.115 HEALTHCARE, BY END USE, 2024 (% SHARE)
      116. | 6.116 HEALTHCARE, BY END USE, 2024 TO 2035 (USD Billion)
      117. | 6.117 BENCHMARKING OF MAJOR COMPETITORS
    7. LIST OF TABLES
      1. | 7.1 LIST OF ASSUMPTIONS
      2. | | 7.1.1
      3. | 7.2 North America MARKET SIZE ESTIMATES; FORECAST
      4. | | 7.2.1 BY PRODUCT, 2025-2035 (USD Billion)
      5. | | 7.2.2 BY TECHNOLOGY, 2025-2035 (USD Billion)
      6. | | 7.2.3 BY MODALITY, 2025-2035 (USD Billion)
      7. | | 7.2.4 BY END USE, 2025-2035 (USD Billion)
      8. | 7.3 US MARKET SIZE ESTIMATES; FORECAST
      9. | | 7.3.1 BY PRODUCT, 2025-2035 (USD Billion)
      10. | | 7.3.2 BY TECHNOLOGY, 2025-2035 (USD Billion)
      11. | | 7.3.3 BY MODALITY, 2025-2035 (USD Billion)
      12. | | 7.3.4 BY END USE, 2025-2035 (USD Billion)
      13. | 7.4 Canada MARKET SIZE ESTIMATES; FORECAST
      14. | | 7.4.1 BY PRODUCT, 2025-2035 (USD Billion)
      15. | | 7.4.2 BY TECHNOLOGY, 2025-2035 (USD Billion)
      16. | | 7.4.3 BY MODALITY, 2025-2035 (USD Billion)
      17. | | 7.4.4 BY END USE, 2025-2035 (USD Billion)
      18. | 7.5 Europe MARKET SIZE ESTIMATES; FORECAST
      19. | | 7.5.1 BY PRODUCT, 2025-2035 (USD Billion)
      20. | | 7.5.2 BY TECHNOLOGY, 2025-2035 (USD Billion)
      21. | | 7.5.3 BY MODALITY, 2025-2035 (USD Billion)
      22. | | 7.5.4 BY END USE, 2025-2035 (USD Billion)
      23. | 7.6 Germany MARKET SIZE ESTIMATES; FORECAST
      24. | | 7.6.1 BY PRODUCT, 2025-2035 (USD Billion)
      25. | | 7.6.2 BY TECHNOLOGY, 2025-2035 (USD Billion)
      26. | | 7.6.3 BY MODALITY, 2025-2035 (USD Billion)
      27. | | 7.6.4 BY END USE, 2025-2035 (USD Billion)
      28. | 7.7 UK MARKET SIZE ESTIMATES; FORECAST
      29. | | 7.7.1 BY PRODUCT, 2025-2035 (USD Billion)
      30. | | 7.7.2 BY TECHNOLOGY, 2025-2035 (USD Billion)
      31. | | 7.7.3 BY MODALITY, 2025-2035 (USD Billion)
      32. | | 7.7.4 BY END USE, 2025-2035 (USD Billion)
      33. | 7.8 France MARKET SIZE ESTIMATES; FORECAST
      34. | | 7.8.1 BY PRODUCT, 2025-2035 (USD Billion)
      35. | | 7.8.2 BY TECHNOLOGY, 2025-2035 (USD Billion)
      36. | | 7.8.3 BY MODALITY, 2025-2035 (USD Billion)
      37. | | 7.8.4 BY END USE, 2025-2035 (USD Billion)
      38. | 7.9 Russia MARKET SIZE ESTIMATES; FORECAST
      39. | | 7.9.1 BY PRODUCT, 2025-2035 (USD Billion)
      40. | | 7.9.2 BY TECHNOLOGY, 2025-2035 (USD Billion)
      41. | | 7.9.3 BY MODALITY, 2025-2035 (USD Billion)
      42. | | 7.9.4 BY END USE, 2025-2035 (USD Billion)
      43. | 7.10 Italy MARKET SIZE ESTIMATES; FORECAST
      44. | | 7.10.1 BY PRODUCT, 2025-2035 (USD Billion)
      45. | | 7.10.2 BY TECHNOLOGY, 2025-2035 (USD Billion)
      46. | | 7.10.3 BY MODALITY, 2025-2035 (USD Billion)
      47. | | 7.10.4 BY END USE, 2025-2035 (USD Billion)
      48. | 7.11 Spain MARKET SIZE ESTIMATES; FORECAST
      49. | | 7.11.1 BY PRODUCT, 2025-2035 (USD Billion)
      50. | | 7.11.2 BY TECHNOLOGY, 2025-2035 (USD Billion)
      51. | | 7.11.3 BY MODALITY, 2025-2035 (USD Billion)
      52. | | 7.11.4 BY END USE, 2025-2035 (USD Billion)
      53. | 7.12 Rest of Europe MARKET SIZE ESTIMATES; FORECAST
      54. | | 7.12.1 BY PRODUCT, 2025-2035 (USD Billion)
      55. | | 7.12.2 BY TECHNOLOGY, 2025-2035 (USD Billion)
      56. | | 7.12.3 BY MODALITY, 2025-2035 (USD Billion)
      57. | | 7.12.4 BY END USE, 2025-2035 (USD Billion)
      58. | 7.13 APAC MARKET SIZE ESTIMATES; FORECAST
      59. | | 7.13.1 BY PRODUCT, 2025-2035 (USD Billion)
      60. | | 7.13.2 BY TECHNOLOGY, 2025-2035 (USD Billion)
      61. | | 7.13.3 BY MODALITY, 2025-2035 (USD Billion)
      62. | | 7.13.4 BY END USE, 2025-2035 (USD Billion)
      63. | 7.14 China MARKET SIZE ESTIMATES; FORECAST
      64. | | 7.14.1 BY PRODUCT, 2025-2035 (USD Billion)
      65. | | 7.14.2 BY TECHNOLOGY, 2025-2035 (USD Billion)
      66. | | 7.14.3 BY MODALITY, 2025-2035 (USD Billion)
      67. | | 7.14.4 BY END USE, 2025-2035 (USD Billion)
      68. | 7.15 India MARKET SIZE ESTIMATES; FORECAST
      69. | | 7.15.1 BY PRODUCT, 2025-2035 (USD Billion)
      70. | | 7.15.2 BY TECHNOLOGY, 2025-2035 (USD Billion)
      71. | | 7.15.3 BY MODALITY, 2025-2035 (USD Billion)
      72. | | 7.15.4 BY END USE, 2025-2035 (USD Billion)
      73. | 7.16 Japan MARKET SIZE ESTIMATES; FORECAST
      74. | | 7.16.1 BY PRODUCT, 2025-2035 (USD Billion)
      75. | | 7.16.2 BY TECHNOLOGY, 2025-2035 (USD Billion)
      76. | | 7.16.3 BY MODALITY, 2025-2035 (USD Billion)
      77. | | 7.16.4 BY END USE, 2025-2035 (USD Billion)
      78. | 7.17 South Korea MARKET SIZE ESTIMATES; FORECAST
      79. | | 7.17.1 BY PRODUCT, 2025-2035 (USD Billion)
      80. | | 7.17.2 BY TECHNOLOGY, 2025-2035 (USD Billion)
      81. | | 7.17.3 BY MODALITY, 2025-2035 (USD Billion)
      82. | | 7.17.4 BY END USE, 2025-2035 (USD Billion)
      83. | 7.18 Malaysia MARKET SIZE ESTIMATES; FORECAST
      84. | | 7.18.1 BY PRODUCT, 2025-2035 (USD Billion)
      85. | | 7.18.2 BY TECHNOLOGY, 2025-2035 (USD Billion)
      86. | | 7.18.3 BY MODALITY, 2025-2035 (USD Billion)
      87. | | 7.18.4 BY END USE, 2025-2035 (USD Billion)
      88. | 7.19 Thailand MARKET SIZE ESTIMATES; FORECAST
      89. | | 7.19.1 BY PRODUCT, 2025-2035 (USD Billion)
      90. | | 7.19.2 BY TECHNOLOGY, 2025-2035 (USD Billion)
      91. | | 7.19.3 BY MODALITY, 2025-2035 (USD Billion)
      92. | | 7.19.4 BY END USE, 2025-2035 (USD Billion)
      93. | 7.20 Indonesia MARKET SIZE ESTIMATES; FORECAST
      94. | | 7.20.1 BY PRODUCT, 2025-2035 (USD Billion)
      95. | | 7.20.2 BY TECHNOLOGY, 2025-2035 (USD Billion)
      96. | | 7.20.3 BY MODALITY, 2025-2035 (USD Billion)
      97. | | 7.20.4 BY END USE, 2025-2035 (USD Billion)
      98. | 7.21 Rest of APAC MARKET SIZE ESTIMATES; FORECAST
      99. | | 7.21.1 BY PRODUCT, 2025-2035 (USD Billion)
      100. | | 7.21.2 BY TECHNOLOGY, 2025-2035 (USD Billion)
      101. | | 7.21.3 BY MODALITY, 2025-2035 (USD Billion)
      102. | | 7.21.4 BY END USE, 2025-2035 (USD Billion)
      103. | 7.22 South America MARKET SIZE ESTIMATES; FORECAST
      104. | | 7.22.1 BY PRODUCT, 2025-2035 (USD Billion)
      105. | | 7.22.2 BY TECHNOLOGY, 2025-2035 (USD Billion)
      106. | | 7.22.3 BY MODALITY, 2025-2035 (USD Billion)
      107. | | 7.22.4 BY END USE, 2025-2035 (USD Billion)
      108. | 7.23 Brazil MARKET SIZE ESTIMATES; FORECAST
      109. | | 7.23.1 BY PRODUCT, 2025-2035 (USD Billion)
      110. | | 7.23.2 BY TECHNOLOGY, 2025-2035 (USD Billion)
      111. | | 7.23.3 BY MODALITY, 2025-2035 (USD Billion)
      112. | | 7.23.4 BY END USE, 2025-2035 (USD Billion)
      113. | 7.24 Mexico MARKET SIZE ESTIMATES; FORECAST
      114. | | 7.24.1 BY PRODUCT, 2025-2035 (USD Billion)
      115. | | 7.24.2 BY TECHNOLOGY, 2025-2035 (USD Billion)
      116. | | 7.24.3 BY MODALITY, 2025-2035 (USD Billion)
      117. | | 7.24.4 BY END USE, 2025-2035 (USD Billion)
      118. | 7.25 Argentina MARKET SIZE ESTIMATES; FORECAST
      119. | | 7.25.1 BY PRODUCT, 2025-2035 (USD Billion)
      120. | | 7.25.2 BY TECHNOLOGY, 2025-2035 (USD Billion)
      121. | | 7.25.3 BY MODALITY, 2025-2035 (USD Billion)
      122. | | 7.25.4 BY END USE, 2025-2035 (USD Billion)
      123. | 7.26 Rest of South America MARKET SIZE ESTIMATES; FORECAST
      124. | | 7.26.1 BY PRODUCT, 2025-2035 (USD Billion)
      125. | | 7.26.2 BY TECHNOLOGY, 2025-2035 (USD Billion)
      126. | | 7.26.3 BY MODALITY, 2025-2035 (USD Billion)
      127. | | 7.26.4 BY END USE, 2025-2035 (USD Billion)
      128. | 7.27 MEA MARKET SIZE ESTIMATES; FORECAST
      129. | | 7.27.1 BY PRODUCT, 2025-2035 (USD Billion)
      130. | | 7.27.2 BY TECHNOLOGY, 2025-2035 (USD Billion)
      131. | | 7.27.3 BY MODALITY, 2025-2035 (USD Billion)
      132. | | 7.27.4 BY END USE, 2025-2035 (USD Billion)
      133. | 7.28 GCC Countries MARKET SIZE ESTIMATES; FORECAST
      134. | | 7.28.1 BY PRODUCT, 2025-2035 (USD Billion)
      135. | | 7.28.2 BY TECHNOLOGY, 2025-2035 (USD Billion)
      136. | | 7.28.3 BY MODALITY, 2025-2035 (USD Billion)
      137. | | 7.28.4 BY END USE, 2025-2035 (USD Billion)
      138. | 7.29 South Africa MARKET SIZE ESTIMATES; FORECAST
      139. | | 7.29.1 BY PRODUCT, 2025-2035 (USD Billion)
      140. | | 7.29.2 BY TECHNOLOGY, 2025-2035 (USD Billion)
      141. | | 7.29.3 BY MODALITY, 2025-2035 (USD Billion)
      142. | | 7.29.4 BY END USE, 2025-2035 (USD Billion)
      143. | 7.30 Rest of MEA MARKET SIZE ESTIMATES; FORECAST
      144. | | 7.30.1 BY PRODUCT, 2025-2035 (USD Billion)
      145. | | 7.30.2 BY TECHNOLOGY, 2025-2035 (USD Billion)
      146. | | 7.30.3 BY MODALITY, 2025-2035 (USD Billion)
      147. | | 7.30.4 BY END USE, 2025-2035 (USD Billion)
      148. | 7.31 PRODUCT LAUNCH/PRODUCT DEVELOPMENT/APPROVAL
      149. | | 7.31.1
      150. | 7.32 ACQUISITION/PARTNERSHIP
      151. | | 7.32.1

    Market Segmentation

    Dermatoscopes Outlook (USD Billion, 2018-2032)

    Contact Dermatoscope

    Hybrid Dermatoscope

    Noncontact Dermatoscope

    Dermatoscopes Technology Outlook (USD Billion, 2018-2032)

    LED

    Xenon

    Halogen

    Ultraviolet

    Dermatoscopes Modality Outlook (USD Billion, 2018-2032)

    Handheld

    Trolley Mounted

    Headband

    Dermatoscopes End Use Outlook (USD Billion, 2018-2032)

    Dermatology Clinics

    Hospitals

    Dermatoscopes Regional Outlook (USD Billion, 2018-2032)

    North America Outlook (USD Billion, 2018-2032)

    North America Dermatoscopes by Type

    Contact Dermatoscope

    Hybrid Dermatoscope

    Noncontact Dermatoscope

    North America Dermatoscopes by Technology

    LED

    Xenon

    Halogen

    Ultraviolet

    North America Dermatoscopes by Modality

    Handheld

    Trolley Mounted

    Headband

    North America Dermatoscopes by End Use

    Dermatology Clinics

    Hospitals

    US Outlook (USD Billion, 2018-2032)

    US Dermatoscopes by Type

    Contact Dermatoscope

    Hybrid Dermatoscope

    Noncontact Dermatoscope

    US Dermatoscopes by Technology

    LED

    Xenon

    Halogen

    Ultraviolet

    US Dermatoscopes by Modality

    Handheld

    Trolley Mounted

    Headband

    US Dermatoscopes by End Use

    Dermatology Clinics

    Hospitals

    CANADA Outlook (USD Billion, 2018-2032)

    CANADA Dermatoscopes by Type

    Contact Dermatoscope

    Hybrid Dermatoscope

    Noncontact Dermatoscope

    CANADA Dermatoscopes by Technology

    LED

    Xenon

    Halogen

    Ultraviolet

    CANADA Dermatoscopes by Modality

    Handheld

    Trolley Mounted

    Headband

    CANADA Dermatoscopes by End Use

    Dermatology Clinics

    Hospitals

    Europe Outlook (USD Billion, 2018-2032)

    Europe Dermatoscopes by Type

    Contact Dermatoscope

    Hybrid Dermatoscope

    Noncontact Dermatoscope

    Europe Dermatoscopes by Technology

    LED

    Xenon

    Halogen

    Ultraviolet

    Europe Dermatoscopes by Modality

    Handheld

    Trolley Mounted

    Headband

    Europe Dermatoscopes by End Use

    Dermatology Clinics

    Hospitals

    Germany Outlook (USD Billion, 2018-2032)

    Germany Dermatoscopes by Type

    Contact Dermatoscope

    Hybrid Dermatoscope

    Noncontact Dermatoscope

    Germany Dermatoscopes by Technology

    LED

    Xenon

    Halogen

    Ultraviolet

    Germany Dermatoscopes by Modality

    Handheld

    Trolley Mounted

    Headband

    Germany Dermatoscopes by End Use

    Dermatology Clinics

    Hospitals

    France Outlook (USD Billion, 2018-2032)

    France Dermatoscopes by Type

    Contact Dermatoscope

    Hybrid Dermatoscope

    Noncontact Dermatoscope

    France Dermatoscopes by Technology

    LED

    Xenon

    Halogen

    Ultraviolet

    France Dermatoscopes by Modality

    Handheld

    Trolley Mounted

    Headband

    France Dermatoscopes by End Use

    Dermatology Clinics

    Hospitals

    UK Outlook (USD Billion, 2018-2032)

    UK Dermatoscopes by Type

    Contact Dermatoscope

    Hybrid Dermatoscope

    Noncontact Dermatoscope

    UK Dermatoscopes by Technology

    LED

    Xenon

    Halogen

    Ultraviolet

    UK Dermatoscopes by Modality

    Handheld

    Trolley Mounted

    Headband

    UK Dermatoscopes by End Use

    Dermatology Clinics

    Hospitals

    ITALY Outlook (USD Billion, 2018-2032)

    ITALY Dermatoscopes by Type

    Contact Dermatoscope

    Hybrid Dermatoscope

    Noncontact Dermatoscope

    ITALY Dermatoscopes by Technology

    LED

    Xenon

    Halogen

    Ultraviolet

    ITALY Dermatoscopes by Modality

    Handheld

    Trolley Mounted

    Headband

    ITALY Dermatoscopes by End Use

    Dermatology Clinics

    Hospitals

    SPAIN Outlook (USD Billion, 2018-2032)

    Spain Dermatoscopes by Type

    Contact Dermatoscope

    Hybrid Dermatoscope

    Noncontact Dermatoscope

    Spain Dermatoscopes by Technology

    LED

    Xenon

    Halogen

    Ultraviolet

    SPAIN Dermatoscopes by Modality

    Handheld

    Trolley Mounted

    Headband

    SPAIN Dermatoscopes by End Use

    Dermatology Clinics

    Hospitals

    Rest Of Europe Outlook (USD Billion, 2018-2032)

    Rest Of Europe Dermatoscopes by Type

    Contact Dermatoscope

    Hybrid Dermatoscope

    Noncontact Dermatoscope

    REST OF EUROPE Dermatoscopes by Technology

    LED

    Xenon

    Halogen

    Ultraviolet

    Rest Of Europe Dermatoscopes by Modality

    Handheld

    Trolley Mounted

    Headband

    Rest Of Europe Dermatoscopes by End Use

    Dermatology Clinics

    Hospitals

    Asia-Pacific Outlook (USD Billion, 2018-2032)

    Asia-Pacific Dermatoscopes by Type

    Contact Dermatoscope

    Hybrid Dermatoscope

    Noncontact Dermatoscope

    Asia-Pacific Dermatoscopes by Technology

    LED

    Xenon

    Halogen

    Ultraviolet

    Asia-Pacific Dermatoscopes by Modality

    Handheld

    Trolley Mounted

    Headband

    Asia-Pacific Dermatoscopes by End Use

    Dermatology Clinics

    Hospitals

    China Outlook (USD Billion, 2018-2032)

    China Dermatoscopes by Type

    Contact Dermatoscope

    Hybrid Dermatoscope

    Noncontact Dermatoscope

    China Dermatoscopes by Technology

    LED

    Xenon

    Halogen

    Ultraviolet

    China Dermatoscopes by Modality

    Handheld

    Trolley Mounted

    Headband

    China Dermatoscopes by End Use

    Dermatology Clinics

    Hospitals

    Japan Outlook (USD Billion, 2018-2032)

    Japan Dermatoscopes by Type

    Contact Dermatoscope

    Hybrid Dermatoscope

    Noncontact Dermatoscope

    Japan Dermatoscopes by Technology

    LED

    Xenon

    Halogen

    Ultraviolet

    Japan Dermatoscopes by Modality

    Handheld

    Trolley Mounted

    Headband

    Japan Dermatoscopes by End Use

    Dermatology Clinics

    Hospitals

    India Outlook (USD Billion, 2018-2032)

    India Dermatoscopes by Type

    Contact Dermatoscope

    Hybrid Dermatoscope

    Noncontact Dermatoscope

    India Dermatoscopes by Technology

    LED

    Xenon

    Halogen

    Ultraviolet

    India Dermatoscopes by Modality

    Handheld

    Trolley Mounted

    Headband

    India Dermatoscopes by End Use

    Dermatology Clinics

    Hospitals

    Australia Outlook (USD Billion, 2018-2032)

    Australia Dermatoscopes by Type

    Contact Dermatoscope

    Hybrid Dermatoscope

    Noncontact Dermatoscope

    Australia Dermatoscopes by Technology

    LED

    Xenon

    Halogen

    Ultraviolet

    Australia Dermatoscopes by Modality

    Handheld

    Trolley Mounted

    Headband

    Australia Dermatoscopes by End Use

    Dermatology Clinics

    Hospitals

    Rest of Asia-Pacific Outlook (USD Billion, 2018-2032)

    Rest of Asia-Pacific Dermatoscopes by Type

    Contact Dermatoscope

    Hybrid Dermatoscope

    Noncontact Dermatoscope

    Rest of Asia-Pacific Dermatoscopes by Technology

    LED

    Xenon

    Halogen

    Ultraviolet

    Rest of Asia-Pacific Dermatoscopes by Modality

    Handheld

    Trolley Mounted

    Headband

    Rest of Asia-Pacific Dermatoscopes by End Use

    Dermatology Clinics

    Hospitals

    Rest of the World Outlook (USD Billion, 2018-2032)

    Rest of the World Dermatoscopes by Type

    Contact Dermatoscope

    Hybrid Dermatoscope

    Noncontact Dermatoscope

    Rest of the World Dermatoscopes by Technology

    LED

    Xenon

    Halogen

    Ultraviolet

    Rest of the World Dermatoscopes by Modality

    Handheld

    Trolley Mounted

    Headband

    Rest of the World Dermatoscopes by End Use

    Dermatology Clinics

    Hospitals

    Middle East Outlook (USD Billion, 2018-2032)

    Middle East Dermatoscopes by Type

    Contact Dermatoscope

    Hybrid Dermatoscope

    Noncontact Dermatoscope

    Middle East Dermatoscopes by Technology

    LED

    Xenon

    Halogen

    Ultraviolet

    Middle East Dermatoscopes by Modality

    Handheld

    Trolley Mounted

    Headband

    Middle East Dermatoscopes by End Use

    Dermatology Clinics

    Hospitals

    Africa Outlook (USD Billion, 2018-2032)

    Africa Dermatoscopes by Type

    Contact Dermatoscope

    Hybrid Dermatoscope

    Noncontact Dermatoscope

    Africa Dermatoscopes by Technology

    LED

    Xenon

    Halogen

    Ultraviolet

    Africa Dermatoscopes by Modality

    Handheld

    Trolley Mounted

    Headband

    Africa Dermatoscopes by End Use

    Dermatology Clinics

    Hospitals

    Latin America Outlook (USD Billion, 2018-2032)

    Latin America Dermatoscopes by Type

    Contact Dermatoscope

    Hybrid Dermatoscope

    Noncontact Dermatoscope

    Latin America Dermatoscopes by Technology

    LED

    Xenon

    Halogen

    Ultraviolet

    Latin America Dermatoscopes by Modality

    Handheld

    Trolley Mounted

    Headband

    Latin America Dermatoscopes by End Use

    Dermatology Clinics

    Hospitals

    Infographic

    Free Sample Request

    Kindly complete the form below to receive a free sample of this Report

    Get Free Sample

    Customer Strories

    “I am very pleased with how market segments have been defined in a relevant way for my purposes (such as "Portable Freezers & refrigerators" and "last-mile"). In general the report is well structured. Thanks very much for your efforts.”

    Victoria Milne

    Founder
    Case Study
    Chemicals and Materials

    Compare Licence

    ×
    Features License Type
    Single User Multiuser License Enterprise User
    Price $4,950 $5,950 $7,250
    Maximum User Access Limit 1 User Upto 10 Users Unrestricted Access Throughout the Organization
    Free Customization
    Direct Access to Analyst
    Deliverable Format
    Platform Access
    Discount on Next Purchase 10% 15% 15%
    Printable Versions