• Cat-intel
  • MedIntelliX
  • Resources
  • About Us
  • Hero Background
    English
    Chinese
    French
    Japanese
    Korean
    German
    Spanish

    Dental Anesthesia Market Size

    ID: MRFR/Pharma/0271-CR
    110 Pages
    Rahul Gotadki
    November 2022

    Dental Anesthesia Market Research Report Information by Product Type (Lidocaine, Mepivacaine, Prilocaine, Bupivacaine 0.5% with epinephrine1:200,000, Articaine and Others), by Mode of Administration (Maxillary, Mandibular and Others) by Technique (Local Infiltration, Field Block and Nerve Block), by Duration of Action (Short, Medium and Long), by End User (Hospital Clinics, Clinics and Other), ...

    Share:
    Download PDF ×

    We do not share your information with anyone. However, we may send you emails based on your report interest from time to time. You may contact us at any time to opt-out.

    Dental Anesthesia Market Infographic
    $ 4,950.0
    $ 5,950.0
    $ 7,250.0

    Dental Anesthesia Size

    Dental Anesthesia Market Growth Projections and Opportunities

    Anesthesia, a pharmaceutical agent used to induce the loss of sensation, distinguishes itself from analgesics or painkillers by causing sensory loss rather than merely offering pain relief. The dental anesthesia market is witnessing rapid growth attributed to factors such as the expanding geriatric population, a rising incidence of various dental diseases, and the introduction of new products by key players and manufacturers. However, challenges arise from factors like the availability of skilled anesthesiologists and stringent regulatory guidelines across different regions. Dental anesthesia, integral to dentistry, encompasses the application of anesthesia through various means such as local anesthetics, sedation, and general anesthesia. Its primary role lies in managing patients' pain during dental procedures and surgeries. In terms of product types, the global dental anesthesia market is categorized into lidocaine, mepivacaine, prilocaine, bupivacaine, articaine, and other variants, including ropivacaine and chloroprocaine. The Lidocaine segment, contributing the most substantial market share of 28.0% in 2020, is anticipated to reach USD 291.68 million by 2027, growing at a CAGR of 5.83% during the forecast period.

    In considering the mode of administration, the global dental anesthesia market is segmented into maxillary, mandibular, and other methods. The maxillary segment holds the dominant market share at 51.9% in 2020, with an expected growth to USD 585.22 million by 2027, showcasing a CAGR of 5.56% during the forecast period.

    Further categorization based on technique includes local infiltration, field block, and nerve block. The nerve block segment leads with the largest market share at 47.9% in 2020, projected to reach USD 513.63 million by 2027, growing at a CAGR of 4.96% during the forecast period.

    Examining the duration of action, the global dental anesthesia market classifies into short, medium, and long. The medium duration segment commands the largest market share, comprising 50.9% in 2020, and is anticipated to reach USD 565.61 million by 2027, growing at a CAGR of 5.31% during the forecast period. Notably, the short duration segment is forecasted to exhibit the highest CAGR of 5.45%, reaching a market share of 38.5% by 2027.

    Considering end-user segments, the global dental anesthesia market is categorized into hospital clinics, clinics, and others. Clinics dominate with the largest market share at 53.1% in 2020, expected to reach USD 507.79 million by 2027, growing at a CAGR of 5.50% during the forecast period.

    In summary, the growth of the dental anesthesia market is propelled by demographic factors, technological advancements, and increased awareness. While challenges exist in terms of regulatory constraints and the need for skilled professionals, the market's trajectory remains optimistic. The comprehensive segmentation across product types, administration modes, techniques, duration of action, and end-user segments provides a nuanced understanding of the diverse dynamics influencing the growth and direction of the global dental anesthesia market.
    Dental Anesthesia Market Size Graph

    Market Summary

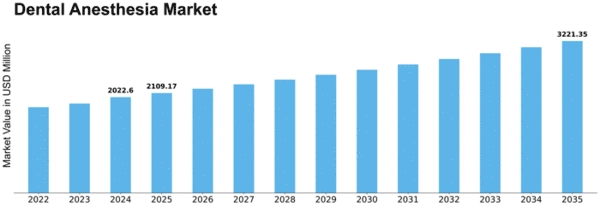
    As per Market Research Future Analysis, the dental anesthesia market is projected to reach USD 3.08 Billion by 2032, growing at a CAGR of 5.8% from 2024 to 2032. The market is driven by the increasing geriatric population, rising prevalence of dental diseases, and the introduction of innovative products. However, challenges such as a shortage of skilled anesthesiologists and strict regulatory guidelines may hinder growth. The COVID-19 pandemic has negatively impacted the market, leading to a decline in dental procedures and a shortage of anesthetic drugs globally. Despite these challenges, the demand for dental anesthesia is expected to rise due to the growing trend towards dental health check-ups and advancements in dental technology.

    Key Market Trends & Highlights

    Key trends influencing the dental anesthesia market include:

    • High prevalence of dental diseases affecting nearly 3.5 billion people globally (WHO, 2020). Increasing geriatric population contributing to higher demand for dental procedures. Shortage of anesthesiologists projected to reach 124,000 by 2034 (AAMC). Introduction of new dental anesthesia products enhancing patient care and comfort.

    Market Size & Forecast

    2024-2032 Market Size USD 3.08 Billion
    CAGR 5.8%
    Largest Regional Market Share in 2020 Americas (41.1%)

    Major Players

    <p>Dentsply Sirona (US), Septodont, Inc (France), AstraZeneca (UK), Primex Pharmaceuticals (Europe), 3M (US), Centrix, Inc (US), Cetylite, Inc (US), Crosstex International, Inc. (US), DMG America (US), Henry Schein, Inc. (US), Patterson Companies, Inc. (US), Pierrel SPA (Italy)</p>

    Market Trends

    Drivers

    High prevalence of dental diseases

    Periodontal disease, also known as gum disease, is mainly the result of infections and inflammation of the gums and bones surrounding and supporting the teeth. According to the WHO, in 2020, severe periodontal (gum) disease affected almost 10% of the global population. The increasing prevalence of such dental issues is accelerating the demand for oral screening and surgeries around the globe, further creating a demand for dental anesthesia. This is driving the global dental anesthesia market.

    Increasing trend towards dental health check-up Growing geriatric population worldwide

    Restraints

    Dearth of skilled anaesthesiologists

    Anesthesia is a vital medical specialty provided by highly skilled professionals such as certified registered nurse anesthetists (CRNAs) and anesthesiologists (ANs). Anesthesiologists evaluate, monitor, and supervise patient care before, during, and after surgery while delivering anesthesia. There is a shortage of skilled anesthesiologists across the globe. According to the Association of American Medical Colleges (AAMC), around 38,000 to 124,000 physicians are expected to be needed by 2034, with roughly 12,500 of them being anesthesiologists.

    Moreover, it is estimated that there are billions of people around the globe who lack access to safe surgery for various reasons, including the lack of trained anesthesia providers. People living in developing and developing countries have the fewest specialists who unduly affect their health care.  The shortage of anesthesiologists affects dental screening and treatment throughout the globe. Hence, the shortage of skilled anesthesiologists is hampering the global dental anesthesia market.
    Opportunity

    Introduction of new dental anesthesia products

    The introduction of new dental anesthesia products into the market is creating opportunities for players involved in the dental anesthesia market. The new technologically advanced dental products are used for superior patient care as well as to add comfort to professional practice. These advancements in products are making dental procedures faster and easier. For instance, in May 2017, Cetylite Inc. designed a new flavor of one of its flagship products, Cetacaine Topical Anesthetic Gel. Cetacaine aimed to feature a cool mint-flavored gel for oral anesthetic applications. It is primarily used to control pain and ease discomfort at the application site.

    Supply Chain Analysis

    The global market's supply chain analysis comprises five major components that start with the R&D and designing, manufacturing, distribution, marketing & sales, and post-sales monitoring.

    In R&D process, new drug designs are introduced to enhance product quality and mix them with advanced compositions. As there are a variety of products available in the market, many companies are investing in R&D for high-quality drug offerings. R&D is a brainstorming process and requires sound knowledge and skills. After the R&D is over, the developers start manufacturing dental anaesthesia based on the inputs. The stage is characterized by primarily four steps — conceptualization, product designing, product development, and testing to ensure quality standards.

    The cost of this process can be reduced by finding substitutes for the raw material or by modifying the conventional manufacturing process.

    Manufacturing is a fast process, which is followed by the testing of the product. After this, distribution, marketing & sales is the most crucial part of the supply chain. Distribution includes intermediaries, direct selling, online channels, and others. To increase awareness in the market, the leading players are conducting seminars and sessions, which give dental practitioners an idea about the availability of the new refined products. For this, a company's marketing and sales strategies play a crucial role in understanding the characteristics of the industry in which it is competing.

    The companies operating in the market are more inclined toward creating a subsidiary in a new region for better product reach and availability.

    And lastly, post-sales monitoring plays a very important role in this market. As the global market is competitive and patient-centric, post-sales monitoring is a must to understand product performance.

    <p>The increasing emphasis on patient comfort and safety in dental procedures appears to drive the evolution of innovative anesthesia techniques and products in the dental sector.</p>

    U.S. Food and Drug Administration (FDA)

    Dental Anesthesia Market Market Drivers

    Market Growth Projections

    The Global Dental Anesthesia Market Industry is projected to experience substantial growth over the next decade. With a market value of 1.48 USD Billion in 2024, it is anticipated to reach 3.65 USD Billion by 2035, reflecting a CAGR of 8.53% from 2025 to 2035. This growth is driven by various factors, including technological advancements, increasing dental procedures, and a growing geriatric population. The market's expansion indicates a robust demand for innovative anesthesia solutions that cater to diverse patient needs and preferences.

    Increasing Geriatric Population

    The Global Dental Anesthesia Market Industry is poised for growth due to the rising geriatric population, which often requires dental care and anesthesia for various procedures. As individuals age, they tend to experience more dental issues, necessitating treatments that involve anesthesia. This demographic shift is expected to drive market expansion, with the geriatric population projected to reach 1.5 billion by 2030. Consequently, the demand for safe and effective dental anesthesia solutions tailored to older patients will likely increase, further solidifying the industry's growth trajectory.

    Growing Awareness of Oral Health

    There is a growing awareness of oral health among the global population, which is positively influencing the Global Dental Anesthesia Market Industry. Educational campaigns and initiatives by health organizations are emphasizing the importance of regular dental check-ups and treatments. This heightened awareness is leading to an increase in dental visits, thereby driving the demand for anesthesia services. As the market evolves, it is expected that the focus on preventive care will continue to grow, resulting in a more significant need for effective dental anesthesia solutions to ensure patient comfort during procedures.

    Rising Demand for Dental Procedures

    The Global Dental Anesthesia Market Industry is experiencing a notable increase in demand for dental procedures, driven by a growing awareness of oral health and aesthetics. As more individuals seek cosmetic dental treatments, the need for effective anesthesia options rises. In 2024, the market is projected to reach 1.48 USD Billion, reflecting the increasing number of dental surgeries performed globally. This trend is likely to continue, as advancements in dental technology and techniques enhance patient experiences, thereby further propelling the demand for dental anesthesia solutions.

    Expansion of Dental Clinics and Practices

    The expansion of dental clinics and practices worldwide is a crucial driver for the Global Dental Anesthesia Market Industry. As more dental professionals establish practices, particularly in emerging economies, the demand for dental anesthesia is expected to rise. This expansion is facilitated by increased investments in healthcare infrastructure and the establishment of dental schools, which produce a steady stream of qualified practitioners. By 2035, the market is projected to reach 3.65 USD Billion, indicating a robust growth trajectory fueled by the proliferation of dental services and the corresponding need for anesthesia.

    Technological Advancements in Anesthesia Delivery

    Technological innovations in anesthesia delivery systems are significantly impacting the Global Dental Anesthesia Market Industry. The introduction of computer-controlled local anesthetic delivery systems and advanced monitoring devices enhances the precision and safety of anesthesia administration. These advancements not only improve patient comfort but also reduce the risk of complications during dental procedures. As a result, dental practitioners are increasingly adopting these technologies, contributing to the market's growth. The anticipated CAGR of 8.53% from 2025 to 2035 indicates a robust future for these innovations within the industry.

    Market Segment Insights

    Dental Anesthesia Product Type Insights

    <p>Global Dental Anesthesia Market Share (%), by Product Type Source: Market Research Future Analysis</p>

    <p>Lidocaine</p>

    <p>Lidocaine is the most used anesthetic in dental surgeries and procedures, which is further bifurcated into lidocaine 2% with epinephrine 1:100,000, lidocaine 2% with epinephrine 1:50,000, and lidocaineonly. Leading market players are developing cost-effective and painless administration of anesthetics, boosting the dental anesthetics market. The global dental anesthetics market is expected to introduce high-quality and efficient products in the upcoming years owing to great number of research activities funneled in the same. Further, advanced dental anesthetics have enabled healthcare professionals to perform complicated surgeries without compromising patients’ preference for minimal pain. These factors promote the growth of the market segment.</p>

    Dental Anesthesia Mode of Administration Insights

    <p>Maxillary</p>

    <p>The maxillary anesthesia is used to anesthetize the posterior superior alveolar nerve before it enters the posterior surface of the maxilla while it is in the infra-temporal fossa infra. It also helps to anesthetize the pulp, investing structures, and buccal mucoperiosteum of the maxillary molars except for the mesiobuccal root of the first molar. It is bifurcated into supraperiosteal injection, intraseptal injection, periodontal ligament injection, and periapical injection.</p>

    <p>Mandibular</p>

    Dental Anesthesia Technique Insights

    <p>Local infiltration</p>

    <p>Local infiltration (also known as supraperiosteal injection) is one of the most used techniques for achieving anesthesia of the maxillary dentition. This technique is indicated when an individual tooth is to be treated.</p>

    <p>Field Block</p>

    Dental Anesthesia Duration of Action Insights

    <p>Short</p>

    <p>Local anesthetics vary in their duration of action due to primarily differences in their affinity for protein. Like most drugs, local anesthetics reversibly bind to plasma proteins while circulating in the bloodstream. For example, lidocaine is the most used local anesthetic in the US.</p>

    <p>Medium</p>

    Dental Anesthesia End user Insights

    <p>Hospital clinics</p>

    <p>The dramatic rise in tooth restoration is attributed to the increasing number of tooth infections and disorders. This is because hospital clinics provide patients with dental restorations in a single visit. The health care system for the geriatric population is considered a major concern within the health care sector.</p>

    <p>Clinics</p>

    Dental Anesthesia Distribution Channel Insights

    <p>Pharmacies &amp; Drug Store</p>

    <p>Many drug stores across the globe maintain an internal pharmacy to support the patients and their family members. The increasing number of individuals, chain pharmacies, and drug stores also supports dental anesthesia sales. Pharmacies and drug stores are expected to hold a substantial market share due to the availability of medical experts such as dermatologists and neurologists, cancer specialists, and hospital accessibility.</p>

    <p>E-commerce</p>

    Get more detailed insights about Dental Anesthesia Market Research Report—Global Forecast till 2032

    Regional Insights

    Key Companies in the Dental Anesthesia Market market include

    Industry Developments

    In July 2021, Septodont acquired Sanofi’s four dental care brands Ultracain, Rodogyl, Birodogyl and Dontisolon. This acquisition was done to strengthen the parent company’s product offerings.

    In July 2019, OGNA expanded its market in Europe. This expansion aims to provide the product offering of the company in Europe region.

    In January 2018, Cetylite announced the launch of Cetacaine topical anaesthetic spray in a single-patient package. The single-patient spray eliminates the threat of cross-contamination caused by multiple patient usages. Moreover, Bar Code Medication Administration (BCMA) inclusion further enhances accuracy, averts medication errors, and improves efficiency.


    Future Outlook

    Dental Anesthesia Market Future Outlook

    <p>The Global Dental Anesthesia Market is projected to grow at 8.53% CAGR from 2024 to 2032, driven by technological advancements, increasing dental procedures, and rising patient awareness.</p>

    New opportunities lie in:

    • <p>Invest in innovative local anesthesia delivery systems to enhance patient comfort. Develop digital platforms for anesthesia management to streamline dental practices. Explore partnerships with dental clinics for bundled service offerings to increase market reach.</p>

    <p>By 2035, the market is expected to achieve substantial growth, reflecting evolving dental care demands.</p>

    Market Segmentation

    Dental Anesthesia End User Outlook

    • Hospital Clinics
    • Clinics
    • Other

    Dental Anesthesia Technique Outlook

    • Local Infiltration
    • Field Block
    • Nerve Block

    Dental Anesthesia Product Type Outlook

    • Lidocaine
    • Mepivacaine
    • Prilocaine
    • Bupivacaine 0.5% with epinephrine1:200,000
    • Articaine
    • Others

    Dental Anesthesia Duration of Action Outlook

    • Short
    • Medium
    • Long

    Dental Anesthesia Distribution Channel Outlook

    • Pharmacies And Drug Stores
    • E-Commerce
    • Other

    Dental Anesthesia Mode of Administration Outlook

    • Maxillary
    • Mandibular
    • Others

    Report Scope

    Attribute/MetricDetails
      Market Size  2032: USD 3.08 Billion
      CAGR  5.8%
      Base Year  2023
      Forecast Period  2024-2032
      Historical Data  2020
      Forecast Units  Value (USD Billion)
      Report Coverage  Revenue Forecast, Competitive Landscape, Growth Factors and Trends
      Segments Covered  Type, Deployment, End User, and Region
      Geographies Covered  Americas, Europe, Asia-Pacific, Middle East & Africa
      Key Vendors  Dentsply Sirona (US), Septodont, Inc. (France), AstraZeneca (UK), Primex Pharmaceuticals (Europe), 3m (US), Centrix, Inc (US), Cetylite, Inc (US), Crosstex International, Inc. (US), Dmg America (US), Henry Schein, Inc. (US), Patterson Companies, Inc. (US), Pierrel SPA (Italy)
      Key Market Opportunities  • Introduction of new dental products
      Key Market Drivers  • High prevalence of dental diseases • Increasing trend towards dental health check-up • Growing geriatric population worldwide

    Market Highlights

    Author

    Rahul Gotadki
    Assistant Manager

    She holds an experience of about 6+ years in market research and business consulting, working under the spectrum of information communication technology, telecommunications and semiconductor domains. aarti conceptualizes and implements a scalable business strategy and provides strategic leadership to the clients. her expertise lies in market estimation, competitive intelligence, pipeline analysis, customer assessment, etc.

    Leave a Comment

    Latest Comments

    John Doe
    john@example.com

    This is a great article! Really helped me understand the topic better.

    Posted on July 23, 2025, 10:15 AM
    Jane Smith
    jane@domain.com

    Thanks for sharing this. I’ve bookmarked it for later reference.

    Posted on July 22, 2025, 7:45 PM

    FAQs

    What is the CAGR of the Dental Anesthesia Market?

    Dental Anesthesia Market is expected to exhibit a strong 5.8% CAGR over the forecast period from 2024-2032.

    What is the major driver for the Dental Anesthesia Market?

    Growing awareness about dental health and the increasing volume of dental procedures is the major driver for the Dental Anesthesia Market.

    What is the key restraint on the Dental Anesthesia Market?

    The unavailability of skilled anesthetists is a key restraint on the Global Dental Anesthesia Market.

    Which is the leading regional Dental Anesthesia Market?

    The Americas dominate the Global Dental Anesthesia Market.

    What are the leading Dental Anesthesia Market players?

    Leading players in the Global Dental Anesthesia Market include GSK, Dentsply Sirona, and Septodont, among others.

    1. List of Tables and Figures
      1. Table LIST OF ASSUMPTIONS & LIMITATIONS
      2. Table GLOBAL: DENTAL ANESTHESIA MARKET, BY PRODUCT TYPE, 2018-2027 (USD MILLION)
      3. Table GLOBAL: DENTAL ANESTHESIA MARKET, FOR LIDOCAINE, BY TYPE, 2018–2027 (USD MILLION)
      4. Table GLOBAL: DENTAL ANESTHESIA MARKET, FOR LIDOCAINE 2% WITH EPINEPHRINE 1:100,000, BY REGION, 2018–2027 (USD MILLION)
      5. Table GLOBAL: DENTAL ANESTHESIA MARKET, FOR LIDOCAINE 2% WITH EPINEPHRINE 1:50,000, BY REGION, 2018–2027 (USD MILLION)
      6. Table GLOBAL: DENTAL ANESTHESIA MARKET, FOR LIDOCAINE PLAIN, BY REGION, 2018–2027 (USD MILLION)
      7. Table GLOBAL: DENTAL ANESTHESIA MARKET, FOR MEPIVACAINE, BY TYPE, 2018–2027 (USD MILLION)
      8. Table GLOBAL: DENTAL ANESTHESIA MARKET, FOR MEPIVACAINE 2% WITH LEVONORDEFRIN 1:20,000, BY REGION, 2018–2027 (USD MILLION)
      9. Table GLOBAL: DENTAL ANESTHESIA MARKET, FOR MEPIVACAINE 3%, BY REGION, 2018–2027 (USD MILLION)
      10. Table GLOBAL: DENTAL ANESTHESIA MARKET, FOR PRILOCAINE, BY TYPE, 2018–2027 (USD MILLION)
      11. Table GLOBAL: DENTAL ANESTHESIA MARKET, FOR PRILOCAINE 4% WITH EPINEPHRINE 1:200,000, BY REGION, 2018–2027 (USD MILLION)
      12. Table GLOBAL: DENTAL ANESTHESIA MARKET, FOR PRILOCAINE 4%, BY REGION, 2018–2027 (USD MILLION)
      13. Table GLOBAL: DENTAL ANESTHESIA MARKET, FOR BUPIVACAINE 0.5% WITH EPINEPHRINE1:200,000, 2018–2027 (USD MILLION)
      14. Table GLOBAL: DENTAL ANESTHESIA MARKET, FOR ARTICAINE, BY TYPE, 2018–2027 (USD MILLION)
      15. Table GLOBAL: DENTAL ANESTHESIA MARKET, FOR ARTICAINE 4% WITH EPINEPHRINE 1:100,00, BY REGION, 2018–2027 (USD MILLION)
      16. Table GLOBAL: DENTAL ANESTHESIA MARKET, FOR ARTICAINE 4% WITH EPINEPHRINE 1:200,000, BY REGION, 2018–2027 (USD MILLION)
      17. Table GLOBAL: DENTAL ANESTHESIA MARKET, FOR OTHERS, 2018–2027 (USD MILLION)
      18. Table GLOBAL: DENTAL ANESTHESIA MARKET, BY MODE OF ADMINISTRATION, 2018–2027 (USD MILLION)
      19. Table GLOBAL: DENTAL ANESTHESIA MARKET, FOR MAXILLARY, BY TYPE, 2018–2027 (USD MILLION)
      20. Table GLOBAL: DENTAL ANESTHESIA MARKET, FOR SUPRAPERIOSTEAL INJECTION, BY REGION, 2018–2027 (USD MILLION)
      21. Table GLOBAL: DENTAL ANESTHESIA MARKET, FOR INTRASEPTAL INJECTION, BY REGION, 2018–2027 (USD MILLION)
      22. Table GLOBAL: DENTAL ANESTHESIA MARKET, FOR PERIODONTAL LIGAMENT INJECTION, BY REGION, 2018–2027 (USD MILLION)
      23. Table GLOBAL: DENTAL ANESTHESIA MARKET, FOR PERIAPICAL INJECTION, BY REGION, 2018–2027 (USD MILLION)
      24. Table GLOBAL: DENTAL ANESTHESIA MARKET, FOR MANDIBULAR, BY TYPE, 2018–2027 (USD MILLION)
      25. Table GLOBAL: DENTAL ANESTHESIA MARKET, FOR IAN, BY REGION, 2018–2027 (USD MILLION)
      26. Table GLOBAL: DENTAL ANESTHESIA MARKET, FOR AKINOSI, BY REGION, 2018–2027 (USD MILLION)
      27. Table GLOBAL: DENTAL ANESTHESIA MARKET, FOR GOW-GATES, BY REGION, 2018–2027 (USD MILLION)
      28. Table GLOBAL: DENTAL ANESTHESIA MARKET, FOR TISSUE OR SKIN, BY REGION, 2018–2027 (USD MILLION)
      29. Table GLOBAL: DENTAL ANESTHESIA MARKET, FOR OTHERS, 2018–2027 (USD MILLION)
      30. Table GLOBAL: DENTAL ANESTHESIA MARKET, BY TECHNIQUE, 2018–2027 (USD MILLION)
      31. Table GLOBAL: DENTAL ANESTHESIA MARKET, FOR LOCAL INFILTRATION, BY REGION, 2018–2027 (USD MILLION)
      32. Table GLOBAL: DENTAL ANESTHESIA MARKET, FOR FIELD BLOCK, BY REGION, 2018–2027 (USD MILLION)
      33. Table GLOBAL: DENTAL ANESTHESIA MARKET, FOR NERVE BLOCK, BY REGION, 2018–2027 (USD MILLION)
      34. Table GLOBAL: DENTAL ANESTHESIA MARKET, FOR NERVE BLOCK, BY TYPE, 2018–2027 (USD MILLION)
      35. Table GLOBAL: DENTAL ANESTHESIA MARKET, FOR POSTERIOR SUPERIOR ALVEOLAR, BY REGION, 2018–2027 (USD MILLION)
      36. Table GLOBAL: DENTAL ANESTHESIA MARKET, FOR MIDDLE SUPERIOR ALVEOLAR, BY REGION, 2018–2027 (USD MILLION)
      37. Table GLOBAL: DENTAL ANESTHESIA MARKET, FOR ANTERIOR SUPERIOR ALVEOLAR, BY REGION, 2018–2027 (USD MILLION)
      38. Table GLOBAL: DENTAL ANESTHESIA MARKET, BY DURATION OF ACTION, 2018–2027 (USD MILLION)
      39. Table GLOBAL: DENTAL ANESTHESIA MARKET, FOR SHORT, BY REGION, 2018–2027 (USD MILLION)
      40. Table GLOBAL: DENTAL ANESTHESIA MARKET, FOR MEDIUM, BY REGION, 2018–2027 (USD MILLION)
      41. Table GLOBAL: DENTAL ANESTHESIA MARKET, FOR LONG, BY REGION, 2018–2027 (USD MILLION)
      42. Table GLOBAL: DENTAL ANESTHESIA MARKET, BY END USER, 2018–2027 (USD MILLION)
      43. Table GLOBAL: DENTAL ANESTHESIA MARKET, FOR HOSPITAL CLINICS, BY REGION, 2018–2027 (USD MILLION)
      44. Table GLOBAL: DENTAL ANESTHESIA MARKET, FOR CLINICS, BY REGION, 2018–2027 (USD MILLION)
      45. Table GLOBAL: DENTAL ANESTHESIA MARKET, FOR OTHER, BY REGION, 2018–2027 (USD MILLION)
      46. Table GLOBAL: DENTAL ANESTHESIA MARKET, BY DISTRIBUTION CHANNEL, 2018–2027 (USD MILLION)
      47. Table GLOBAL: DENTAL ANESTHESIA MARKET, FOR PHARMACIES AND DRUG STORES, BY REGION, 2018–2027 (USD MILLION)
      48. Table GLOBAL: DENTAL ANESTHESIA MARKET, FOR E-COMMERCE, BY REGION, 2018–2027 (USD MILLION)
      49. Table GLOBAL: DENTAL ANESTHESIA MARKET, FOR OTHER, BY REGION, 2018–2027 (USD MILLION)
      50. Table GLOBAL: DENTAL ANESTHESIA MARKET, BY REGION, 2018–2027 (USD MILLION)
      51. Table AMERICAS: DENTAL ANESTHESIA MARKET, BY REGION, 2018–2027 (USD MILLION)
      52. Table AMERICAS: DENTAL ANESTHESIA MARKET, BY PRODUCT TYPE, 2018–2027 (USD MILLION)
      53. Table AMERICAS: DENTAL ANESTHESIA MARKET FOR LIDOCAINE, BY TYPE, 2018–2027 (USD MILLION)
      54. Table AMERICAS: DENTAL ANESTHESIA MARKET FOR MEPIVACAINE, BY TYPE, 2018–2027 (USD MILLION)
      55. Table AMERICAS: DENTAL ANESTHESIA MARKET FOR PRILOCAINE, BY TYPE, 2018–2027 (USD MILLION)
      56. Table AMERICAS: DENTAL ANESTHESIA MARKET ARTICAINE, BY TYPE, 2018–2027 (USD MILLION)
      57. Table AMERICAS: DENTAL ANESTHESIA MARKET, BY MODE OF ADMINISTRATION, 2018–2027 (USD MILLION)
      58. Table AMERICAS: DENTAL ANESTHESIA MARKET MAXILLARY, BY TYPE, 2018–2027 (USD MILLION)
      59. Table AMERICAS: DENTAL ANESTHESIA MARKET MANDIBULAR, BY TYPE, 2018–2027 (USD MILLION)
      60. Table AMERICAS: DENTAL ANESTHESIA MARKET, BY TECHNIQUE, 2018–2027 (USD MILLION)
      61. Table AMERICAS: DENTAL ANESTHESIA MARKET NERVE BLOCK, BY TYPE, 2018–2027 (USD MILLION)
      62. Table AMERICAS: DENTAL ANESTHESIA MARKET, BY DURATION OF ACTION, 2018–2027 (USD MILLION)
      63. Table AMERICAS: DENTAL ANESTHESIA MARKET, BY END USER, 2018–2027 (USD MILLION)
      64. Table AMERICAS: DENTAL ANESTHESIA MARKET, BY DISTRIBUTION CHANNEL, 2018–2027 (USD MILLION)
      65. Table NORTH AMERICA: DENTAL ANESTHESIA MARKET, BY REGION, 2018–2027 (USD MILLION)
      66. Table NORTH AMERICA: DENTAL ANESTHESIA MARKET, BY PRODUCT TYPE, 2018–2027 (USD MILLION)
      67. Table NORTH AMERICA: DENTAL ANESTHESIA MARKET FOR LIDOCAINE, BY TYPE, 2018–2027 (USD MILLION)
      68. Table NORTH AMERICA: DENTAL ANESTHESIA MARKET FOR MEPIVACAINE, BY TYPE, 2018–2027 (USD MILLION)
      69. Table NORTH AMERICA: DENTAL ANESTHESIA MARKET FOR PRILOCAINE, BY TYPE, 2018–2027 (USD MILLION)
      70. Table NORTH AMERICA: DENTAL ANESTHESIA MARKET ARTICAINE, BY TYPE, 2018–2027 (USD MILLION)
      71. Table NORTH AMERICA: DENTAL ANESTHESIA MARKET, BY MODE OF ADMINISTRATION, 2018–2027 (USD MILLION)
      72. Table NORTH AMERICA: DENTAL ANESTHESIA MARKET MAXILLARY, BY TYPE, 2018–2027 (USD MILLION)
      73. Table NORTH AMERICA: DENTAL ANESTHESIA MARKET MANDIBULAR, BY TYPE, 2018–2027 (USD MILLION)
      74. Table NORTH AMERICA: DENTAL ANESTHESIA MARKET, BY TECHNIQUE, 2018–2027 (USD MILLION)
      75. Table NORTH AMERICA: DENTAL ANESTHESIA MARKET NERVE BLOCK, BY TYPE, 2018–2027 (USD MILLION)
      76. Table NORTH AMERICA: DENTAL ANESTHESIA MARKET, BY DURATION OF ACTION, 2018–2027 (USD MILLION)
      77. Table NORTH AMERICA: DENTAL ANESTHESIA MARKET, BY END USER, 2018–2027 (USD MILLION)
      78. Table NORTH AMERICA: DENTAL ANESTHESIA MARKET, BY DISTRIBUTION CHANNEL, 2018–2027 (USD MILLION)
      79. Table US: DENTAL ANESTHESIA MARKET, BY PRODUCT TYPE, 2018–2027 (USD MILLION)
      80. Table US: DENTAL ANESTHESIA MARKET FOR LIDOCAINE, BY TYPE, 2018–2027 (USD MILLION)
      81. Table US: DENTAL ANESTHESIA MARKET FOR MEPIVACAINE, BY TYPE, 2018–2027 (USD MILLION)
      82. Table US: DENTAL ANESTHESIA MARKET FOR PRILOCAINE, BY TYPE, 2018–2027 (USD MILLION)
      83. Table US: DENTAL ANESTHESIA MARKET ARTICAINE, BY TYPE, 2018–2027 (USD MILLION)
      84. Table US: DENTAL ANESTHESIA MARKET, BY MODE OF ADMINISTRATION, 2018–2027 (USD MILLION)
      85. Table US: DENTAL ANESTHESIA MARKET MAXILLARY, BY TYPE, 2018–2027 (USD MILLION)
      86. Table US: DENTAL ANESTHESIA MARKET MANDIBULAR, BY TYPE, 2018–2027 (USD MILLION)
      87. Table US: DENTAL ANESTHESIA MARKET, BY TECHNIQUE, 2018–2027 (USD MILLION)
      88. Table US: DENTAL ANESTHESIA MARKET NERVE BLOCK, BY TYPE, 2018–2027 (USD MILLION)
      89. Table US: DENTAL ANESTHESIA MARKET, BY DURATION OF ACTION, 2018–2027 (USD MILLION)
      90. Table US: DENTAL ANESTHESIA MARKET, BY END USER, 2018–2027 (USD MILLION)
      91. Table US: DENTAL ANESTHESIA MARKET, BY DISTRIBUTION CHANNEL, 2018–2027 (USD MILLION)
      92. Table CANADA: DENTAL ANESTHESIA MARKET, BY PRODUCT TYPE, 2018–2027 (USD MILLION)
      93. Table CANADA: DENTAL ANESTHESIA MARKET FOR LIDOCAINE, BY TYPE, 2018–2027 (USD MILLION)
      94. Table CANADA: DENTAL ANESTHESIA MARKET FOR MEPIVACAINE, BY TYPE, 2018–2027 (USD MILLION)
      95. Table CANADA: DENTAL ANESTHESIA MARKET FOR PRILOCAINE, BY TYPE, 2018–2027 (USD MILLION)
      96. Table CANADA: DENTAL ANESTHESIA MARKET ARTICAINE, BY TYPE, 2018–2027 (USD MILLION)
      97. Table CANADA: DENTAL ANESTHESIA MARKET, BY MODE OF ADMINISTRATION, 2018–2027 (USD MILLION)
      98. Table CANADA: DENTAL ANESTHESIA MARKET MAXILLARY, BY TYPE, 2018–2027 (USD MILLION)
      99. Table CANADA: DENTAL ANESTHESIA MARKET MANDIBULAR, BY TYPE, 2018–2027 (USD MILLION)
      100. Table CANADA: DENTAL ANESTHESIA MARKET, BY TECHNIQUE, 2018–2027 (USD MILLION)
      101. Table CANADA: DENTAL ANESTHESIA MARKET NERVE BLOCK, BY TYPE, 2018–2027 (USD MILLION)
      102. Table CANADA: DENTAL ANESTHESIA MARKET, BY DURATION OF ACTION, 2018–2027 (USD MILLION)
      103. Table CANADA: DENTAL ANESTHESIA MARKET, BY END USER, 2018–2027 (USD MILLION)
      104. Table CANADA: DENTAL ANESTHESIA MARKET, BY DISTRIBUTION CHANNEL, 2018–2027 (USD MILLION)
      105. Table SOUTH AMERICA: DENTAL ANESTHESIA MARKET, BY PRODUCT TYPE, 2018–2027 (USD MILLION)
      106. Table SOUTH AMERICA: DENTAL ANESTHESIA MARKET FOR LIDOCAINE, BY TYPE, 2018–2027 (USD MILLION)
      107. Table SOUTH AMERICA: DENTAL ANESTHESIA MARKET FOR MEPIVACAINE, BY TYPE, 2018–2027 (USD MILLION)
      108. Table SOUTH AMERICA: DENTAL ANESTHESIA MARKET FOR PRILOCAINE, BY TYPE, 2018–2027 (USD MILLION)
      109. Table SOUTH AMERICA: DENTAL ANESTHESIA MARKET ARTICAINE, BY TYPE, 2018–2027 (USD MILLION)
      110. Table SOUTH AMERICA: DENTAL ANESTHESIA MARKET, BY MODE OF ADMINISTRATION, 2018–2027 (USD MILLION)
      111. Table SOUTH AMERICA: DENTAL ANESTHESIA MARKET MAXILLARY, BY TYPE, 2018–2027 (USD MILLION)
      112. Table SOUTH AMERICA: DENTAL ANESTHESIA MARKET MANDIBULAR, BY TYPE, 2018–2027 (USD MILLION)
      113. Table SOUTH AMERICA: DENTAL ANESTHESIA MARKET, BY TECHNIQUE, 2018–2027 (USD MILLION)
      114. Table SOUTH AMERICA: DENTAL ANESTHESIA MARKET NERVE BLOCK, BY TYPE, 2018–2027 (USD MILLION)
      115. Table SOUTH AMERICA: DENTAL ANESTHESIA MARKET, BY DURATION OF ACTION, 2018–2027 (USD MILLION)
      116. Table SOUTH AMERICA: DENTAL ANESTHESIA MARKET, BY END USER, 2018–2027 (USD MILLION)
      117. Table SOUTH AMERICA: DENTAL ANESTHESIA MARKET, BY DISTRIBUTION CHANNEL, 2018–2027 (USD MILLION)
      118. Table EUROPE: DENTAL ANESTHESIA MARKET, BY REGION, 2018–2027 (USD MILLION)
      119. Table EUROPE: DENTAL ANESTHESIA MARKET, BY PRODUCT TYPE, 2018–2027 (USD MILLION)
      120. Table EUROPE: DENTAL ANESTHESIA MARKET FOR LIDOCAINE, BY TYPE, 2018–2027 (USD MILLION)
      121. Table EUROPE: DENTAL ANESTHESIA MARKET FOR MEPIVACAINE, BY TYPE, 2018–2027 (USD MILLION)
      122. Table EUROPE: DENTAL ANESTHESIA MARKET FOR PRILOCAINE, BY TYPE, 2018–2027 (USD MILLION)
      123. Table EUROPE: DENTAL ANESTHESIA MARKET ARTICAINE, BY TYPE, 2018–2027 (USD MILLION)
      124. Table EUROPE: DENTAL ANESTHESIA MARKET, BY MODE OF ADMINISTRATION, 2018–2027 (USD MILLION)
      125. Table EUROPE: DENTAL ANESTHESIA MARKET MAXILLARY, BY TYPE, 2018–2027 (USD MILLION)
      126. Table EUROPE: DENTAL ANESTHESIA MARKET MANDIBULAR, BY TYPE, 2018–2027 (USD MILLION)
      127. Table EUROPE: DENTAL ANESTHESIA MARKET, BY TECHNIQUE, 2018–2027 (USD MILLION)
      128. Table EUROPE: DENTAL ANESTHESIA MARKET NERVE BLOCK, BY TYPE, 2018–2027 (USD MILLION)
      129. Table EUROPE: DENTAL ANESTHESIA MARKET, BY DURATION OF ACTION, 2018–2027 (USD MILLION)
      130. Table EUROPE: DENTAL ANESTHESIA MARKET, BY END USER, 2018–2027 (USD MILLION)
      131. Table EUROPE: DENTAL ANESTHESIA MARKET, BY DISTRIBUTION CHANNEL, 2018–2027 (USD MILLION)
      132. Table WESTERN EUROPE: DENTAL ANESTHESIA MARKET, BY COUNTRY, 2018–2027 (USD MILLION)
      133. Table WESTERN EUROPE: DENTAL ANESTHESIA MARKET, BY PRODUCT TYPE, 2018–2027 (USD MILLION)
      134. Table WESTERN EUROPE: DENTAL ANESTHESIA MARKET FOR LIDOCAINE, BY TYPE, 2018–2027 (USD MILLION)
      135. Table WESTERN EUROPE: DENTAL ANESTHESIA MARKET FOR MEPIVACAINE, BY TYPE, 2018–2027 (USD MILLION)
      136. Table WESTERN EUROPE: DENTAL ANESTHESIA MARKET FOR PRILOCAINE, BY TYPE, 2018–2027 (USD MILLION)
      137. Table WESTERN EUROPE: DENTAL ANESTHESIA MARKET ARTICAINE, BY TYPE, 2018–2027 (USD MILLION)
      138. Table WESTERN EUROPE: DENTAL ANESTHESIA MARKET, BY MODE OF ADMINISTRATION, 2018–2027 (USD MILLION)
      139. Table WESTERN EUROPE: DENTAL ANESTHESIA MARKET MAXILLARY, BY TYPE, 2018–2027 (USD MILLION)
      140. Table WESTERN EUROPE: DENTAL ANESTHESIA MARKET MANDIBULAR, BY TYPE, 2018–2027 (USD MILLION)
      141. Table WESTERN EUROPE: DENTAL ANESTHESIA MARKET, BY TECHNIQUE, 2018–2027 (USD MILLION)
      142. Table WESTERN EUROPE: DENTAL ANESTHESIA MARKET NERVE BLOCK, BY TYPE, 2018–2027 (USD MILLION)
      143. Table WESTERN EUROPE: DENTAL ANESTHESIA MARKET, BY DURATION OF ACTION, 2018–2027 (USD MILLION)
      144. Table WESTERN EUROPE: DENTAL ANESTHESIA MARKET, BY END USER, 2018–2027 (USD MILLION)
      145. Table WESTERN EUROPE: DENTAL ANESTHESIA MARKET, BY DISTRIBUTION CHANNEL, 2018–2027 (USD MILLION)
      146. Table GERMANY: DENTAL ANESTHESIA MARKET, BY PRODUCT TYPE, 2018–2027 (USD MILLION)
      147. Table GERMANY: DENTAL ANESTHESIA MARKET FOR LIDOCAINE, BY TYPE, 2018–2027 (USD MILLION)
      148. Table GERMANY: DENTAL ANESTHESIA MARKET FOR MEPIVACAINE, BY TYPE, 2018–2027 (USD MILLION)
      149. Table GERMANY: DENTAL ANESTHESIA MARKET FOR PRILOCAINE, BY TYPE, 2018–2027 (USD MILLION)
      150. Table GERMANY: DENTAL ANESTHESIA MARKET ARTICAINE, BY TYPE, 2018–2027 (USD MILLION)
      151. Table GERMANY: DENTAL ANESTHESIA MARKET, BY MODE OF ADMINISTRATION, 2018–2027 (USD MILLION)
      152. Table GERMANY: DENTAL ANESTHESIA MARKET MAXILLARY, BY TYPE, 2018–2027 (USD MILLION)
      153. Table GERMANY: DENTAL ANESTHESIA MARKET MANDIBULAR, BY TYPE, 2018–2027 (USD MILLION)
      154. Table GERMANY: DENTAL ANESTHESIA MARKET, BY TECHNIQUE, 2018–2027 (USD MILLION)
      155. Table GERMANY: DENTAL ANESTHESIA MARKET NERVE BLOCK, BY TYPE, 2018–2027 (USD MILLION)
      156. Table GERMANY: DENTAL ANESTHESIA MARKET, BY DURATION OF ACTION, 2018–2027 (USD MILLION)
      157. Table GERMANY: DENTAL ANESTHESIA MARKET, BY END USER, 2018–2027 (USD MILLION)
      158. Table GERMANY: DENTAL ANESTHESIA MARKET, BY DISTRIBUTION CHANNEL, 2018–2027 (USD MILLION)
      159. Table FRANCE: DENTAL ANESTHESIA MARKET, BY PRODUCT TYPE, 2018–2027 (USD MILLION)
      160. Table FRANCE: DENTAL ANESTHESIA MARKET FOR LIDOCAINE, BY TYPE, 2018–2027 (USD MILLION)
      161. Table FRANCE: DENTAL ANESTHESIA MARKET FOR MEPIVACAINE, BY TYPE, 2018–2027 (USD MILLION)
      162. Table FRANCE: DENTAL ANESTHESIA MARKET FOR PRILOCAINE, BY TYPE, 2018–2027 (USD MILLION)
      163. Table FRANCE: DENTAL ANESTHESIA MARKET ARTICAINE, BY TYPE, 2018–2027 (USD MILLION)
      164. Table FRANCE: DENTAL ANESTHESIA MARKET, BY MODE OF ADMINISTRATION, 2018–2027 (USD MILLION)
      165. Table FRANCE: DENTAL ANESTHESIA MARKET MAXILLARY, BY TYPE, 2018–2027 (USD MILLION)
      166. Table FRANCE: DENTAL ANESTHESIA MARKET MANDIBULAR, BY TYPE, 2018–2027 (USD MILLION)
      167. Table FRANCE: DENTAL ANESTHESIA MARKET, BY TECHNIQUE, 2018–2027 (USD MILLION)
      168. Table FRANCE: DENTAL ANESTHESIA MARKET NERVE BLOCK, BY TYPE, 2018–2027 (USD MILLION)
      169. Table FRANCE: DENTAL ANESTHESIA MARKET, BY DURATION OF ACTION, 2018–2027 (USD MILLION)
      170. Table FRANCE: DENTAL ANESTHESIA MARKET, BY END USER, 2018–2027 (USD MILLION)
      171. Table FRANCE: DENTAL ANESTHESIA MARKET, BY DISTRIBUTION CHANNEL, 2018–2027 (USD MILLION)
      172. Table UK: DENTAL ANESTHESIA MARKET, BY PRODUCT TYPE, 2018–2027 (USD MILLION)
      173. Table UK: DENTAL ANESTHESIA MARKET FOR LIDOCAINE, BY TYPE, 2018–2027 (USD MILLION)
      174. Table UK: DENTAL ANESTHESIA MARKET FOR MEPIVACAINE, BY TYPE, 2018–2027 (USD MILLION)
      175. Table UK: DENTAL ANESTHESIA MARKET FOR PRILOCAINE, BY TYPE, 2018–2027 (USD MILLION)
      176. Table UK: DENTAL ANESTHESIA MARKET ARTICAINE, BY TYPE, 2018–2027 (USD MILLION)
      177. Table UK: DENTAL ANESTHESIA MARKET, BY MODE OF ADMINISTRATION, 2018–2027 (USD MILLION)
      178. Table UK: DENTAL ANESTHESIA MARKET MAXILLARY, BY TYPE, 2018–2027 (USD MILLION)
      179. Table UK: DENTAL ANESTHESIA MARKET MANDIBULAR, BY TYPE, 2018–2027 (USD MILLION)
      180. Table UK: DENTAL ANESTHESIA MARKET, BY TECHNIQUE, 2018–2027 (USD MILLION)
      181. Table UK: DENTAL ANESTHESIA MARKET NERVE BLOCK, BY TYPE, 2018–2027 (USD MILLION)
      182. Table UK: DENTAL ANESTHESIA MARKET, BY DURATION OF ACTION, 2018–2027 (USD MILLION)
      183. Table UK: DENTAL ANESTHESIA MARKET, BY END USER, 2018–2027 (USD MILLION)
      184. Table UK: DENTAL ANESTHESIA MARKET, BY DISTRIBUTION CHANNEL, 2018–2027 (USD MILLION)
      185. Table ITALY: DENTAL ANESTHESIA MARKET, BY PRODUCT TYPE, 2018–2027 (USD MILLION)
      186. Table ITALY: DENTAL ANESTHESIA MARKET FOR LIDOCAINE, BY TYPE, 2018–2027 (USD MILLION)
      187. Table ITALY: DENTAL ANESTHESIA MARKET FOR MEPIVACAINE, BY TYPE, 2018–2027 (USD MILLION)
      188. Table ITALY: DENTAL ANESTHESIA MARKET FOR PRILOCAINE, BY TYPE, 2018–2027 (USD MILLION)
      189. Table ITALY: DENTAL ANESTHESIA MARKET ARTICAINE, BY TYPE, 2018–2027 (USD MILLION)
      190. Table ITALY: DENTAL ANESTHESIA MARKET, BY MODE OF ADMINISTRATION, 2018–2027 (USD MILLION)
      191. Table ITALY: DENTAL ANESTHESIA MARKET MAXILLARY, BY TYPE, 2018–2027 (USD MILLION)
      192. Table ITALY: DENTAL ANESTHESIA MARKET MANDIBULAR, BY TYPE, 2018–2027 (USD MILLION)
      193. Table ITALY: DENTAL ANESTHESIA MARKET, BY TECHNIQUE, 2018–2027 (USD MILLION)
      194. Table ITALY: DENTAL ANESTHESIA MARKET NERVE BLOCK, BY TYPE, 2018–2027 (USD MILLION)
      195. Table ITALY: DENTAL ANESTHESIA MARKET, BY DURATION OF ACTION, 2018–2027 (USD MILLION)
      196. Table ITALY: DENTAL ANESTHESIA MARKET, BY END USER, 2018–2027 (USD MILLION)
      197. Table ITALY: DENTAL ANESTHESIA MARKET, BY DISTRIBUTION CHANNEL, 2018–2027 (USD MILLION)
      198. Table SPAIN: DENTAL ANESTHESIA MARKET, BY PRODUCT TYPE, 2018–2027 (USD MILLION)
      199. Table SPAIN: DENTAL ANESTHESIA MARKET FOR LIDOCAINE, BY TYPE, 2018–2027 (USD MILLION)
      200. Table SPAIN: DENTAL ANESTHESIA MARKET FOR MEPIVACAINE, BY TYPE, 2018–2027 (USD MILLION)
      201. Table SPAIN: DENTAL ANESTHESIA MARKET FOR PRILOCAINE, BY TYPE, 2018–2027 (USD MILLION)
      202. Table SPAIN: DENTAL ANESTHESIA MARKET ARTICAINE, BY TYPE, 2018–2027 (USD MILLION)
      203. Table SPAIN: DENTAL ANESTHESIA MARKET, BY MODE OF ADMINISTRATION, 2018–2027 (USD MILLION)
      204. Table SPAIN: DENTAL ANESTHESIA MARKET MAXILLARY, BY TYPE, 2018–2027 (USD MILLION)
      205. Table SPAIN: DENTAL ANESTHESIA MARKET MANDIBULAR, BY TYPE, 2018–2027 (USD MILLION)
      206. Table SPAIN: DENTAL ANESTHESIA MARKET, BY TECHNIQUE, 2018–2027 (USD MILLION)
      207. Table SPAIN: DENTAL ANESTHESIA MARKET NERVE BLOCK, BY TYPE, 2018–2027 (USD MILLION)
      208. Table SPAIN: DENTAL ANESTHESIA MARKET, BY DURATION OF ACTION, 2018–2027 (USD MILLION)
      209. Table SPAIN: DENTAL ANESTHESIA MARKET, BY END USER, 2018–2027 (USD MILLION)
      210. Table SPAIN: DENTAL ANESTHESIA MARKET, BY DISTRIBUTION CHANNEL, 2018–2027 (USD MILLION)
      211. Table REST OF WESTERN EUROPE: DENTAL ANESTHESIA MARKET, BY PRODUCT TYPE, 2018–2027 (USD MILLION)
      212. Table REST OF WESTERN EUROPE: DENTAL ANESTHESIA MARKET FOR LIDOCAINE, BY TYPE, 2018–2027 (USD MILLION)
      213. Table REST OF WESTERN EUROPE: DENTAL ANESTHESIA MARKET FOR MEPIVACAINE, BY TYPE, 2018–2027 (USD MILLION)
      214. Table REST OF WESTERN EUROPE: DENTAL ANESTHESIA MARKET FOR PRILOCAINE, BY TYPE, 2018–2027 (USD MILLION)
      215. Table REST OF WESTERN EUROPE: DENTAL ANESTHESIA MARKET ARTICAINE, BY TYPE, 2018–2027 (USD MILLION)
      216. Table REST OF WESTERN EUROPE: DENTAL ANESTHESIA MARKET, BY MODE OF ADMINISTRATION, 2018–2027 (USD MILLION)
      217. Table REST OF WESTERN EUROPE: DENTAL ANESTHESIA MARKET MAXILLARY, BY TYPE, 2018–2027 (USD MILLION)
      218. Table REST OF WESTERN EUROPE: DENTAL ANESTHESIA MARKET MANDIBULAR, BY TYPE, 2018–2027 (USD MILLION)
      219. Table REST OF WESTERN EUROPE: DENTAL ANESTHESIA MARKET, BY TECHNIQUE, 2018–2027 (USD MILLION)
      220. Table REST OF WESTERN EUROPE: DENTAL ANESTHESIA MARKET NERVE BLOCK, BY TYPE, 2018–2027 (USD MILLION)
      221. Table REST OF WESTERN EUROPE: DENTAL ANESTHESIA MARKET, BY DURATION OF ACTION, 2018–2027 (USD MILLION)
      222. Table REST OF WESTERN EUROPE: DENTAL ANESTHESIA MARKET, BY END USER, 2018–2027 (USD MILLION)
      223. Table REST OF WESTERN EUROPE: DENTAL ANESTHESIA MARKET, BY DISTRIBUTION CHANNEL, 2018–2027 (USD MILLION)
      224. Table EASTERN EUROPE: DENTAL ANESTHESIA MARKET, BY PRODUCT TYPE, 2018–2027 (USD MILLION)
      225. Table EASTERN EUROPE: DENTAL ANESTHESIA MARKET FOR LIDOCAINE, BY TYPE, 2018–2027 (USD MILLION)
      226. Table EASTERN EUROPE: DENTAL ANESTHESIA MARKET FOR MEPIVACAINE, BY TYPE, 2018–2027 (USD MILLION)
      227. Table EASTERN EUROPE: DENTAL ANESTHESIA MARKET FOR PRILOCAINE, BY TYPE, 2018–2027 (USD MILLION)
      228. Table EASTERN EUROPE: DENTAL ANESTHESIA MARKET ARTICAINE, BY TYPE, 2018–2027 (USD MILLION)
      229. Table EASTERN EUROPE: DENTAL ANESTHESIA MARKET, BY MODE OF ADMINISTRATION, 2018–2027 (USD MILLION)
      230. Table EASTERN EUROPE: DENTAL ANESTHESIA MARKET MAXILLARY, BY TYPE, 2018–2027 (USD MILLION)
      231. Table EASTERN EUROPE: DENTAL ANESTHESIA MARKET MANDIBULAR, BY TYPE, 2018–2027 (USD MILLION)
      232. Table EASTERN EUROPE: DENTAL ANESTHESIA MARKET, BY TECHNIQUE, 2018–2027 (USD MILLION)
      233. Table EASTERN EUROPE: DENTAL ANESTHESIA MARKET NERVE BLOCK, BY TYPE, 2018–2027 (USD MILLION)
      234. Table EASTERN EUROPE: DENTAL ANESTHESIA MARKET, BY DURATION OF ACTION, 2018–2027 (USD MILLION)
      235. Table EASTERN EUROPE: DENTAL ANESTHESIA MARKET, BY END USER, 2018–2027 (USD MILLION)
      236. Table EASTERN EUROPE: DENTAL ANESTHESIA MARKET, BY DISTRIBUTION CHANNEL, 2018–2027 (USD MILLION)
      237. Table ASIA-PACIFIC: DENTAL ANESTHESIA MARKET, BY COUNTRY, 2018–2027 (USD MILLION)
      238. Table ASIA-PACIFIC: DENTAL ANESTHESIA MARKET, BY PRODUCT TYPE, 2018–2027 (USD MILLION)
      239. Table ASIA-PACIFIC: DENTAL ANESTHESIA MARKET FOR LIDOCAINE, BY TYPE, 2018–2027 (USD MILLION)
      240. Table ASIA-PACIFIC: DENTAL ANESTHESIA MARKET FOR MEPIVACAINE, BY TYPE, 2018–2027 (USD MILLION)
      241. Table ASIA-PACIFIC: DENTAL ANESTHESIA MARKET FOR PRILOCAINE, BY TYPE, 2018–2027 (USD MILLION)
      242. Table ASIA-PACIFIC: DENTAL ANESTHESIA MARKET ARTICAINE, BY TYPE, 2018–2027 (USD MILLION)
      243. Table ASIA-PACIFIC: DENTAL ANESTHESIA MARKET, BY MODE OF ADMINISTRATION, 2018–2027 (USD MILLION)
      244. Table ASIA-PACIFIC: DENTAL ANESTHESIA MARKET MAXILLARY, BY TYPE, 2018–2027 (USD MILLION)
      245. Table ASIA-PACIFIC: DENTAL ANESTHESIA MARKET MANDIBULAR, BY TYPE, 2018–2027 (USD MILLION)
      246. Table ASIA-PACIFIC: DENTAL ANESTHESIA MARKET, BY TECHNIQUE, 2018–2027 (USD MILLION)
      247. Table ASIA-PACIFIC: DENTAL ANESTHESIA MARKET NERVE BLOCK, BY TYPE, 2018–2027 (USD MILLION)
      248. Table ASIA-PACIFIC: DENTAL ANESTHESIA MARKET, BY DURATION OF ACTION, 2018–2027 (USD MILLION)
      249. Table ASIA-PACIFIC: DENTAL ANESTHESIA MARKET, BY END USER, 2018–2027 (USD MILLION)
      250. Table ASIA-PACIFIC: DENTAL ANESTHESIA MARKET, BY DISTRIBUTION CHANNEL, 2018–2027 (USD MILLION)
      251. Table CHINA: DENTAL ANESTHESIA MARKET, BY PRODUCT TYPE, 2018–2027 (USD MILLION)
      252. Table CHINA: DENTAL ANESTHESIA MARKET FOR LIDOCAINE, BY TYPE, 2018–2027 (USD MILLION)
      253. Table CHINA: DENTAL ANESTHESIA MARKET FOR MEPIVACAINE, BY TYPE, 2018–2027 (USD MILLION)
      254. Table CHINA: DENTAL ANESTHESIA MARKET FOR PRILOCAINE, BY TYPE, 2018–2027 (USD MILLION)
      255. Table CHINA: DENTAL ANESTHESIA MARKET ARTICAINE, BY TYPE, 2018–2027 (USD MILLION)
      256. Table CHINA: DENTAL ANESTHESIA MARKET, BY MODE OF ADMINISTRATION, 2018–2027 (USD MILLION)
      257. Table CHINA: DENTAL ANESTHESIA MARKET MAXILLARY, BY TYPE, 2018–2027 (USD MILLION)
      258. Table CHINA: DENTAL ANESTHESIA MARKET MANDIBULAR, BY T
    2. Table LIST OF ASSUMPTIONS & LIMITATIONS
    3. Table GLOBAL: DENTAL ANESTHESIA MARKET, BY PRODUCT TYPE, 2018-2027 (USD MILLION)
    4. Table GLOBAL: DENTAL ANESTHESIA MARKET, FOR LIDOCAINE, BY TYPE, 2018–2027 (USD MILLION)
    5. Table GLOBAL: DENTAL ANESTHESIA MARKET, FOR LIDOCAINE 2% WITH EPINEPHRINE 1:100,000, BY REGION, 2018–2027 (USD MILLION)
    6. Table GLOBAL: DENTAL ANESTHESIA MARKET, FOR LIDOCAINE 2% WITH EPINEPHRINE 1:50,000, BY REGION, 2018–2027 (USD MILLION)
    7. Table GLOBAL: DENTAL ANESTHESIA MARKET, FOR LIDOCAINE PLAIN, BY REGION, 2018–2027 (USD MILLION)
    8. Table GLOBAL: DENTAL ANESTHESIA MARKET, FOR MEPIVACAINE, BY TYPE, 2018–2027 (USD MILLION)
    9. Table GLOBAL: DENTAL ANESTHESIA MARKET, FOR MEPIVACAINE 2% WITH LEVONORDEFRIN 1:20,000, BY REGION, 2018–2027 (USD MILLION)
    10. Table GLOBAL: DENTAL ANESTHESIA MARKET, FOR MEPIVACAINE 3%, BY REGION, 2018–2027 (USD MILLION)
    11. Table GLOBAL: DENTAL ANESTHESIA MARKET, FOR PRILOCAINE, BY TYPE, 2018–2027 (USD MILLION)
    12. Table GLOBAL: DENTAL ANESTHESIA MARKET, FOR PRILOCAINE 4% WITH EPINEPHRINE 1:200,000, BY REGION, 2018–2027 (USD MILLION)
    13. Table GLOBAL: DENTAL ANESTHESIA MARKET, FOR PRILOCAINE 4%, BY REGION, 2018–2027 (USD MILLION)
    14. Table GLOBAL: DENTAL ANESTHESIA MARKET, FOR BUPIVACAINE 0.5% WITH EPINEPHRINE1:200,000, 2018–2027 (USD MILLION)
    15. Table GLOBAL: DENTAL ANESTHESIA MARKET, FOR ARTICAINE, BY TYPE, 2018–2027 (USD MILLION)
    16. Table GLOBAL: DENTAL ANESTHESIA MARKET, FOR ARTICAINE 4% WITH EPINEPHRINE 1:100,00, BY REGION, 2018–2027 (USD MILLION)
    17. Table GLOBAL: DENTAL ANESTHESIA MARKET, FOR ARTICAINE 4% WITH EPINEPHRINE 1:200,000, BY REGION, 2018–2027 (USD MILLION)
    18. Table GLOBAL: DENTAL ANESTHESIA MARKET, FOR OTHERS, 2018–2027 (USD MILLION)
    19. Table GLOBAL: DENTAL ANESTHESIA MARKET, BY MODE OF ADMINISTRATION, 2018–2027 (USD MILLION)
    20. Table GLOBAL: DENTAL ANESTHESIA MARKET, FOR MAXILLARY, BY TYPE, 2018–2027 (USD MILLION)
    21. Table GLOBAL: DENTAL ANESTHESIA MARKET, FOR SUPRAPERIOSTEAL INJECTION, BY REGION, 2018–2027 (USD MILLION)
    22. Table GLOBAL: DENTAL ANESTHESIA MARKET, FOR INTRASEPTAL INJECTION, BY REGION, 2018–2027 (USD MILLION)
    23. Table GLOBAL: DENTAL ANESTHESIA MARKET, FOR PERIODONTAL LIGAMENT INJECTION, BY REGION, 2018–2027 (USD MILLION)
    24. Table GLOBAL: DENTAL ANESTHESIA MARKET, FOR PERIAPICAL INJECTION, BY REGION, 2018–2027 (USD MILLION)
    25. Table GLOBAL: DENTAL ANESTHESIA MARKET, FOR MANDIBULAR, BY TYPE, 2018–2027 (USD MILLION)
    26. Table GLOBAL: DENTAL ANESTHESIA MARKET, FOR IAN, BY REGION, 2018–2027 (USD MILLION)
    27. Table GLOBAL: DENTAL ANESTHESIA MARKET, FOR AKINOSI, BY REGION, 2018–2027 (USD MILLION)
    28. Table GLOBAL: DENTAL ANESTHESIA MARKET, FOR GOW-GATES, BY REGION, 2018–2027 (USD MILLION)
    29. Table GLOBAL: DENTAL ANESTHESIA MARKET, FOR TISSUE OR SKIN, BY REGION, 2018–2027 (USD MILLION)
    30. Table GLOBAL: DENTAL ANESTHESIA MARKET, FOR OTHERS, 2018–2027 (USD MILLION)
    31. Table GLOBAL: DENTAL ANESTHESIA MARKET, BY TECHNIQUE, 2018–2027 (USD MILLION)
    32. Table GLOBAL: DENTAL ANESTHESIA MARKET, FOR LOCAL INFILTRATION, BY REGION, 2018–2027 (USD MILLION)
    33. Table GLOBAL: DENTAL ANESTHESIA MARKET, FOR FIELD BLOCK, BY REGION, 2018–2027 (USD MILLION)
    34. Table GLOBAL: DENTAL ANESTHESIA MARKET, FOR NERVE BLOCK, BY REGION, 2018–2027 (USD MILLION)
    35. Table GLOBAL: DENTAL ANESTHESIA MARKET, FOR NERVE BLOCK, BY TYPE, 2018–2027 (USD MILLION)
    36. Table GLOBAL: DENTAL ANESTHESIA MARKET, FOR POSTERIOR SUPERIOR ALVEOLAR, BY REGION, 2018–2027 (USD MILLION)
    37. Table GLOBAL: DENTAL ANESTHESIA MARKET, FOR MIDDLE SUPERIOR ALVEOLAR, BY REGION, 2018–2027 (USD MILLION)
    38. Table GLOBAL: DENTAL ANESTHESIA MARKET, FOR ANTERIOR SUPERIOR ALVEOLAR, BY REGION, 2018–2027 (USD MILLION)
    39. Table GLOBAL: DENTAL ANESTHESIA MARKET, BY DURATION OF ACTION, 2018–2027 (USD MILLION)
    40. Table GLOBAL: DENTAL ANESTHESIA MARKET, FOR SHORT, BY REGION, 2018–2027 (USD MILLION)
    41. Table GLOBAL: DENTAL ANESTHESIA MARKET, FOR MEDIUM, BY REGION, 2018–2027 (USD MILLION)
    42. Table GLOBAL: DENTAL ANESTHESIA MARKET, FOR LONG, BY REGION, 2018–2027 (USD MILLION)
    43. Table GLOBAL: DENTAL ANESTHESIA MARKET, BY END USER, 2018–2027 (USD MILLION)
    44. Table GLOBAL: DENTAL ANESTHESIA MARKET, FOR HOSPITAL CLINICS, BY REGION, 2018–2027 (USD MILLION)
    45. Table GLOBAL: DENTAL ANESTHESIA MARKET, FOR CLINICS, BY REGION, 2018–2027 (USD MILLION)
    46. Table GLOBAL: DENTAL ANESTHESIA MARKET, FOR OTHER, BY REGION, 2018–2027 (USD MILLION)
    47. Table GLOBAL: DENTAL ANESTHESIA MARKET, BY DISTRIBUTION CHANNEL, 2018–2027 (USD MILLION)
    48. Table GLOBAL: DENTAL ANESTHESIA MARKET, FOR PHARMACIES AND DRUG STORES, BY REGION, 2018–2027 (USD MILLION)
    49. Table GLOBAL: DENTAL ANESTHESIA MARKET, FOR E-COMMERCE, BY REGION, 2018–2027 (USD MILLION)
    50. Table GLOBAL: DENTAL ANESTHESIA MARKET, FOR OTHER, BY REGION, 2018–2027 (USD MILLION)
    51. Table GLOBAL: DENTAL ANESTHESIA MARKET, BY REGION, 2018–2027 (USD MILLION)
    52. Table AMERICAS: DENTAL ANESTHESIA MARKET, BY REGION, 2018–2027 (USD MILLION)
    53. Table AMERICAS: DENTAL ANESTHESIA MARKET, BY PRODUCT TYPE, 2018–2027 (USD MILLION)
    54. Table AMERICAS: DENTAL ANESTHESIA MARKET FOR LIDOCAINE, BY TYPE, 2018–2027 (USD MILLION)
    55. Table AMERICAS: DENTAL ANESTHESIA MARKET FOR MEPIVACAINE, BY TYPE, 2018–2027 (USD MILLION)
    56. Table AMERICAS: DENTAL ANESTHESIA MARKET FOR PRILOCAINE, BY TYPE, 2018–2027 (USD MILLION)
    57. Table AMERICAS: DENTAL ANESTHESIA MARKET ARTICAINE, BY TYPE, 2018–2027 (USD MILLION)
    58. Table AMERICAS: DENTAL ANESTHESIA MARKET, BY MODE OF ADMINISTRATION, 2018–2027 (USD MILLION)
    59. Table AMERICAS: DENTAL ANESTHESIA MARKET MAXILLARY, BY TYPE, 2018–2027 (USD MILLION)
    60. Table AMERICAS: DENTAL ANESTHESIA MARKET MANDIBULAR, BY TYPE, 2018–2027 (USD MILLION)
    61. Table AMERICAS: DENTAL ANESTHESIA MARKET, BY TECHNIQUE, 2018–2027 (USD MILLION)
    62. Table AMERICAS: DENTAL ANESTHESIA MARKET NERVE BLOCK, BY TYPE, 2018–2027 (USD MILLION)
    63. Table AMERICAS: DENTAL ANESTHESIA MARKET, BY DURATION OF ACTION, 2018–2027 (USD MILLION)
    64. Table AMERICAS: DENTAL ANESTHESIA MARKET, BY END USER, 2018–2027 (USD MILLION)
    65. Table AMERICAS: DENTAL ANESTHESIA MARKET, BY DISTRIBUTION CHANNEL, 2018–2027 (USD MILLION)
    66. Table NORTH AMERICA: DENTAL ANESTHESIA MARKET, BY REGION, 2018–2027 (USD MILLION)
    67. Table NORTH AMERICA: DENTAL ANESTHESIA MARKET, BY PRODUCT TYPE, 2018–2027 (USD MILLION)
    68. Table NORTH AMERICA: DENTAL ANESTHESIA MARKET FOR LIDOCAINE, BY TYPE, 2018–2027 (USD MILLION)
    69. Table NORTH AMERICA: DENTAL ANESTHESIA MARKET FOR MEPIVACAINE, BY TYPE, 2018–2027 (USD MILLION)
    70. Table NORTH AMERICA: DENTAL ANESTHESIA MARKET FOR PRILOCAINE, BY TYPE, 2018–2027 (USD MILLION)
    71. Table NORTH AMERICA: DENTAL ANESTHESIA MARKET ARTICAINE, BY TYPE, 2018–2027 (USD MILLION)
    72. Table NORTH AMERICA: DENTAL ANESTHESIA MARKET, BY MODE OF ADMINISTRATION, 2018–2027 (USD MILLION)
    73. Table NORTH AMERICA: DENTAL ANESTHESIA MARKET MAXILLARY, BY TYPE, 2018–2027 (USD MILLION)
    74. Table NORTH AMERICA: DENTAL ANESTHESIA MARKET MANDIBULAR, BY TYPE, 2018–2027 (USD MILLION)
    75. Table NORTH AMERICA: DENTAL ANESTHESIA MARKET, BY TECHNIQUE, 2018–2027 (USD MILLION)
    76. Table NORTH AMERICA: DENTAL ANESTHESIA MARKET NERVE BLOCK, BY TYPE, 2018–2027 (USD MILLION)
    77. Table NORTH AMERICA: DENTAL ANESTHESIA MARKET, BY DURATION OF ACTION, 2018–2027 (USD MILLION)
    78. Table NORTH AMERICA: DENTAL ANESTHESIA MARKET, BY END USER, 2018–2027 (USD MILLION)
    79. Table NORTH AMERICA: DENTAL ANESTHESIA MARKET, BY DISTRIBUTION CHANNEL, 2018–2027 (USD MILLION)
    80. Table US: DENTAL ANESTHESIA MARKET, BY PRODUCT TYPE, 2018–2027 (USD MILLION)
    81. Table US: DENTAL ANESTHESIA MARKET FOR LIDOCAINE, BY TYPE, 2018–2027 (USD MILLION)
    82. Table US: DENTAL ANESTHESIA MARKET FOR MEPIVACAINE, BY TYPE, 2018–2027 (USD MILLION)
    83. Table US: DENTAL ANESTHESIA MARKET FOR PRILOCAINE, BY TYPE, 2018–2027 (USD MILLION)
    84. Table US: DENTAL ANESTHESIA MARKET ARTICAINE, BY TYPE, 2018–2027 (USD MILLION)
    85. Table US: DENTAL ANESTHESIA MARKET, BY MODE OF ADMINISTRATION, 2018–2027 (USD MILLION)
    86. Table US: DENTAL ANESTHESIA MARKET MAXILLARY, BY TYPE, 2018–2027 (USD MILLION)
    87. Table US: DENTAL ANESTHESIA MARKET MANDIBULAR, BY TYPE, 2018–2027 (USD MILLION)
    88. Table US: DENTAL ANESTHESIA MARKET, BY TECHNIQUE, 2018–2027 (USD MILLION)
    89. Table US: DENTAL ANESTHESIA MARKET NERVE BLOCK, BY TYPE, 2018–2027 (USD MILLION)
    90. Table US: DENTAL ANESTHESIA MARKET, BY DURATION OF ACTION, 2018–2027 (USD MILLION)
    91. Table US: DENTAL ANESTHESIA MARKET, BY END USER, 2018–2027 (USD MILLION)
    92. Table US: DENTAL ANESTHESIA MARKET, BY DISTRIBUTION CHANNEL, 2018–2027 (USD MILLION)
    93. Table CANADA: DENTAL ANESTHESIA MARKET, BY PRODUCT TYPE, 2018–2027 (USD MILLION)
    94. Table CANADA: DENTAL ANESTHESIA MARKET FOR LIDOCAINE, BY TYPE, 2018–2027 (USD MILLION)
    95. Table CANADA: DENTAL ANESTHESIA MARKET FOR MEPIVACAINE, BY TYPE, 2018–2027 (USD MILLION)
    96. Table CANADA: DENTAL ANESTHESIA MARKET FOR PRILOCAINE, BY TYPE, 2018–2027 (USD MILLION)
    97. Table CANADA: DENTAL ANESTHESIA MARKET ARTICAINE, BY TYPE, 2018–2027 (USD MILLION)
    98. Table CANADA: DENTAL ANESTHESIA MARKET, BY MODE OF ADMINISTRATION, 2018–2027 (USD MILLION)
    99. Table CANADA: DENTAL ANESTHESIA MARKET MAXILLARY, BY TYPE, 2018–2027 (USD MILLION)
    100. Table CANADA: DENTAL ANESTHESIA MARKET MANDIBULAR, BY TYPE, 2018–2027 (USD MILLION)
    101. Table CANADA: DENTAL ANESTHESIA MARKET, BY TECHNIQUE, 2018–2027 (USD MILLION)
    102. Table CANADA: DENTAL ANESTHESIA MARKET NERVE BLOCK, BY TYPE, 2018–2027 (USD MILLION)
    103. Table CANADA: DENTAL ANESTHESIA MARKET, BY DURATION OF ACTION, 2018–2027 (USD MILLION)
    104. Table CANADA: DENTAL ANESTHESIA MARKET, BY END USER, 2018–2027 (USD MILLION)
    105. Table CANADA: DENTAL ANESTHESIA MARKET, BY DISTRIBUTION CHANNEL, 2018–2027 (USD MILLION)
    106. Table SOUTH AMERICA: DENTAL ANESTHESIA MARKET, BY PRODUCT TYPE, 2018–2027 (USD MILLION)
    107. Table SOUTH AMERICA: DENTAL ANESTHESIA MARKET FOR LIDOCAINE, BY TYPE, 2018–2027 (USD MILLION)
    108. Table SOUTH AMERICA: DENTAL ANESTHESIA MARKET FOR MEPIVACAINE, BY TYPE, 2018–2027 (USD MILLION)
    109. Table SOUTH AMERICA: DENTAL ANESTHESIA MARKET FOR PRILOCAINE, BY TYPE, 2018–2027 (USD MILLION)
    110. Table SOUTH AMERICA: DENTAL ANESTHESIA MARKET ARTICAINE, BY TYPE, 2018–2027 (USD MILLION)
    111. Table SOUTH AMERICA: DENTAL ANESTHESIA MARKET, BY MODE OF ADMINISTRATION, 2018–2027 (USD MILLION)
    112. Table SOUTH AMERICA: DENTAL ANESTHESIA MARKET MAXILLARY, BY TYPE, 2018–2027 (USD MILLION)
    113. Table SOUTH AMERICA: DENTAL ANESTHESIA MARKET MANDIBULAR, BY TYPE, 2018–2027 (USD MILLION)
    114. Table SOUTH AMERICA: DENTAL ANESTHESIA MARKET, BY TECHNIQUE, 2018–2027 (USD MILLION)
    115. Table SOUTH AMERICA: DENTAL ANESTHESIA MARKET NERVE BLOCK, BY TYPE, 2018–2027 (USD MILLION)
    116. Table SOUTH AMERICA: DENTAL ANESTHESIA MARKET, BY DURATION OF ACTION, 2018–2027 (USD MILLION)
    117. Table SOUTH AMERICA: DENTAL ANESTHESIA MARKET, BY END USER, 2018–2027 (USD MILLION)
    118. Table SOUTH AMERICA: DENTAL ANESTHESIA MARKET, BY DISTRIBUTION CHANNEL, 2018–2027 (USD MILLION)
    119. Table EUROPE: DENTAL ANESTHESIA MARKET, BY REGION, 2018–2027 (USD MILLION)
    120. Table EUROPE: DENTAL ANESTHESIA MARKET, BY PRODUCT TYPE, 2018–2027 (USD MILLION)
    121. Table EUROPE: DENTAL ANESTHESIA MARKET FOR LIDOCAINE, BY TYPE, 2018–2027 (USD MILLION)
    122. Table EUROPE: DENTAL ANESTHESIA MARKET FOR MEPIVACAINE, BY TYPE, 2018–2027 (USD MILLION)
    123. Table EUROPE: DENTAL ANESTHESIA MARKET FOR PRILOCAINE, BY TYPE, 2018–2027 (USD MILLION)
    124. Table EUROPE: DENTAL ANESTHESIA MARKET ARTICAINE, BY TYPE, 2018–2027 (USD MILLION)
    125. Table EUROPE: DENTAL ANESTHESIA MARKET, BY MODE OF ADMINISTRATION, 2018–2027 (USD MILLION)
    126. Table EUROPE: DENTAL ANESTHESIA MARKET MAXILLARY, BY TYPE, 2018–2027 (USD MILLION)
    127. Table EUROPE: DENTAL ANESTHESIA MARKET MANDIBULAR, BY TYPE, 2018–2027 (USD MILLION)
    128. Table EUROPE: DENTAL ANESTHESIA MARKET, BY TECHNIQUE, 2018–2027 (USD MILLION)
    129. Table EUROPE: DENTAL ANESTHESIA MARKET NERVE BLOCK, BY TYPE, 2018–2027 (USD MILLION)
    130. Table EUROPE: DENTAL ANESTHESIA MARKET, BY DURATION OF ACTION, 2018–2027 (USD MILLION)
    131. Table EUROPE: DENTAL ANESTHESIA MARKET, BY END USER, 2018–2027 (USD MILLION)
    132. Table EUROPE: DENTAL ANESTHESIA MARKET, BY DISTRIBUTION CHANNEL, 2018–2027 (USD MILLION)
    133. Table WESTERN EUROPE: DENTAL ANESTHESIA MARKET, BY COUNTRY, 2018–2027 (USD MILLION)
    134. Table WESTERN EUROPE: DENTAL ANESTHESIA MARKET, BY PRODUCT TYPE, 2018–2027 (USD MILLION)
    135. Table WESTERN EUROPE: DENTAL ANESTHESIA MARKET FOR LIDOCAINE, BY TYPE, 2018–2027 (USD MILLION)
    136. Table WESTERN EUROPE: DENTAL ANESTHESIA MARKET FOR MEPIVACAINE, BY TYPE, 2018–2027 (USD MILLION)
    137. Table WESTERN EUROPE: DENTAL ANESTHESIA MARKET FOR PRILOCAINE, BY TYPE, 2018–2027 (USD MILLION)
    138. Table WESTERN EUROPE: DENTAL ANESTHESIA MARKET ARTICAINE, BY TYPE, 2018–2027 (USD MILLION)
    139. Table WESTERN EUROPE: DENTAL ANESTHESIA MARKET, BY MODE OF ADMINISTRATION, 2018–2027 (USD MILLION)
    140. Table WESTERN EUROPE: DENTAL ANESTHESIA MARKET MAXILLARY, BY TYPE, 2018–2027 (USD MILLION)
    141. Table WESTERN EUROPE: DENTAL ANESTHESIA MARKET MANDIBULAR, BY TYPE, 2018–2027 (USD MILLION)
    142. Table WESTERN EUROPE: DENTAL ANESTHESIA MARKET, BY TECHNIQUE, 2018–2027 (USD MILLION)
    143. Table WESTERN EUROPE: DENTAL ANESTHESIA MARKET NERVE BLOCK, BY TYPE, 2018–2027 (USD MILLION)
    144. Table WESTERN EUROPE: DENTAL ANESTHESIA MARKET, BY DURATION OF ACTION, 2018–2027 (USD MILLION)
    145. Table WESTERN EUROPE: DENTAL ANESTHESIA MARKET, BY END USER, 2018–2027 (USD MILLION)
    146. Table WESTERN EUROPE: DENTAL ANESTHESIA MARKET, BY DISTRIBUTION CHANNEL, 2018–2027 (USD MILLION)
    147. Table GERMANY: DENTAL ANESTHESIA MARKET, BY PRODUCT TYPE, 2018–2027 (USD MILLION)
    148. Table GERMANY: DENTAL ANESTHESIA MARKET FOR LIDOCAINE, BY TYPE, 2018–2027 (USD MILLION)
    149. Table GERMANY: DENTAL ANESTHESIA MARKET FOR MEPIVACAINE, BY TYPE, 2018–2027 (USD MILLION)
    150. Table GERMANY: DENTAL ANESTHESIA MARKET FOR PRILOCAINE, BY TYPE, 2018–2027 (USD MILLION)
    151. Table GERMANY: DENTAL ANESTHESIA MARKET ARTICAINE, BY TYPE, 2018–2027 (USD MILLION)
    152. Table GERMANY: DENTAL ANESTHESIA MARKET, BY MODE OF ADMINISTRATION, 2018–2027 (USD MILLION)
    153. Table GERMANY: DENTAL ANESTHESIA MARKET MAXILLARY, BY TYPE, 2018–2027 (USD MILLION)
    154. Table GERMANY: DENTAL ANESTHESIA MARKET MANDIBULAR, BY TYPE, 2018–2027 (USD MILLION)
    155. Table GERMANY: DENTAL ANESTHESIA MARKET, BY TECHNIQUE, 2018–2027 (USD MILLION)
    156. Table GERMANY: DENTAL ANESTHESIA MARKET NERVE BLOCK, BY TYPE, 2018–2027 (USD MILLION)
    157. Table GERMANY: DENTAL ANESTHESIA MARKET, BY DURATION OF ACTION, 2018–2027 (USD MILLION)
    158. Table GERMANY: DENTAL ANESTHESIA MARKET, BY END USER, 2018–2027 (USD MILLION)
    159. Table GERMANY: DENTAL ANESTHESIA MARKET, BY DISTRIBUTION CHANNEL, 2018–2027 (USD MILLION)
    160. Table FRANCE: DENTAL ANESTHESIA MARKET, BY PRODUCT TYPE, 2018–2027 (USD MILLION)
    161. Table FRANCE: DENTAL ANESTHESIA MARKET FOR LIDOCAINE, BY TYPE, 2018–2027 (USD MILLION)
    162. Table FRANCE: DENTAL ANESTHESIA MARKET FOR MEPIVACAINE, BY TYPE, 2018–2027 (USD MILLION)
    163. Table FRANCE: DENTAL ANESTHESIA MARKET FOR PRILOCAINE, BY TYPE, 2018–2027 (USD MILLION)
    164. Table FRANCE: DENTAL ANESTHESIA MARKET ARTICAINE, BY TYPE, 2018–2027 (USD MILLION)
    165. Table FRANCE: DENTAL ANESTHESIA MARKET, BY MODE OF ADMINISTRATION, 2018–2027 (USD MILLION)
    166. Table FRANCE: DENTAL ANESTHESIA MARKET MAXILLARY, BY TYPE, 2018–2027 (USD MILLION)
    167. Table FRANCE: DENTAL ANESTHESIA MARKET MANDIBULAR, BY TYPE, 2018–2027 (USD MILLION)
    168. Table FRANCE: DENTAL ANESTHESIA MARKET, BY TECHNIQUE, 2018–2027 (USD MILLION)
    169. Table FRANCE: DENTAL ANESTHESIA MARKET NERVE BLOCK, BY TYPE, 2018–2027 (USD MILLION)
    170. Table FRANCE: DENTAL ANESTHESIA MARKET, BY DURATION OF ACTION, 2018–2027 (USD MILLION)
    171. Table FRANCE: DENTAL ANESTHESIA MARKET, BY END USER, 2018–2027 (USD MILLION)
    172. Table FRANCE: DENTAL ANESTHESIA MARKET, BY DISTRIBUTION CHANNEL, 2018–2027 (USD MILLION)
    173. Table UK: DENTAL ANESTHESIA MARKET, BY PRODUCT TYPE, 2018–2027 (USD MILLION)
    174. Table UK: DENTAL ANESTHESIA MARKET FOR LIDOCAINE, BY TYPE, 2018–2027 (USD MILLION)
    175. Table UK: DENTAL ANESTHESIA MARKET FOR MEPIVACAINE, BY TYPE, 2018–2027 (USD MILLION)
    176. Table UK: DENTAL ANESTHESIA MARKET FOR PRILOCAINE, BY TYPE, 2018–2027 (USD MILLION)
    177. Table UK: DENTAL ANESTHESIA MARKET ARTICAINE, BY TYPE, 2018–2027 (USD MILLION)
    178. Table UK: DENTAL ANESTHESIA MARKET, BY MODE OF ADMINISTRATION, 2018–2027 (USD MILLION)
    179. Table UK: DENTAL ANESTHESIA MARKET MAXILLARY, BY TYPE, 2018–2027 (USD MILLION)
    180. Table UK: DENTAL ANESTHESIA MARKET MANDIBULAR, BY TYPE, 2018–2027 (USD MILLION)
    181. Table UK: DENTAL ANESTHESIA MARKET, BY TECHNIQUE, 2018–2027 (USD MILLION)
    182. Table UK: DENTAL ANESTHESIA MARKET NERVE BLOCK, BY TYPE, 2018–2027 (USD MILLION)
    183. Table UK: DENTAL ANESTHESIA MARKET, BY DURATION OF ACTION, 2018–2027 (USD MILLION)
    184. Table UK: DENTAL ANESTHESIA MARKET, BY END USER, 2018–2027 (USD MILLION)
    185. Table UK: DENTAL ANESTHESIA MARKET, BY DISTRIBUTION CHANNEL, 2018–2027 (USD MILLION)
    186. Table ITALY: DENTAL ANESTHESIA MARKET, BY PRODUCT TYPE, 2018–2027 (USD MILLION)
    187. Table ITALY: DENTAL ANESTHESIA MARKET FOR LIDOCAINE, BY TYPE, 2018–2027 (USD MILLION)
    188. Table ITALY: DENTAL ANESTHESIA MARKET FOR MEPIVACAINE, BY TYPE, 2018–2027 (USD MILLION)
    189. Table ITALY: DENTAL ANESTHESIA MARKET FOR PRILOCAINE, BY TYPE, 2018–2027 (USD MILLION)
    190. Table ITALY: DENTAL ANESTHESIA MARKET ARTICAINE, BY TYPE, 2018–2027 (USD MILLION)
    191. Table ITALY: DENTAL ANESTHESIA MARKET, BY MODE OF ADMINISTRATION, 2018–2027 (USD MILLION)
    192. Table ITALY: DENTAL ANESTHESIA MARKET MAXILLARY, BY TYPE, 2018–2027 (USD MILLION)
    193. Table ITALY: DENTAL ANESTHESIA MARKET MANDIBULAR, BY TYPE, 2018–2027 (USD MILLION)
    194. Table ITALY: DENTAL ANESTHESIA MARKET, BY TECHNIQUE, 2018–2027 (USD MILLION)
    195. Table ITALY: DENTAL ANESTHESIA MARKET NERVE BLOCK, BY TYPE, 2018–2027 (USD MILLION)
    196. Table ITALY: DENTAL ANESTHESIA MARKET, BY DURATION OF ACTION, 2018–2027 (USD MILLION)
    197. Table ITALY: DENTAL ANESTHESIA MARKET, BY END USER, 2018–2027 (USD MILLION)
    198. Table ITALY: DENTAL ANESTHESIA MARKET, BY DISTRIBUTION CHANNEL, 2018–2027 (USD MILLION)
    199. Table SPAIN: DENTAL ANESTHESIA MARKET, BY PRODUCT TYPE, 2018–2027 (USD MILLION)
    200. Table SPAIN: DENTAL ANESTHESIA MARKET FOR LIDOCAINE, BY TYPE, 2018–2027 (USD MILLION)
    201. Table SPAIN: DENTAL ANESTHESIA MARKET FOR MEPIVACAINE, BY TYPE, 2018–2027 (USD MILLION)
    202. Table SPAIN: DENTAL ANESTHESIA MARKET FOR PRILOCAINE, BY TYPE, 2018–2027 (USD MILLION)
    203. Table SPAIN: DENTAL ANESTHESIA MARKET ARTICAINE, BY TYPE, 2018–2027 (USD MILLION)
    204. Table SPAIN: DENTAL ANESTHESIA MARKET, BY MODE OF ADMINISTRATION, 2018–2027 (USD MILLION)
    205. Table SPAIN: DENTAL ANESTHESIA MARKET MAXILLARY, BY TYPE, 2018–2027 (USD MILLION)
    206. Table SPAIN: DENTAL ANESTHESIA MARKET MANDIBULAR, BY TYPE, 2018–2027 (USD MILLION)
    207. Table SPAIN: DENTAL ANESTHESIA MARKET, BY TECHNIQUE, 2018–2027 (USD MILLION)
    208. Table SPAIN: DENTAL ANESTHESIA MARKET NERVE BLOCK, BY TYPE, 2018–2027 (USD MILLION)
    209. Table SPAIN: DENTAL ANESTHESIA MARKET, BY DURATION OF ACTION, 2018–2027 (USD MILLION)
    210. Table SPAIN: DENTAL ANESTHESIA MARKET, BY END USER, 2018–2027 (USD MILLION)
    211. Table SPAIN: DENTAL ANESTHESIA MARKET, BY DISTRIBUTION CHANNEL, 2018–2027 (USD MILLION)
    212. Table REST OF WESTERN EUROPE: DENTAL ANESTHESIA MARKET, BY PRODUCT TYPE, 2018–2027 (USD MILLION)
    213. Table REST OF WESTERN EUROPE: DENTAL ANESTHESIA MARKET FOR LIDOCAINE, BY TYPE, 2018–2027 (USD MILLION)
    214. Table REST OF WESTERN EUROPE: DENTAL ANESTHESIA MARKET FOR MEPIVACAINE, BY TYPE, 2018–2027 (USD MILLION)
    215. Table REST OF WESTERN EUROPE: DENTAL ANESTHESIA MARKET FOR PRILOCAINE, BY TYPE, 2018–2027 (USD MILLION)
    216. Table REST OF WESTERN EUROPE: DENTAL ANESTHESIA MARKET ARTICAINE, BY TYPE, 2018–2027 (USD MILLION)
    217. Table REST OF WESTERN EUROPE: DENTAL ANESTHESIA MARKET, BY MODE OF ADMINISTRATION, 2018–2027 (USD MILLION)
    218. Table REST OF WESTERN EUROPE: DENTAL ANESTHESIA MARKET MAXILLARY, BY TYPE, 2018–2027 (USD MILLION)
    219. Table REST OF WESTERN EUROPE: DENTAL ANESTHESIA MARKET MANDIBULAR, BY TYPE, 2018–2027 (USD MILLION)
    220. Table REST OF WESTERN EUROPE: DENTAL ANESTHESIA MARKET, BY TECHNIQUE, 2018–2027 (USD MILLION)
    221. Table REST OF WESTERN EUROPE: DENTAL ANESTHESIA MARKET NERVE BLOCK, BY TYPE, 2018–2027 (USD MILLION)
    222. Table REST OF WESTERN EUROPE: DENTAL ANESTHESIA MARKET, BY DURATION OF ACTION, 2018–2027 (USD MILLION)
    223. Table REST OF WESTERN EUROPE: DENTAL ANESTHESIA MARKET, BY END USER, 2018–2027 (USD MILLION)
    224. Table REST OF WESTERN EUROPE: DENTAL ANESTHESIA MARKET, BY DISTRIBUTION CHANNEL, 2018–2027 (USD MILLION)
    225. Table EASTERN EUROPE: DENTAL ANESTHESIA MARKET, BY PRODUCT TYPE, 2018–2027 (USD MILLION)
    226. Table EASTERN EUROPE: DENTAL ANESTHESIA MARKET FOR LIDOCAINE, BY TYPE, 2018–2027 (USD MILLION)
    227. Table EASTERN EUROPE: DENTAL ANESTHESIA MARKET FOR MEPIVACAINE, BY TYPE, 2018–2027 (USD MILLION)
    228. Table EASTERN EUROPE: DENTAL ANESTHESIA MARKET FOR PRILOCAINE, BY TYPE, 2018–2027 (USD MILLION)
    229. Table EASTERN EUROPE: DENTAL ANESTHESIA MARKET ARTICAINE, BY TYPE, 2018–2027 (USD MILLION)
    230. Table EASTERN EUROPE: DENTAL ANESTHESIA MARKET, BY MODE OF ADMINISTRATION, 2018–2027 (USD MILLION)
    231. Table EASTERN EUROPE: DENTAL ANESTHESIA MARKET MAXILLARY, BY TYPE, 2018–2027 (USD MILLION)
    232. Table EASTERN EUROPE: DENTAL ANESTHESIA MARKET MANDIBULAR, BY TYPE, 2018–2027 (USD MILLION)
    233. Table EASTERN EUROPE: DENTAL ANESTHESIA MARKET, BY TECHNIQUE, 2018–2027 (USD MILLION)
    234. Table EASTERN EUROPE: DENTAL ANESTHESIA MARKET NERVE BLOCK, BY TYPE, 2018–2027 (USD MILLION)
    235. Table EASTERN EUROPE: DENTAL ANESTHESIA MARKET, BY DURATION OF ACTION, 2018–2027 (USD MILLION)
    236. Table EASTERN EUROPE: DENTAL ANESTHESIA MARKET, BY END USER, 2018–2027 (USD MILLION)
    237. Table EASTERN EUROPE: DENTAL ANESTHESIA MARKET, BY DISTRIBUTION CHANNEL, 2018–2027 (USD MILLION)
    238. Table ASIA-PACIFIC: DENTAL ANESTHESIA MARKET, BY COUNTRY, 2018–2027 (USD MILLION)
    239. Table ASIA-PACIFIC: DENTAL ANESTHESIA MARKET, BY PRODUCT TYPE, 2018–2027 (USD MILLION)
    240. Table ASIA-PACIFIC: DENTAL ANESTHESIA MARKET FOR LIDOCAINE, BY TYPE, 2018–2027 (USD MILLION)
    241. Table ASIA-PACIFIC: DENTAL ANESTHESIA MARKET FOR MEPIVACAINE, BY TYPE, 2018–2027 (USD MILLION)
    242. Table ASIA-PACIFIC: DENTAL ANESTHESIA MARKET FOR PRILOCAINE, BY TYPE, 2018–2027 (USD MILLION)
    243. Table ASIA-PACIFIC: DENTAL ANESTHESIA MARKET ARTICAINE, BY TYPE, 2018–2027 (USD MILLION)
    244. Table ASIA-PACIFIC: DENTAL ANESTHESIA MARKET, BY MODE OF ADMINISTRATION, 2018–2027 (USD MILLION)
    245. Table ASIA-PACIFIC: DENTAL ANESTHESIA MARKET MAXILLARY, BY TYPE, 2018–2027 (USD MILLION)
    246. Table ASIA-PACIFIC: DENTAL ANESTHESIA MARKET MANDIBULAR, BY TYPE, 2018–2027 (USD MILLION)
    247. Table ASIA-PACIFIC: DENTAL ANESTHESIA MARKET, BY TECHNIQUE, 2018–2027 (USD MILLION)
    248. Table ASIA-PACIFIC: DENTAL ANESTHESIA MARKET NERVE BLOCK, BY TYPE, 2018–2027 (USD MILLION)
    249. Table ASIA-PACIFIC: DENTAL ANESTHESIA MARKET, BY DURATION OF ACTION, 2018–2027 (USD MILLION)
    250. Table ASIA-PACIFIC: DENTAL ANESTHESIA MARKET, BY END USER, 2018–2027 (USD MILLION)
    251. Table ASIA-PACIFIC: DENTAL ANESTHESIA MARKET, BY DISTRIBUTION CHANNEL, 2018–2027 (USD MILLION)
    252. Table CHINA: DENTAL ANESTHESIA MARKET, BY PRODUCT TYPE, 2018–2027 (USD MILLION)
    253. Table CHINA: DENTAL ANESTHESIA MARKET FOR LIDOCAINE, BY TYPE, 2018–2027 (USD MILLION)
    254. Table CHINA: DENTAL ANESTHESIA MARKET FOR MEPIVACAINE, BY TYPE, 2018–2027 (USD MILLION)
    255. Table CHINA: DENTAL ANESTHESIA MARKET FOR PRILOCAINE, BY TYPE, 2018–2027 (USD MILLION)
    256. Table CHINA: DENTAL ANESTHESIA MARKET ARTICAINE, BY TYPE, 2018–2027 (USD MILLION)
    257. Table CHINA: DENTAL ANESTHESIA MARKET, BY MODE OF ADMINISTRATION, 2018–2027 (USD MILLION)
    258. Table CHINA: DENTAL ANESTHESIA MARKET MAXILLARY, BY TYPE, 2018–2027 (USD MILLION)
    259. Table CHINA: DENTAL ANESTHESIA MARKET MANDIBULAR, BY T

    Dental Anesthesia Market Segmentation

    Market Segmentation Overview

    • Detailed segmentation data will be available in the full report
    • Comprehensive analysis by multiple parameters
    • Regional and country-level breakdowns
    • Market size forecasts by segment
    Infographic

    Free Sample Request

    Kindly complete the form below to receive a free sample of this Report

    Get Free Sample

    Customer Strories

    “I am very pleased with how market segments have been defined in a relevant way for my purposes (such as "Portable Freezers & refrigerators" and "last-mile"). In general the report is well structured. Thanks very much for your efforts.”

    Victoria Milne

    Founder
    Case Study
    Chemicals and Materials