• Cat-intel
  • MedIntelliX
  • Resources
  • About Us
  • Hero Background
    English
    Chinese
    French
    Japanese
    Korean
    German
    Spanish

    Coma Diagnosis and Treatment Market Trends

    ID: MRFR/Pharma/3555-HCR
    120 Pages
    Rahul Gotadki
    October 2025

    Coma Diagnosis & Treatment Market Research Report Information By Types (Toxic-Metabolic Encephalopathy, Anoxic Brain Injury), Diagnosis (Physical Examination, Brain Scans) Treatment (Medical Treatment), End User (Hospitals & Clinics) - Global Forecast till 2035

    Share:
    Download PDF ×

    We do not share your information with anyone. However, we may send you emails based on your report interest from time to time. You may contact us at any time to opt-out.

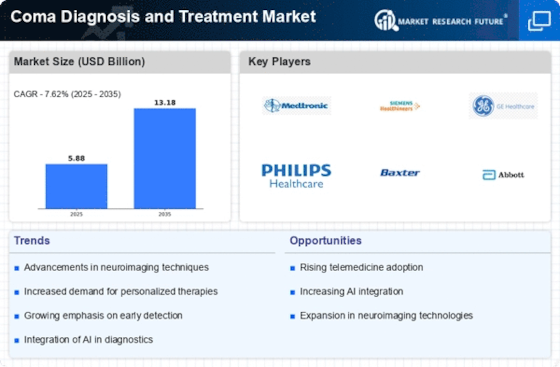
    Coma Diagnosis and Treatment Market Infographic
    Purchase Options

    Market Trends

    Key Emerging Trends in the Coma Diagnosis and Treatment Market

    Due to traumatic brain injuries, stroke, and neurological illnesses, coma incidence is rising worldwide, driving need for precise diagnosis and effective treatment. Diagnostic imaging technologies including MRI, CT scans, and electroencephalography (EEG) are increasing coma identification and intervention, boosting market growth. Serum biomarkers and neuroimaging indicators for coma diagnosis provide quick and exact diagnosis, focused therapy, and market growth. Market growth is driven by multimodal monitoring systems that include EEG, intracranial pressure, and cerebral blood flow monitoring to better understand coma pathogenesis and guide tailored treatment regimens. Novel coma treatments include neuroprotective medicines, neuromodulation, and stem cell therapies are being developed, expanding the market. Telemedicine platforms and remote monitoring solutions for coma patients provide real-time consultations and continuous patient monitoring, enhancing access to specialist treatment and boosting market development, especially in distant or underserved locations. Specialized neurocritical care facilities with enhanced monitoring and treatment technology are improving coma outcomes and generating demand for coma management services. Coma treatment approval and commercialization regulations affect market dynamics and product innovation, affecting market growth. Patient-centric coma management is improving market accessibility and development as physicians personalize treatment programs to patient requirements and preferences. Research, healthcare, and pharmaceutical businesses are collaborating to improve coma diagnosis and treatment, expanding the market. Enhanced neuroimaging technologies like fMRI and DTI are revealing coma etiology and enabling tailored treatment techniques, increasing market development. Comprehensive rehabilitation treatments including physical, occupational, and speech therapy are improving coma survivors' functional results and boosting rehabilitation service demand. Public health campaigns to prevent, detect, and treat comas are lowering death rates and increasing demand for specialist services. Globalization of healthcare services allows patients to receive specialist coma diagnosis and treatment across boundaries, increasing market competitiveness and innovation. Increasing investment in clinical trials and research studies on coma diagnosis and treatment is generating innovation, resulting to new diagnostic instruments and therapeutic strategies and market expansion.

    Author
    Rahul Gotadki
    Assistant Manager

    He holds an experience of about 7+ years in Market Research and Business Consulting, working under the spectrum of Life Sciences and Healthcare domains. Rahul conceptualizes and implements a scalable business strategy and provides strategic leadership to the clients. His expertise lies in market estimation, competitive intelligence, pipeline analysis, customer assessment, etc. In addition to the above, his other responsibility includes strategic tracking of high growth markets & advising clients on the potential areas of focus they could direct their business initiatives

    Leave a Comment

    FAQs

    What is the growth rate of the global coma diagnosis & treatment market?

    coma diagnosis & treatment market can expand at 7.68% CAGR from 2024 to 2032.

    Name the major driver of the global coma diagnosis & treatment market?

    High prevalence of neurological disorders and the number of cases of coma are major drivers of the global coma diagnosis & treatment market.

    What factors can restrain the global coma diagnosis & treatment market?

    High treatment costs and limited availability of the treatment are factors which can restrain market growth.

    Which region can dominate in the global coma diagnosis & treatment market?

    The Americas can dominate the global coma diagnosis & treatment market due to a large patient pool and favorable reimbursement policies.

    Which region showcase the fastest growth in global coma diagnosis & treatment market?

    APAC can display the highest growth rate in the global coma diagnosis & treatment market due to stressful lifestyle and rapidly developing healthcare infrastructure.

    Name the biggest players of the global coma diagnosis & treatment market?

    Siemens Healthcare, GE Healthcare, Hologic, Nihon Kohden Corporation, Toshiba Medical Systems Corporation, Shimadzu Corporation, Electrical Geodesics Inc., Fujifilm Holdings, Masimo Corporation, Esaote, Philips Healthcare, and Carestream Health are notable players of the global coma diagnosis & treatment market.

    Market Summary

    The Global Coma Diagnosis and Treatment Market is projected to grow significantly from 5.93 USD Billion in 2024 to 13.3 USD Billion by 2035.

    Key Market Trends & Highlights

    Coma Diagnosis and Treatment Key Trends and Highlights

    • The market is expected to experience a compound annual growth rate (CAGR) of 7.62% from 2025 to 2035.
    • By 2035, the market valuation is anticipated to reach 13.3 USD Billion, indicating robust growth potential.
    • In 2024, the market is valued at 5.93 USD Billion, reflecting the current demand for coma diagnosis and treatment solutions.
    • Growing adoption of advanced diagnostic technologies due to increasing awareness of coma-related conditions is a major market driver.

    Market Size & Forecast

    2024 Market Size 5.93 (USD Billion)
    2035 Market Size 13.3 (USD Billion)
    CAGR (2025-2035) 7.62%
    Largest Regional Market Share in 2024 latin_america)

    Major Players

    Fujifilm Holdings (Japan), GE Healthcare (U.S.), Siemens Healthcare (U.S.), Philips Healthcare (U.S.), Shimadzu Corporation (Japan), Toshiba Medical Systems Corporation (Japan), Carestream Health (U.S.), Nihon Kohden Corporation (Japan), Electrical Geodesics Inc. (U.S.), Masimo Corporation (U.S.), Hologic (U.S.), Esaote (Italy)

    Market Trends

    Increasing prevalence of neurological disorders, increasing investment by biotechnology and pharmaceutical industries in R&D, and rising need for the better treatment methods drive the growth of the market. Moreover, favorable reimbursement policies, increased application and significant investments in the development of new technologies for the treatment of diseases will fuel the market growth during the forecast period

    The evolving landscape of coma diagnosis and treatment underscores the necessity for advanced neuroimaging techniques and multidisciplinary approaches to enhance patient outcomes.

    National Institutes of Health (NIH)

    Coma Diagnosis and Treatment Market Market Drivers

    Market Growth Projections

    The Global Coma Diagnosis and Treatment Market Industry is poised for substantial growth, with projections indicating a market size of 5.93 USD Billion in 2024 and an expected increase to 13.3 USD Billion by 2035. This growth reflects a compound annual growth rate (CAGR) of 7.62% from 2025 to 2035. The expansion of the market is driven by various factors, including advancements in technology, increased healthcare investments, and a growing awareness of neurological disorders. As the healthcare landscape evolves, the demand for innovative diagnostic and treatment solutions for coma is likely to intensify, shaping the future of the industry.

    Rising Geriatric Population

    The aging population is a significant factor driving the Global Coma Diagnosis and Treatment Market Industry. As individuals age, they become more susceptible to conditions that can lead to coma, such as strokes and other neurological disorders. The United Nations projects that the global population aged 65 and older will reach 1.5 billion by 2050, highlighting the urgent need for effective coma management strategies. This demographic shift is likely to increase the demand for specialized diagnostic and treatment services, thereby contributing to the market's growth. The anticipated CAGR of 7.62% from 2025 to 2035 underscores the importance of addressing the needs of this vulnerable population.

    Growing Awareness and Education

    There is a notable increase in awareness and education regarding coma and its implications, which is positively affecting the Global Coma Diagnosis and Treatment Market Industry. Public health campaigns and educational programs are informing both healthcare professionals and the general public about the signs, symptoms, and potential treatments for coma. This heightened awareness encourages timely medical intervention, which is essential for improving patient outcomes. As more individuals recognize the importance of seeking immediate care for neurological emergencies, the demand for effective diagnosis and treatment solutions is expected to rise, further propelling market growth.

    Advancements in Diagnostic Technologies

    Technological innovations in diagnostic tools are significantly influencing the Global Coma Diagnosis and Treatment Market Industry. The introduction of advanced imaging techniques, such as MRI and CT scans, enhances the ability to accurately diagnose the underlying causes of coma. These technologies allow for rapid assessment and intervention, which is crucial in emergency settings. As healthcare providers increasingly adopt these advanced diagnostic modalities, the market is projected to expand. The global market is anticipated to reach 5.93 USD Billion in 2024, reflecting the growing reliance on sophisticated diagnostic technologies to improve patient outcomes.

    Rising Incidence of Neurological Disorders

    The Global Coma Diagnosis and Treatment Market Industry is experiencing growth due to the increasing prevalence of neurological disorders, which often lead to coma. Conditions such as traumatic brain injury, stroke, and neurodegenerative diseases are becoming more common, contributing to a higher demand for effective diagnosis and treatment options. For instance, the World Health Organization reports that stroke is a leading cause of disability worldwide, with millions affected annually. This trend is expected to drive the market, as healthcare systems seek advanced diagnostic tools and treatment protocols to manage these complex conditions effectively.

    Increased Investment in Healthcare Infrastructure

    Investment in healthcare infrastructure is a critical driver of the Global Coma Diagnosis and Treatment Market Industry. Governments and private sectors are allocating substantial resources to enhance healthcare facilities, particularly in emergency and critical care settings. This investment aims to improve the availability of specialized services for coma patients, including intensive care units and neurocritical care units. As a result, the market is likely to benefit from improved access to quality care and advanced treatment options. By 2035, the market is projected to grow to 13.3 USD Billion, indicating the positive impact of enhanced healthcare infrastructure on coma management.

    Market Segment Insights

    Regional Insights

    Key Companies in the Coma Diagnosis and Treatment Market market include

    Industry Developments

    Future Outlook

    Coma Diagnosis and Treatment Market Future Outlook

    The Global Coma Diagnosis and Treatment Market is projected to grow at a 7.62% CAGR from 2024 to 2035, driven by advancements in neuroimaging and increased awareness of brain injuries.

    New opportunities lie in:

    • Develop AI-driven diagnostic tools for faster coma assessment.
    • Invest in telemedicine platforms for remote monitoring of coma patients.
    • Create innovative rehabilitation solutions tailored for post-coma recovery.

    By 2035, the market is expected to achieve substantial growth, reflecting advancements in diagnosis and treatment methodologies.

    Market Segmentation

    Report Scope

    Attribute/Metric Details
    Market Size 2023 5.46 (USD Billion)
    Market Size 2024 5.93 (USD Billion)
    Market Size 2032 10.65 (USD Billion)
    Compound Annual Growth Rate (CAGR) 7.68 % (2024 - 2032)
    Report Coverage Revenue Forecast, Competitive Landscape, Growth Factors, and Trends
    Base Year 2023
    Market Forecast Period 2024 - 2032
    Historical Data 2019 - 2023
    Geographies Covered America, Europe, Asia Pacific, Middle East and Africa
    Key Vendors Fujifilm Holdings (Japan), GE Healthcare (U.S.), Siemens Healthcare(U.S.), Philips Healthcare (U.S.), Shimadzu Corporation (Japan), Toshiba Medical Systems Corporation (Japan),   Carestream Health (U.S.), Nihon Kohden Corporation (Japan), Electrical Geodesics Inc. (U.S.), Masimo Corporation (U.S.), Hologic (U.S.), Esaote (Italy)

    FAQs

    What is the growth rate of the global coma diagnosis & treatment market?

    coma diagnosis & treatment market can expand at 7.68% CAGR from 2024 to 2032.

    Name the major driver of the global coma diagnosis & treatment market?

    High prevalence of neurological disorders and the number of cases of coma are major drivers of the global coma diagnosis & treatment market.

    What factors can restrain the global coma diagnosis & treatment market?

    High treatment costs and limited availability of the treatment are factors which can restrain market growth.

    Which region can dominate in the global coma diagnosis & treatment market?

    The Americas can dominate the global coma diagnosis & treatment market due to a large patient pool and favorable reimbursement policies.

    Which region showcase the fastest growth in global coma diagnosis & treatment market?

    APAC can display the highest growth rate in the global coma diagnosis & treatment market due to stressful lifestyle and rapidly developing healthcare infrastructure.

    Name the biggest players of the global coma diagnosis & treatment market?

    Siemens Healthcare, GE Healthcare, Hologic, Nihon Kohden Corporation, Toshiba Medical Systems Corporation, Shimadzu Corporation, Electrical Geodesics Inc., Fujifilm Holdings, Masimo Corporation, Esaote, Philips Healthcare, and Carestream Health are notable players of the global coma diagnosis & treatment market.

    1. SECTION I: EXECUTIVE SUMMARY AND KEY HIGHLIGHTS
      1. | 1.1 EXECUTIVE SUMMARY
      2. | | 1.1.1 Market Overview
      3. | | 1.1.2 Key Findings
      4. | | 1.1.3 Market Segmentation
      5. | | 1.1.4 Competitive Landscape
      6. | | 1.1.5 Challenges and Opportunities
      7. | | 1.1.6 Future Outlook
    2. SECTION II: SCOPING, METHODOLOGY AND MARKET STRUCTURE
      1. | 2.1 MARKET INTRODUCTION
      2. | | 2.1.1 Definition
      3. | | 2.1.2 Scope of the study
      4. | | | 2.1.2.1 Research Objective
      5. | | | 2.1.2.2 Assumption
      6. | | | 2.1.2.3 Limitations
      7. | 2.2 RESEARCH METHODOLOGY
      8. | | 2.2.1 Overview
      9. | | 2.2.2 Data Mining
      10. | | 2.2.3 Secondary Research
      11. | | 2.2.4 Primary Research
      12. | | | 2.2.4.1 Primary Interviews and Information Gathering Process
      13. | | | 2.2.4.2 Breakdown of Primary Respondents
      14. | | 2.2.5 Forecasting Model
      15. | | 2.2.6 Market Size Estimation
      16. | | | 2.2.6.1 Bottom-Up Approach
      17. | | | 2.2.6.2 Top-Down Approach
      18. | | 2.2.7 Data Triangulation
      19. | | 2.2.8 Validation
    3. SECTION III: QUALITATIVE ANALYSIS
      1. | 3.1 MARKET DYNAMICS
      2. | | 3.1.1 Overview
      3. | | 3.1.2 Drivers
      4. | | 3.1.3 Restraints
      5. | | 3.1.4 Opportunities
      6. | 3.2 MARKET FACTOR ANALYSIS
      7. | | 3.2.1 Value chain Analysis
      8. | | 3.2.2 Porter's Five Forces Analysis
      9. | | | 3.2.2.1 Bargaining Power of Suppliers
      10. | | | 3.2.2.2 Bargaining Power of Buyers
      11. | | | 3.2.2.3 Threat of New Entrants
      12. | | | 3.2.2.4 Threat of Substitutes
      13. | | | 3.2.2.5 Intensity of Rivalry
      14. | | 3.2.3 COVID-19 Impact Analysis
      15. | | | 3.2.3.1 Market Impact Analysis
      16. | | | 3.2.3.2 Regional Impact
      17. | | | 3.2.3.3 Opportunity and Threat Analysis
    4. SECTION IV: QUANTITATIVE ANALYSIS
      1. | 4.1 Healthcare, BY Type (USD Billion)
      2. | | 4.1.1 toxic- metabolic encephalopathy
      3. | | 4.1.2 anoxic brain injury
      4. | | 4.1.3 persistent vegetative state
      5. | | 4.1.4 locked-in syndrome
      6. | | 4.1.5 brain death
      7. | 4.2 Healthcare, BY Diagnosis (USD Billion)
      8. | | 4.2.1 physical examination
      9. | | 4.2.2 blood test
      10. | | 4.2.3 brain scans
      11. | | 4.2.4 others
      12. | 4.3 Healthcare, BY Treatment (USD Billion)
      13. | | 4.3.1 medical treatment
      14. | | 4.3.2 others
      15. | 4.4 Healthcare, BY End User (USD Billion)
      16. | | 4.4.1 hospitals & clinics
      17. | | 4.4.2 research laboratories
      18. | | 4.4.3 others
      19. | 4.5 Healthcare, BY Region (USD Billion)
      20. | | 4.5.1 North America
      21. | | | 4.5.1.1 US
      22. | | | 4.5.1.2 Canada
      23. | | 4.5.2 Europe
      24. | | | 4.5.2.1 Germany
      25. | | | 4.5.2.2 UK
      26. | | | 4.5.2.3 France
      27. | | | 4.5.2.4 Russia
      28. | | | 4.5.2.5 Italy
      29. | | | 4.5.2.6 Spain
      30. | | | 4.5.2.7 Rest of Europe
      31. | | 4.5.3 APAC
      32. | | | 4.5.3.1 China
      33. | | | 4.5.3.2 India
      34. | | | 4.5.3.3 Japan
      35. | | | 4.5.3.4 South Korea
      36. | | | 4.5.3.5 Malaysia
      37. | | | 4.5.3.6 Thailand
      38. | | | 4.5.3.7 Indonesia
      39. | | | 4.5.3.8 Rest of APAC
      40. | | 4.5.4 South America
      41. | | | 4.5.4.1 Brazil
      42. | | | 4.5.4.2 Mexico
      43. | | | 4.5.4.3 Argentina
      44. | | | 4.5.4.4 Rest of South America
      45. | | 4.5.5 MEA
      46. | | | 4.5.5.1 GCC Countries
      47. | | | 4.5.5.2 South Africa
      48. | | | 4.5.5.3 Rest of MEA
    5. SECTION V: COMPETITIVE ANALYSIS
      1. | 5.1 Competitive Landscape
      2. | | 5.1.1 Overview
      3. | | 5.1.2 Competitive Analysis
      4. | | 5.1.3 Market share Analysis
      5. | | 5.1.4 Major Growth Strategy in the Healthcare
      6. | | 5.1.5 Competitive Benchmarking
      7. | | 5.1.6 Leading Players in Terms of Number of Developments in the Healthcare
      8. | | 5.1.7 Key developments and growth strategies
      9. | | | 5.1.7.1 New Product Launch/Service Deployment
      10. | | | 5.1.7.2 Merger & Acquisitions
      11. | | | 5.1.7.3 Joint Ventures
      12. | | 5.1.8 Major Players Financial Matrix
      13. | | | 5.1.8.1 Sales and Operating Income
      14. | | | 5.1.8.2 Major Players R&D Expenditure. 2023
      15. | 5.2 Company Profiles
      16. | | 5.2.1 Medtronic (US)
      17. | | | 5.2.1.1 Financial Overview
      18. | | | 5.2.1.2 Products Offered
      19. | | | 5.2.1.3 Key Developments
      20. | | | 5.2.1.4 SWOT Analysis
      21. | | | 5.2.1.5 Key Strategies
      22. | | 5.2.2 Siemens Healthineers (DE)
      23. | | | 5.2.2.1 Financial Overview
      24. | | | 5.2.2.2 Products Offered
      25. | | | 5.2.2.3 Key Developments
      26. | | | 5.2.2.4 SWOT Analysis
      27. | | | 5.2.2.5 Key Strategies
      28. | | 5.2.3 GE Healthcare (US)
      29. | | | 5.2.3.1 Financial Overview
      30. | | | 5.2.3.2 Products Offered
      31. | | | 5.2.3.3 Key Developments
      32. | | | 5.2.3.4 SWOT Analysis
      33. | | | 5.2.3.5 Key Strategies
      34. | | 5.2.4 Philips Healthcare (NL)
      35. | | | 5.2.4.1 Financial Overview
      36. | | | 5.2.4.2 Products Offered
      37. | | | 5.2.4.3 Key Developments
      38. | | | 5.2.4.4 SWOT Analysis
      39. | | | 5.2.4.5 Key Strategies
      40. | | 5.2.5 Baxter International (US)
      41. | | | 5.2.5.1 Financial Overview
      42. | | | 5.2.5.2 Products Offered
      43. | | | 5.2.5.3 Key Developments
      44. | | | 5.2.5.4 SWOT Analysis
      45. | | | 5.2.5.5 Key Strategies
      46. | | 5.2.6 Abbott Laboratories (US)
      47. | | | 5.2.6.1 Financial Overview
      48. | | | 5.2.6.2 Products Offered
      49. | | | 5.2.6.3 Key Developments
      50. | | | 5.2.6.4 SWOT Analysis
      51. | | | 5.2.6.5 Key Strategies
      52. | | 5.2.7 Johnson & Johnson (US)
      53. | | | 5.2.7.1 Financial Overview
      54. | | | 5.2.7.2 Products Offered
      55. | | | 5.2.7.3 Key Developments
      56. | | | 5.2.7.4 SWOT Analysis
      57. | | | 5.2.7.5 Key Strategies
      58. | | 5.2.8 Boston Scientific (US)
      59. | | | 5.2.8.1 Financial Overview
      60. | | | 5.2.8.2 Products Offered
      61. | | | 5.2.8.3 Key Developments
      62. | | | 5.2.8.4 SWOT Analysis
      63. | | | 5.2.8.5 Key Strategies
      64. | 5.3 Appendix
      65. | | 5.3.1 References
      66. | | 5.3.2 Related Reports
    6. LIST OF FIGURES
      1. | 6.1 MARKET SYNOPSIS
      2. | 6.2 NORTH AMERICA MARKET ANALYSIS
      3. | 6.3 US MARKET ANALYSIS BY TYPE
      4. | 6.4 US MARKET ANALYSIS BY DIAGNOSIS
      5. | 6.5 US MARKET ANALYSIS BY TREATMENT
      6. | 6.6 US MARKET ANALYSIS BY END USER
      7. | 6.7 CANADA MARKET ANALYSIS BY TYPE
      8. | 6.8 CANADA MARKET ANALYSIS BY DIAGNOSIS
      9. | 6.9 CANADA MARKET ANALYSIS BY TREATMENT
      10. | 6.10 CANADA MARKET ANALYSIS BY END USER
      11. | 6.11 EUROPE MARKET ANALYSIS
      12. | 6.12 GERMANY MARKET ANALYSIS BY TYPE
      13. | 6.13 GERMANY MARKET ANALYSIS BY DIAGNOSIS
      14. | 6.14 GERMANY MARKET ANALYSIS BY TREATMENT
      15. | 6.15 GERMANY MARKET ANALYSIS BY END USER
      16. | 6.16 UK MARKET ANALYSIS BY TYPE
      17. | 6.17 UK MARKET ANALYSIS BY DIAGNOSIS
      18. | 6.18 UK MARKET ANALYSIS BY TREATMENT
      19. | 6.19 UK MARKET ANALYSIS BY END USER
      20. | 6.20 FRANCE MARKET ANALYSIS BY TYPE
      21. | 6.21 FRANCE MARKET ANALYSIS BY DIAGNOSIS
      22. | 6.22 FRANCE MARKET ANALYSIS BY TREATMENT
      23. | 6.23 FRANCE MARKET ANALYSIS BY END USER
      24. | 6.24 RUSSIA MARKET ANALYSIS BY TYPE
      25. | 6.25 RUSSIA MARKET ANALYSIS BY DIAGNOSIS
      26. | 6.26 RUSSIA MARKET ANALYSIS BY TREATMENT
      27. | 6.27 RUSSIA MARKET ANALYSIS BY END USER
      28. | 6.28 ITALY MARKET ANALYSIS BY TYPE
      29. | 6.29 ITALY MARKET ANALYSIS BY DIAGNOSIS
      30. | 6.30 ITALY MARKET ANALYSIS BY TREATMENT
      31. | 6.31 ITALY MARKET ANALYSIS BY END USER
      32. | 6.32 SPAIN MARKET ANALYSIS BY TYPE
      33. | 6.33 SPAIN MARKET ANALYSIS BY DIAGNOSIS
      34. | 6.34 SPAIN MARKET ANALYSIS BY TREATMENT
      35. | 6.35 SPAIN MARKET ANALYSIS BY END USER
      36. | 6.36 REST OF EUROPE MARKET ANALYSIS BY TYPE
      37. | 6.37 REST OF EUROPE MARKET ANALYSIS BY DIAGNOSIS
      38. | 6.38 REST OF EUROPE MARKET ANALYSIS BY TREATMENT
      39. | 6.39 REST OF EUROPE MARKET ANALYSIS BY END USER
      40. | 6.40 APAC MARKET ANALYSIS
      41. | 6.41 CHINA MARKET ANALYSIS BY TYPE
      42. | 6.42 CHINA MARKET ANALYSIS BY DIAGNOSIS
      43. | 6.43 CHINA MARKET ANALYSIS BY TREATMENT
      44. | 6.44 CHINA MARKET ANALYSIS BY END USER
      45. | 6.45 INDIA MARKET ANALYSIS BY TYPE
      46. | 6.46 INDIA MARKET ANALYSIS BY DIAGNOSIS
      47. | 6.47 INDIA MARKET ANALYSIS BY TREATMENT
      48. | 6.48 INDIA MARKET ANALYSIS BY END USER
      49. | 6.49 JAPAN MARKET ANALYSIS BY TYPE
      50. | 6.50 JAPAN MARKET ANALYSIS BY DIAGNOSIS
      51. | 6.51 JAPAN MARKET ANALYSIS BY TREATMENT
      52. | 6.52 JAPAN MARKET ANALYSIS BY END USER
      53. | 6.53 SOUTH KOREA MARKET ANALYSIS BY TYPE
      54. | 6.54 SOUTH KOREA MARKET ANALYSIS BY DIAGNOSIS
      55. | 6.55 SOUTH KOREA MARKET ANALYSIS BY TREATMENT
      56. | 6.56 SOUTH KOREA MARKET ANALYSIS BY END USER
      57. | 6.57 MALAYSIA MARKET ANALYSIS BY TYPE
      58. | 6.58 MALAYSIA MARKET ANALYSIS BY DIAGNOSIS
      59. | 6.59 MALAYSIA MARKET ANALYSIS BY TREATMENT
      60. | 6.60 MALAYSIA MARKET ANALYSIS BY END USER
      61. | 6.61 THAILAND MARKET ANALYSIS BY TYPE
      62. | 6.62 THAILAND MARKET ANALYSIS BY DIAGNOSIS
      63. | 6.63 THAILAND MARKET ANALYSIS BY TREATMENT
      64. | 6.64 THAILAND MARKET ANALYSIS BY END USER
      65. | 6.65 INDONESIA MARKET ANALYSIS BY TYPE
      66. | 6.66 INDONESIA MARKET ANALYSIS BY DIAGNOSIS
      67. | 6.67 INDONESIA MARKET ANALYSIS BY TREATMENT
      68. | 6.68 INDONESIA MARKET ANALYSIS BY END USER
      69. | 6.69 REST OF APAC MARKET ANALYSIS BY TYPE
      70. | 6.70 REST OF APAC MARKET ANALYSIS BY DIAGNOSIS
      71. | 6.71 REST OF APAC MARKET ANALYSIS BY TREATMENT
      72. | 6.72 REST OF APAC MARKET ANALYSIS BY END USER
      73. | 6.73 SOUTH AMERICA MARKET ANALYSIS
      74. | 6.74 BRAZIL MARKET ANALYSIS BY TYPE
      75. | 6.75 BRAZIL MARKET ANALYSIS BY DIAGNOSIS
      76. | 6.76 BRAZIL MARKET ANALYSIS BY TREATMENT
      77. | 6.77 BRAZIL MARKET ANALYSIS BY END USER
      78. | 6.78 MEXICO MARKET ANALYSIS BY TYPE
      79. | 6.79 MEXICO MARKET ANALYSIS BY DIAGNOSIS
      80. | 6.80 MEXICO MARKET ANALYSIS BY TREATMENT
      81. | 6.81 MEXICO MARKET ANALYSIS BY END USER
      82. | 6.82 ARGENTINA MARKET ANALYSIS BY TYPE
      83. | 6.83 ARGENTINA MARKET ANALYSIS BY DIAGNOSIS
      84. | 6.84 ARGENTINA MARKET ANALYSIS BY TREATMENT
      85. | 6.85 ARGENTINA MARKET ANALYSIS BY END USER
      86. | 6.86 REST OF SOUTH AMERICA MARKET ANALYSIS BY TYPE
      87. | 6.87 REST OF SOUTH AMERICA MARKET ANALYSIS BY DIAGNOSIS
      88. | 6.88 REST OF SOUTH AMERICA MARKET ANALYSIS BY TREATMENT
      89. | 6.89 REST OF SOUTH AMERICA MARKET ANALYSIS BY END USER
      90. | 6.90 MEA MARKET ANALYSIS
      91. | 6.91 GCC COUNTRIES MARKET ANALYSIS BY TYPE
      92. | 6.92 GCC COUNTRIES MARKET ANALYSIS BY DIAGNOSIS
      93. | 6.93 GCC COUNTRIES MARKET ANALYSIS BY TREATMENT
      94. | 6.94 GCC COUNTRIES MARKET ANALYSIS BY END USER
      95. | 6.95 SOUTH AFRICA MARKET ANALYSIS BY TYPE
      96. | 6.96 SOUTH AFRICA MARKET ANALYSIS BY DIAGNOSIS
      97. | 6.97 SOUTH AFRICA MARKET ANALYSIS BY TREATMENT
      98. | 6.98 SOUTH AFRICA MARKET ANALYSIS BY END USER
      99. | 6.99 REST OF MEA MARKET ANALYSIS BY TYPE
      100. | 6.100 REST OF MEA MARKET ANALYSIS BY DIAGNOSIS
      101. | 6.101 REST OF MEA MARKET ANALYSIS BY TREATMENT
      102. | 6.102 REST OF MEA MARKET ANALYSIS BY END USER
      103. | 6.103 KEY BUYING CRITERIA OF HEALTHCARE
      104. | 6.104 RESEARCH PROCESS OF MRFR
      105. | 6.105 DRO ANALYSIS OF HEALTHCARE
      106. | 6.106 DRIVERS IMPACT ANALYSIS: HEALTHCARE
      107. | 6.107 RESTRAINTS IMPACT ANALYSIS: HEALTHCARE
      108. | 6.108 SUPPLY / VALUE CHAIN: HEALTHCARE
      109. | 6.109 HEALTHCARE, BY TYPE, 2024 (% SHARE)
      110. | 6.110 HEALTHCARE, BY TYPE, 2024 TO 2035 (USD Billion)
      111. | 6.111 HEALTHCARE, BY DIAGNOSIS, 2024 (% SHARE)
      112. | 6.112 HEALTHCARE, BY DIAGNOSIS, 2024 TO 2035 (USD Billion)
      113. | 6.113 HEALTHCARE, BY TREATMENT, 2024 (% SHARE)
      114. | 6.114 HEALTHCARE, BY TREATMENT, 2024 TO 2035 (USD Billion)
      115. | 6.115 HEALTHCARE, BY END USER, 2024 (% SHARE)
      116. | 6.116 HEALTHCARE, BY END USER, 2024 TO 2035 (USD Billion)
      117. | 6.117 BENCHMARKING OF MAJOR COMPETITORS
    7. LIST OF TABLES
      1. | 7.1 LIST OF ASSUMPTIONS
      2. | | 7.1.1
      3. | 7.2 North America MARKET SIZE ESTIMATES; FORECAST
      4. | | 7.2.1 BY TYPE, 2025-2035 (USD Billion)
      5. | | 7.2.2 BY DIAGNOSIS, 2025-2035 (USD Billion)
      6. | | 7.2.3 BY TREATMENT, 2025-2035 (USD Billion)
      7. | | 7.2.4 BY END USER, 2025-2035 (USD Billion)
      8. | 7.3 US MARKET SIZE ESTIMATES; FORECAST
      9. | | 7.3.1 BY TYPE, 2025-2035 (USD Billion)
      10. | | 7.3.2 BY DIAGNOSIS, 2025-2035 (USD Billion)
      11. | | 7.3.3 BY TREATMENT, 2025-2035 (USD Billion)
      12. | | 7.3.4 BY END USER, 2025-2035 (USD Billion)
      13. | 7.4 Canada MARKET SIZE ESTIMATES; FORECAST
      14. | | 7.4.1 BY TYPE, 2025-2035 (USD Billion)
      15. | | 7.4.2 BY DIAGNOSIS, 2025-2035 (USD Billion)
      16. | | 7.4.3 BY TREATMENT, 2025-2035 (USD Billion)
      17. | | 7.4.4 BY END USER, 2025-2035 (USD Billion)
      18. | 7.5 Europe MARKET SIZE ESTIMATES; FORECAST
      19. | | 7.5.1 BY TYPE, 2025-2035 (USD Billion)
      20. | | 7.5.2 BY DIAGNOSIS, 2025-2035 (USD Billion)
      21. | | 7.5.3 BY TREATMENT, 2025-2035 (USD Billion)
      22. | | 7.5.4 BY END USER, 2025-2035 (USD Billion)
      23. | 7.6 Germany MARKET SIZE ESTIMATES; FORECAST
      24. | | 7.6.1 BY TYPE, 2025-2035 (USD Billion)
      25. | | 7.6.2 BY DIAGNOSIS, 2025-2035 (USD Billion)
      26. | | 7.6.3 BY TREATMENT, 2025-2035 (USD Billion)
      27. | | 7.6.4 BY END USER, 2025-2035 (USD Billion)
      28. | 7.7 UK MARKET SIZE ESTIMATES; FORECAST
      29. | | 7.7.1 BY TYPE, 2025-2035 (USD Billion)
      30. | | 7.7.2 BY DIAGNOSIS, 2025-2035 (USD Billion)
      31. | | 7.7.3 BY TREATMENT, 2025-2035 (USD Billion)
      32. | | 7.7.4 BY END USER, 2025-2035 (USD Billion)
      33. | 7.8 France MARKET SIZE ESTIMATES; FORECAST
      34. | | 7.8.1 BY TYPE, 2025-2035 (USD Billion)
      35. | | 7.8.2 BY DIAGNOSIS, 2025-2035 (USD Billion)
      36. | | 7.8.3 BY TREATMENT, 2025-2035 (USD Billion)
      37. | | 7.8.4 BY END USER, 2025-2035 (USD Billion)
      38. | 7.9 Russia MARKET SIZE ESTIMATES; FORECAST
      39. | | 7.9.1 BY TYPE, 2025-2035 (USD Billion)
      40. | | 7.9.2 BY DIAGNOSIS, 2025-2035 (USD Billion)
      41. | | 7.9.3 BY TREATMENT, 2025-2035 (USD Billion)
      42. | | 7.9.4 BY END USER, 2025-2035 (USD Billion)
      43. | 7.10 Italy MARKET SIZE ESTIMATES; FORECAST
      44. | | 7.10.1 BY TYPE, 2025-2035 (USD Billion)
      45. | | 7.10.2 BY DIAGNOSIS, 2025-2035 (USD Billion)
      46. | | 7.10.3 BY TREATMENT, 2025-2035 (USD Billion)
      47. | | 7.10.4 BY END USER, 2025-2035 (USD Billion)
      48. | 7.11 Spain MARKET SIZE ESTIMATES; FORECAST
      49. | | 7.11.1 BY TYPE, 2025-2035 (USD Billion)
      50. | | 7.11.2 BY DIAGNOSIS, 2025-2035 (USD Billion)
      51. | | 7.11.3 BY TREATMENT, 2025-2035 (USD Billion)
      52. | | 7.11.4 BY END USER, 2025-2035 (USD Billion)
      53. | 7.12 Rest of Europe MARKET SIZE ESTIMATES; FORECAST
      54. | | 7.12.1 BY TYPE, 2025-2035 (USD Billion)
      55. | | 7.12.2 BY DIAGNOSIS, 2025-2035 (USD Billion)
      56. | | 7.12.3 BY TREATMENT, 2025-2035 (USD Billion)
      57. | | 7.12.4 BY END USER, 2025-2035 (USD Billion)
      58. | 7.13 APAC MARKET SIZE ESTIMATES; FORECAST
      59. | | 7.13.1 BY TYPE, 2025-2035 (USD Billion)
      60. | | 7.13.2 BY DIAGNOSIS, 2025-2035 (USD Billion)
      61. | | 7.13.3 BY TREATMENT, 2025-2035 (USD Billion)
      62. | | 7.13.4 BY END USER, 2025-2035 (USD Billion)
      63. | 7.14 China MARKET SIZE ESTIMATES; FORECAST
      64. | | 7.14.1 BY TYPE, 2025-2035 (USD Billion)
      65. | | 7.14.2 BY DIAGNOSIS, 2025-2035 (USD Billion)
      66. | | 7.14.3 BY TREATMENT, 2025-2035 (USD Billion)
      67. | | 7.14.4 BY END USER, 2025-2035 (USD Billion)
      68. | 7.15 India MARKET SIZE ESTIMATES; FORECAST
      69. | | 7.15.1 BY TYPE, 2025-2035 (USD Billion)
      70. | | 7.15.2 BY DIAGNOSIS, 2025-2035 (USD Billion)
      71. | | 7.15.3 BY TREATMENT, 2025-2035 (USD Billion)
      72. | | 7.15.4 BY END USER, 2025-2035 (USD Billion)
      73. | 7.16 Japan MARKET SIZE ESTIMATES; FORECAST
      74. | | 7.16.1 BY TYPE, 2025-2035 (USD Billion)
      75. | | 7.16.2 BY DIAGNOSIS, 2025-2035 (USD Billion)
      76. | | 7.16.3 BY TREATMENT, 2025-2035 (USD Billion)
      77. | | 7.16.4 BY END USER, 2025-2035 (USD Billion)
      78. | 7.17 South Korea MARKET SIZE ESTIMATES; FORECAST
      79. | | 7.17.1 BY TYPE, 2025-2035 (USD Billion)
      80. | | 7.17.2 BY DIAGNOSIS, 2025-2035 (USD Billion)
      81. | | 7.17.3 BY TREATMENT, 2025-2035 (USD Billion)
      82. | | 7.17.4 BY END USER, 2025-2035 (USD Billion)
      83. | 7.18 Malaysia MARKET SIZE ESTIMATES; FORECAST
      84. | | 7.18.1 BY TYPE, 2025-2035 (USD Billion)
      85. | | 7.18.2 BY DIAGNOSIS, 2025-2035 (USD Billion)
      86. | | 7.18.3 BY TREATMENT, 2025-2035 (USD Billion)
      87. | | 7.18.4 BY END USER, 2025-2035 (USD Billion)
      88. | 7.19 Thailand MARKET SIZE ESTIMATES; FORECAST
      89. | | 7.19.1 BY TYPE, 2025-2035 (USD Billion)
      90. | | 7.19.2 BY DIAGNOSIS, 2025-2035 (USD Billion)
      91. | | 7.19.3 BY TREATMENT, 2025-2035 (USD Billion)
      92. | | 7.19.4 BY END USER, 2025-2035 (USD Billion)
      93. | 7.20 Indonesia MARKET SIZE ESTIMATES; FORECAST
      94. | | 7.20.1 BY TYPE, 2025-2035 (USD Billion)
      95. | | 7.20.2 BY DIAGNOSIS, 2025-2035 (USD Billion)
      96. | | 7.20.3 BY TREATMENT, 2025-2035 (USD Billion)
      97. | | 7.20.4 BY END USER, 2025-2035 (USD Billion)
      98. | 7.21 Rest of APAC MARKET SIZE ESTIMATES; FORECAST
      99. | | 7.21.1 BY TYPE, 2025-2035 (USD Billion)
      100. | | 7.21.2 BY DIAGNOSIS, 2025-2035 (USD Billion)
      101. | | 7.21.3 BY TREATMENT, 2025-2035 (USD Billion)
      102. | | 7.21.4 BY END USER, 2025-2035 (USD Billion)
      103. | 7.22 South America MARKET SIZE ESTIMATES; FORECAST
      104. | | 7.22.1 BY TYPE, 2025-2035 (USD Billion)
      105. | | 7.22.2 BY DIAGNOSIS, 2025-2035 (USD Billion)
      106. | | 7.22.3 BY TREATMENT, 2025-2035 (USD Billion)
      107. | | 7.22.4 BY END USER, 2025-2035 (USD Billion)
      108. | 7.23 Brazil MARKET SIZE ESTIMATES; FORECAST
      109. | | 7.23.1 BY TYPE, 2025-2035 (USD Billion)
      110. | | 7.23.2 BY DIAGNOSIS, 2025-2035 (USD Billion)
      111. | | 7.23.3 BY TREATMENT, 2025-2035 (USD Billion)
      112. | | 7.23.4 BY END USER, 2025-2035 (USD Billion)
      113. | 7.24 Mexico MARKET SIZE ESTIMATES; FORECAST
      114. | | 7.24.1 BY TYPE, 2025-2035 (USD Billion)
      115. | | 7.24.2 BY DIAGNOSIS, 2025-2035 (USD Billion)
      116. | | 7.24.3 BY TREATMENT, 2025-2035 (USD Billion)
      117. | | 7.24.4 BY END USER, 2025-2035 (USD Billion)
      118. | 7.25 Argentina MARKET SIZE ESTIMATES; FORECAST
      119. | | 7.25.1 BY TYPE, 2025-2035 (USD Billion)
      120. | | 7.25.2 BY DIAGNOSIS, 2025-2035 (USD Billion)
      121. | | 7.25.3 BY TREATMENT, 2025-2035 (USD Billion)
      122. | | 7.25.4 BY END USER, 2025-2035 (USD Billion)
      123. | 7.26 Rest of South America MARKET SIZE ESTIMATES; FORECAST
      124. | | 7.26.1 BY TYPE, 2025-2035 (USD Billion)
      125. | | 7.26.2 BY DIAGNOSIS, 2025-2035 (USD Billion)
      126. | | 7.26.3 BY TREATMENT, 2025-2035 (USD Billion)
      127. | | 7.26.4 BY END USER, 2025-2035 (USD Billion)
      128. | 7.27 MEA MARKET SIZE ESTIMATES; FORECAST
      129. | | 7.27.1 BY TYPE, 2025-2035 (USD Billion)
      130. | | 7.27.2 BY DIAGNOSIS, 2025-2035 (USD Billion)
      131. | | 7.27.3 BY TREATMENT, 2025-2035 (USD Billion)
      132. | | 7.27.4 BY END USER, 2025-2035 (USD Billion)
      133. | 7.28 GCC Countries MARKET SIZE ESTIMATES; FORECAST
      134. | | 7.28.1 BY TYPE, 2025-2035 (USD Billion)
      135. | | 7.28.2 BY DIAGNOSIS, 2025-2035 (USD Billion)
      136. | | 7.28.3 BY TREATMENT, 2025-2035 (USD Billion)
      137. | | 7.28.4 BY END USER, 2025-2035 (USD Billion)
      138. | 7.29 South Africa MARKET SIZE ESTIMATES; FORECAST
      139. | | 7.29.1 BY TYPE, 2025-2035 (USD Billion)
      140. | | 7.29.2 BY DIAGNOSIS, 2025-2035 (USD Billion)
      141. | | 7.29.3 BY TREATMENT, 2025-2035 (USD Billion)
      142. | | 7.29.4 BY END USER, 2025-2035 (USD Billion)
      143. | 7.30 Rest of MEA MARKET SIZE ESTIMATES; FORECAST
      144. | | 7.30.1 BY TYPE, 2025-2035 (USD Billion)
      145. | | 7.30.2 BY DIAGNOSIS, 2025-2035 (USD Billion)
      146. | | 7.30.3 BY TREATMENT, 2025-2035 (USD Billion)
      147. | | 7.30.4 BY END USER, 2025-2035 (USD Billion)
      148. | 7.31 PRODUCT LAUNCH/PRODUCT DEVELOPMENT/APPROVAL
      149. | | 7.31.1
      150. | 7.32 ACQUISITION/PARTNERSHIP
      151. | | 7.32.1

    Coma Diagnosis and Treatment Market Segmentation

    Market Segmentation Overview

    • Detailed segmentation data will be available in the full report
    • Comprehensive analysis by multiple parameters
    • Regional and country-level breakdowns
    • Market size forecasts by segment
    Infographic

    Free Sample Request

    Kindly complete the form below to receive a free sample of this Report

    Get Free Sample

    Customer Strories

    “I am very pleased with how market segments have been defined in a relevant way for my purposes (such as "Portable Freezers & refrigerators" and "last-mile"). In general the report is well structured. Thanks very much for your efforts.”

    Victoria Milne

    Founder
    Case Study
    Chemicals and Materials

    Compare Licence

    ×
    Features License Type
    Single User Multiuser License Enterprise User
    Price $4,950 $5,950 $7,250
    Maximum User Access Limit 1 User Upto 10 Users Unrestricted Access Throughout the Organization
    Free Customization
    Direct Access to Analyst
    Deliverable Format
    Platform Access
    Discount on Next Purchase 10% 15% 15%
    Printable Versions