• Cat-intel
  • MedIntelliX
  • Resources
  • About Us
  • Hero Background
    English
    Chinese
    French
    Japanese
    Korean
    German
    Spanish

    Chlamydia Infection Treatment Market Size

    ID: MRFR/HC/9108-HCR
    142 Pages
    Kinjoll Dey
    October 2025

    Chlamydia Infection Treatment Market Research Report Information By Product Type (Freac Sand, Resin-Coated Proppant, Ceramic Proppant) By Application (Shale Gas, Tight Gas, Coal Bed Methane) By Region ( North America, Europe, Asia Pacific, Latin America, Middle East & Africa) Forecast till 2035

    Share:
    Download PDF ×

    We do not share your information with anyone. However, we may send you emails based on your report interest from time to time. You may contact us at any time to opt-out.

    Chlamydia Infection Treatment Market Infographic
    Purchase Options

    Chlamydia Infection Treatment Size

    Chlamydia Infection Treatment Market Growth Projections and Opportunities

    The market for Chlamydia infection treatment is closely linked to prevalence and incidence rates. The link is crucial. Since chlamydia is one of the most frequent sexually transmitted infections, effective and efficient alternative treatments are in demand.

    Chlamydia infection therapy is being greatly impacted by advanced diagnostic tools. Accurate and fast diagnostic technologies are needed to detect illnesses sooner, leading to quick treatment and market development. Public awareness campaigns on chlamydia and other STDs affect market dynamics. Other STDs are addressed by these activities. Market growth is driven by healthcare organizations and government initiatives to educate the public about timely diagnosis and treatment. Regulatory frameworks and government funding affect the Chlamydia infection treatment business. Strong rules to ensure pharmaceutical safety and efficacy and financial help for research and development to encourage treatment innovation are needed. Both items are required. The emergence of antibiotic-resistant Chlamydia strains worries the market. Academics and pharmaceutical businesses are investigating new treatments to overcome resistance. Thus, the product market is becoming more competitive. The global healthcare and medication spending market is crucial to Chlamydia infection therapy. Economics and healthcare spending can affect the availability of alternative treatments and the uptake of new drugs. The market is growing because to therapeutic advances such new antibiotics and other treatments. Pharmaceutical companies invest in R&D to improve treatment efficacy, creating a dynamic industry. Telemedicine and digital health platforms have a huge impact on the chlamydia treatment business. These systems improve access to healthcare, simplify distant consultations, and speed up chlamydia treatment. Market trends are affected by patient preferences and treatment adherence. Patients' preferred treatment alternatives are expected to gain commercial acceptance. These treatments may have easier dosage or fewer negative effects. Partnerships between healthcare, research, and pharmaceutical firms drive industry growth. These collaborations are crucial to market growth. Partnerships accelerate clinical studies, increase research capacity, and help provide new Chlamydia treatments. Healthcare infrastructure, especially in poor nations, affects the chlamydia infection treatment industry. The patient pool is growing due to healthcare facility upgrades and increased access to doctors and services. Insurance coverage and payment rules affect chlamydia treatment cost and availability. Advantageous payment arrangements may drive market adoption, increasing patient treatment options.
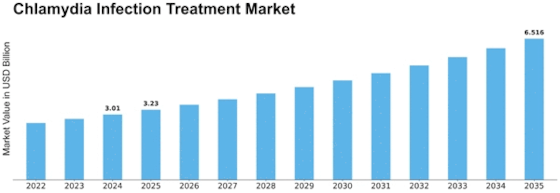
    Chlamydia Infection Treatment Market Size Graph
    Author
    Kinjoll Dey
    Research Analyst Level I

    He is an extremely curious individual currently working in Healthcare and Medical Devices Domain. Kinjoll is comfortably versed in data centric research backed by healthcare educational background. He leverages extensive data mining and analytics tools such as Primary and Secondary Research, Statistical Analysis, Machine Learning, Data Modelling. His key role also involves Technical Sales Support, Client Interaction and Project management within the Healthcare team. Lastly, he showcases extensive affinity towards learning new skills and remain fascinated in implementing them.

    Leave a Comment

    FAQs

    At what CAGR is the Chlamydia Infection Treatment Market projected to grow during the forecast period?

    Chlamydia Infection Treatment Market is projected to grow at a 7.28% CAGR between 2024-2032.

    What will be the value of the Chlamydia Infection Treatment Market during the forecast period?

    Chlamydia Infection Treatment Market predicted to touch USD 5.27 Billion by 2032.

    What are the key factors driving the Chlamydia Infection Treatment Market?

    Rise in sexually transmitted disease and increasing incidence of chlamydia and government initiatives to promote awareness for the STDs are adding market growth.

    What are the Product Type included in the Chlamydia Infection Treatment Market?

    The Product Type included in Freac Sand, Resin-Coated Proppant, Ceramic Proppant.

    Market Summary

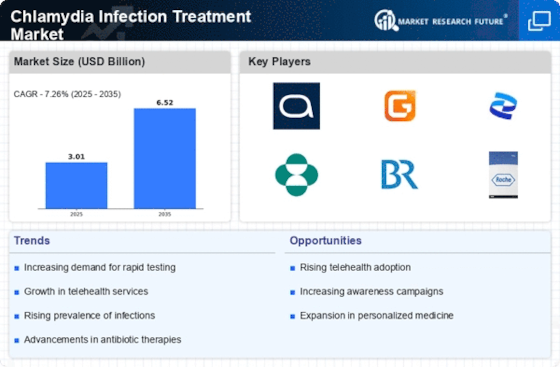
    As per MRFR analysis, the Chlamydia Infection Treatment Market was estimated at 3.014 USD Billion in 2024. The Chlamydia Infection Treatment industry is projected to grow from 3.233 USD Billion in 2025 to 6.516 USD Billion by 2035, exhibiting a compound annual growth rate (CAGR) of 7.26 during the forecast period 2025 - 2035.

    Key Market Trends & Highlights

    The Chlamydia Infection Treatment Market is experiencing notable growth driven by increased awareness and technological advancements.

    • North America remains the largest market for Chlamydia infection treatment, reflecting a robust healthcare infrastructure.
    • The Asia-Pacific region is emerging as the fastest-growing market, driven by rising healthcare access and awareness.
    • Chlamydia trachomatis continues to dominate the market, while Chlamydophila pneumoniae is witnessing rapid growth.
    • Key market drivers include the rising incidence of Chlamydia infections and increased focus on sexual health education.

    Market Size & Forecast

    2024 Market Size 3.014 (USD Billion)
    2035 Market Size 6.516 (USD Billion)
    CAGR (2025 - 2035) 7.26%
    Largest Regional Market Share in 2024 North America

    Major Players

    <p>AbbVie (US), GSK (GB), Pfizer (US), Merck & Co. (US), Bayer (DE), Hoffmann-La Roche (CH), AstraZeneca (GB), Sanofi (FR), Teva Pharmaceutical Industries (IL)</p>

    Market Trends

    The Chlamydia Infection Treatment Market is currently experiencing notable shifts driven by various factors. Increased awareness regarding sexually transmitted infections, particularly chlamydia, has led to heightened demand for effective treatment options. Healthcare providers are focusing on early diagnosis and intervention, which appears to be crucial in curbing the spread of this infection. Furthermore, advancements in diagnostic technologies are facilitating quicker and more accurate identification of chlamydia, thereby enhancing treatment outcomes. This evolving landscape suggests a growing emphasis on preventive measures and education, which may further influence market dynamics. In addition, the rise of telemedicine is reshaping how patients access treatment for chlamydia. Remote consultations and online prescriptions are becoming more prevalent, allowing individuals to seek care discreetly and conveniently. This trend could potentially expand the reach of treatment services, particularly among younger populations who may prefer digital solutions. As the Chlamydia Infection Treatment Market continues to evolve, stakeholders must remain vigilant to emerging trends and adapt their strategies accordingly to meet the changing needs of patients and healthcare systems.

    Increased Awareness and Education

    There is a growing focus on public health campaigns aimed at educating individuals about chlamydia and its implications. This trend is likely to enhance understanding and encourage proactive health-seeking behavior.

    Advancements in Diagnostic Technologies

    Innovations in testing methods are improving the speed and accuracy of chlamydia diagnoses. These advancements may lead to earlier treatment initiation, which is essential for effective management.

    Telemedicine Adoption

    The integration of telehealth services is transforming patient access to chlamydia treatment. This shift could facilitate greater convenience and privacy for individuals seeking care.

    The rising prevalence of chlamydia infections among young adults necessitates a robust response in treatment strategies and public health initiatives.

    Centers for Disease Control and Prevention (CDC)

    Chlamydia Infection Treatment Market Market Drivers

    Government Initiatives and Funding

    Government initiatives aimed at combating sexually transmitted infections, including chlamydia, play a crucial role in shaping the Chlamydia Infection Treatment Market. Various health departments have launched campaigns to promote screening and treatment, which are often supported by funding for public health programs. For instance, initiatives that provide free or subsidized testing and treatment services have been implemented in numerous regions, thereby increasing access to care. This financial support not only enhances the availability of treatment options but also encourages healthcare providers to adopt new therapies. The commitment of governments to reduce the burden of chlamydia infections through policy and funding is likely to drive growth in the Chlamydia Infection Treatment Market, as more individuals seek treatment and preventive measures.

    Rising Incidence of Chlamydia Infections

    The increasing prevalence of chlamydia infections is a primary driver for the Chlamydia Infection Treatment Market. According to recent data, chlamydia remains one of the most commonly reported sexually transmitted infections, particularly among young adults aged 15 to 24. This demographic accounts for a significant proportion of new cases, which has prompted healthcare providers to focus on effective treatment options. The rise in infection rates necessitates a corresponding increase in treatment availability, thereby expanding the market. Furthermore, the growing recognition of the long-term health implications associated with untreated chlamydia, such as infertility and pelvic inflammatory disease, underscores the urgency for effective treatment solutions. As awareness continues to grow, the demand for innovative therapies and medications within the Chlamydia Infection Treatment Market is likely to escalate.

    Growing Acceptance of Telehealth Services

    The growing acceptance of telehealth services is reshaping the landscape of the Chlamydia Infection Treatment Market. Telemedicine offers a convenient and accessible means for individuals to receive consultations, screenings, and prescriptions without the need for in-person visits. This is particularly beneficial for populations that may face barriers to accessing traditional healthcare services, such as those in rural areas or individuals with mobility issues. The COVID-19 pandemic has accelerated the adoption of telehealth, and this trend appears to be continuing as patients appreciate the flexibility and privacy it offers. As telehealth becomes a standard component of healthcare delivery, it is likely to enhance the reach of chlamydia treatment services, thereby expanding the Chlamydia Infection Treatment Market.

    Increased Focus on Sexual Health Education

    The heightened focus on sexual health education is a significant driver for the Chlamydia Infection Treatment Market. Educational programs aimed at raising awareness about sexually transmitted infections, including chlamydia, have become more prevalent in schools and community organizations. These initiatives emphasize the importance of regular testing and prompt treatment, which can lead to earlier diagnosis and intervention. As individuals become more informed about the risks associated with chlamydia, they are more likely to seek treatment, thereby increasing market demand. Furthermore, the integration of sexual health education into broader public health strategies is likely to foster a culture of proactive health management, further propelling the Chlamydia Infection Treatment Market forward.

    Technological Advancements in Treatment Options

    Technological advancements in treatment options are significantly influencing the Chlamydia Infection Treatment Market. The development of new antibiotics and alternative therapies has expanded the arsenal available to healthcare providers. Recent innovations include single-dose treatments that enhance patient compliance and reduce the risk of complications. Additionally, the emergence of personalized medicine approaches, which tailor treatments based on individual patient profiles, is gaining traction. These advancements not only improve treatment outcomes but also attract investment in research and development within the market. As healthcare systems increasingly adopt these innovative solutions, the Chlamydia Infection Treatment Market is poised for growth, driven by the demand for more effective and patient-friendly treatment modalities.

    Market Segment Insights

    By Causative Organisms: Chlamydia trachomatis (Largest) vs. Chlamydophila pneumoniae (Fastest-Growing)

    <p>In the Chlamydia Infection Treatment Market, Chlamydia trachomatis stands out as the dominant causative organism, commanding a significant portion of the market share. This organism has been the primary focus of treatment protocols and research initiatives, making it a well-established entity within therapeutic avenues. Conversely, Chlamydophila pneumoniae, while traditionally considered less prevalent, has begun to capture attention due to rising awareness and improved diagnostic capabilities, allowing for better recognition and treatment options.</p>

    <p>Causative Organisms: Chlamydia trachomatis (Dominant) vs. Chlamydophila pneumoniae (Emerging)</p>

    <p>Chlamydia trachomatis remains dominant in the Chlamydia Infection Treatment Market, largely attributed to its high prevalence and established clinical treatment avenues. It presents a familiar landscape for healthcare providers, with optimized therapies tailored to combat the associated infections effectively. On the other hand, Chlamydophila pneumoniae is emerging as a significant player in this segment. Its clinical spectrum, which includes respiratory infections as well, prompts a growing interest in comprehensive treatment strategies. This evolution can be linked to advancements in diagnostic technologies, leading to better detection rates and, subsequently, a more effective management of infections caused by this pathogen.</p>

    By Route of Administration: Oral (Largest) vs. Injectable (Fastest-Growing)

    <p>In the Chlamydia Infection Treatment Market, the Route of Administration segment is characterized by significant diversity. Oral administration is currently the largest segment, as it offers patient-friendly options that promote adherence to treatment. Injectable treatments, while taking a smaller share currently, have been noted for their rising market presence due to their targeted delivery and effectiveness. Growth trends indicate that injectable treatments are becoming the fastest-growing segment within this market. This shift is driven by various factors, including advancements in drug formulation and an increase in the prevalence of chlamydia infections. Additionally, healthcare providers are increasingly advocating for injectable options due to their rapid efficacy, which supports the growing preference among patients and clinicians for such delivery methods.</p>

    <p>Oral (Dominant) vs. Injectable (Emerging)</p>

    <p>In the landscape of Chlamydia Infection Treatment, Oral administration stands out as the dominant method. Its easy accessibility and convenience contribute to higher patient adherence compared to other methods. Oral treatments often lead to fewer complications and can be self-administered, making them a preferred choice for many. Conversely, Injectable options are emerging as a compelling alternative, driven by advances in drug technology that enhance their efficacy. While currently less favored, injectables offer faster action and targeted delivery, making them attractive in managing acute cases. The ongoing development in injectable formulations is likely to boost their acceptance, signaling a future shift in administration preferences within the market.</p>

    By Distribution Channel: Hospital Pharmacy (Largest) vs. Online Pharmacy (Fastest-Growing)

    <p>In the Chlamydia Infection Treatment Market, the distribution channel plays a pivotal role in accessibility and patient adherence to treatment regimens. Hospital pharmacies lead the market, accounting for a significant share due to their integration within the healthcare system, providing immediate access to medications for inpatients and outpatients alike. Meanwhile, online pharmacies are gaining traction, catering to a growing demographic that prefers the convenience and privacy of home delivery for sensitive conditions such as chlamydia infections. The growth trends within these distribution channels are shaped by shifting consumer behaviors and technological advancements. The surge in e-commerce and the increasing reliance on telemedicine are driving the rapid expansion of online pharmacies. This segment is positioned to capitalize on the trend of self-diagnosis and engagement with healthcare solutions remotely, appealing particularly to younger, tech-savvy consumers who prioritize convenience and confidentiality.</p>

    <p>Hospital Pharmacy (Dominant) vs. Online Pharmacy (Emerging)</p>

    <p>Hospital pharmacies are characterized by their ability to provide immediate access to chlamydia treatment, ensuring patients receive medications in a timely manner as part of their overall care plan. They excel in managing inventory closely aligned with clinical needs and facilitating direct healthcare provider-patient communication. Conversely, online pharmacies represent an emerging wave within the market, appealing to consumers looking for discretion and convenience. Their growth is fueled by innovations in e-prescribing and digital health solutions, making it easier for patients to order medications without visiting traditional pharmacies. The competition in this space is increasing, with online pharmacies enhancing their delivery mechanisms and customer engagement strategies, positioning them as a significant player in the future of healthcare delivery.</p>

    Get more detailed insights about Chlamydia Infection Treatment Market Research Report—Forecast till 2035

    Regional Insights

    Key Companies in the Chlamydia Infection Treatment Market market include

    Industry Developments

      • In August 2019,Statens Serum Institut, completed clinical phase 1 trial for first-generation vaccine candidate (CTH522), based on the major outer membrane protein of the C trachomatis The vaccine will provide a promising preventive therapy for chlamydia infection
      • In March 2019, the Global Antibiotic Research and Development Partnership (GARDP) announced a public-private partnership with Evotec AG for the development of first-in-class antibiotics for the treatment of drug-resistant bacterial infections
      • In 2018, the National Institutes of Health (NIH) made a significant new investment in vaccine research for gonorrhea, chlamydia, and syphilis. Furthermore, an investment of USD 9 million was anticipated to be made in 2019 to fund three to five grants for the research

    Future Outlook

    Chlamydia Infection Treatment Market Future Outlook

    <p>The Chlamydia Infection Treatment Market is projected to grow at a 7.26% CAGR from 2024 to 2035, driven by increasing awareness, advancements in diagnostics, and rising healthcare expenditure.</p>

    New opportunities lie in:

    • <p>Development of telehealth platforms for remote consultations and prescriptions.</p>
    • <p>Investment in rapid diagnostic testing kits for early detection.</p>
    • <p>Expansion of educational campaigns targeting high-risk populations.</p>

    <p>By 2035, the market is expected to achieve substantial growth, reflecting enhanced treatment accessibility and innovation.</p>

    Market Segmentation

    Chlamydia Infection Treatment Market Causative Organisms Outlook

    • Chlamydia trachomatis
    • Chlamydophila pneumoniae

    Chlamydia Infection Treatment Market Distribution Channel Outlook

    • Hospital Pharmacy
    • Online Pharmacy
    • Retail Pharmacy
    • Others

    Chlamydia Infection Treatment Market Route of Administration Outlook

    • Oral
    • Injectable
    • Others

    Report Scope

    MARKET SIZE 20243.014(USD Billion)
    MARKET SIZE 20253.233(USD Billion)
    MARKET SIZE 20356.516(USD Billion)
    COMPOUND ANNUAL GROWTH RATE (CAGR)7.26% (2024 - 2035)
    REPORT COVERAGERevenue Forecast, Competitive Landscape, Growth Factors, and Trends
    BASE YEAR2024
    Market Forecast Period2025 - 2035
    Historical Data2019 - 2024
    Market Forecast UnitsUSD Billion
    Key Companies ProfiledMarket analysis in progress
    Segments CoveredMarket segmentation analysis in progress
    Key Market OpportunitiesIntegration of telehealth services enhances access to Chlamydia Infection Treatment Market solutions.
    Key Market DynamicsRising demand for effective treatments drives innovation and competition in the Chlamydia Infection Treatment Market.
    Countries CoveredNorth America, Europe, APAC, South America, MEA

    FAQs

    At what CAGR is the Chlamydia Infection Treatment Market projected to grow during the forecast period?

    Chlamydia Infection Treatment Market is projected to grow at a 7.28% CAGR between 2024-2032.

    What will be the value of the Chlamydia Infection Treatment Market during the forecast period?

    Chlamydia Infection Treatment Market predicted to touch USD 5.27 Billion by 2032.

    What are the key factors driving the Chlamydia Infection Treatment Market?

    Rise in sexually transmitted disease and increasing incidence of chlamydia and government initiatives to promote awareness for the STDs are adding market growth.

    What are the Product Type included in the Chlamydia Infection Treatment Market?

    The Product Type included in Freac Sand, Resin-Coated Proppant, Ceramic Proppant.

    1. SECTION I: EXECUTIVE SUMMARY AND KEY HIGHLIGHTS
      1. | 1.1 EXECUTIVE SUMMARY
      2. | | 1.1.1 Market Overview
      3. | | 1.1.2 Key Findings
      4. | | 1.1.3 Market Segmentation
      5. | | 1.1.4 Competitive Landscape
      6. | | 1.1.5 Challenges and Opportunities
      7. | | 1.1.6 Future Outlook
    2. SECTION II: SCOPING, METHODOLOGY AND MARKET STRUCTURE
      1. | 2.1 MARKET INTRODUCTION
      2. | | 2.1.1 Definition
      3. | | 2.1.2 Scope of the study
      4. | | | 2.1.2.1 Research Objective
      5. | | | 2.1.2.2 Assumption
      6. | | | 2.1.2.3 Limitations
      7. | 2.2 RESEARCH METHODOLOGY
      8. | | 2.2.1 Overview
      9. | | 2.2.2 Data Mining
      10. | | 2.2.3 Secondary Research
      11. | | 2.2.4 Primary Research
      12. | | | 2.2.4.1 Primary Interviews and Information Gathering Process
      13. | | | 2.2.4.2 Breakdown of Primary Respondents
      14. | | 2.2.5 Forecasting Model
      15. | | 2.2.6 Market Size Estimation
      16. | | | 2.2.6.1 Bottom-Up Approach
      17. | | | 2.2.6.2 Top-Down Approach
      18. | | 2.2.7 Data Triangulation
      19. | | 2.2.8 Validation
    3. SECTION III: QUALITATIVE ANALYSIS
      1. | 3.1 MARKET DYNAMICS
      2. | | 3.1.1 Overview
      3. | | 3.1.2 Drivers
      4. | | 3.1.3 Restraints
      5. | | 3.1.4 Opportunities
      6. | 3.2 MARKET FACTOR ANALYSIS
      7. | | 3.2.1 Value chain Analysis
      8. | | 3.2.2 Porter's Five Forces Analysis
      9. | | | 3.2.2.1 Bargaining Power of Suppliers
      10. | | | 3.2.2.2 Bargaining Power of Buyers
      11. | | | 3.2.2.3 Threat of New Entrants
      12. | | | 3.2.2.4 Threat of Substitutes
      13. | | | 3.2.2.5 Intensity of Rivalry
      14. | | 3.2.3 COVID-19 Impact Analysis
      15. | | | 3.2.3.1 Market Impact Analysis
      16. | | | 3.2.3.2 Regional Impact
      17. | | | 3.2.3.3 Opportunity and Threat Analysis
    4. SECTION IV: QUANTITATIVE ANALYSIS
      1. | 4.1 Healthcare, BY Causative Organisms (USD Billion)
      2. | | 4.1.1 Chlamydia trachomatis
      3. | | 4.1.2 Chlamydophila pneumoniae
      4. | 4.2 Healthcare, BY Route of Administration (USD Billion)
      5. | | 4.2.1 Oral
      6. | | 4.2.2 Injectable
      7. | | 4.2.3 Others
      8. | 4.3 Healthcare, BY Distribution Channel (USD Billion)
      9. | | 4.3.1 Hospital Pharmacy
      10. | | 4.3.2 Online Pharmacy
      11. | | 4.3.3 Retail Pharmacy
      12. | | 4.3.4 Others
      13. | 4.4 Healthcare, BY Region (USD Billion)
      14. | | 4.4.1 North America
      15. | | | 4.4.1.1 US
      16. | | | 4.4.1.2 Canada
      17. | | 4.4.2 Europe
      18. | | | 4.4.2.1 Germany
      19. | | | 4.4.2.2 UK
      20. | | | 4.4.2.3 France
      21. | | | 4.4.2.4 Russia
      22. | | | 4.4.2.5 Italy
      23. | | | 4.4.2.6 Spain
      24. | | | 4.4.2.7 Rest of Europe
      25. | | 4.4.3 APAC
      26. | | | 4.4.3.1 China
      27. | | | 4.4.3.2 India
      28. | | | 4.4.3.3 Japan
      29. | | | 4.4.3.4 South Korea
      30. | | | 4.4.3.5 Malaysia
      31. | | | 4.4.3.6 Thailand
      32. | | | 4.4.3.7 Indonesia
      33. | | | 4.4.3.8 Rest of APAC
      34. | | 4.4.4 South America
      35. | | | 4.4.4.1 Brazil
      36. | | | 4.4.4.2 Mexico
      37. | | | 4.4.4.3 Argentina
      38. | | | 4.4.4.4 Rest of South America
      39. | | 4.4.5 MEA
      40. | | | 4.4.5.1 GCC Countries
      41. | | | 4.4.5.2 South Africa
      42. | | | 4.4.5.3 Rest of MEA
    5. SECTION V: COMPETITIVE ANALYSIS
      1. | 5.1 Competitive Landscape
      2. | | 5.1.1 Overview
      3. | | 5.1.2 Competitive Analysis
      4. | | 5.1.3 Market share Analysis
      5. | | 5.1.4 Major Growth Strategy in the Healthcare
      6. | | 5.1.5 Competitive Benchmarking
      7. | | 5.1.6 Leading Players in Terms of Number of Developments in the Healthcare
      8. | | 5.1.7 Key developments and growth strategies
      9. | | | 5.1.7.1 New Product Launch/Service Deployment
      10. | | | 5.1.7.2 Merger & Acquisitions
      11. | | | 5.1.7.3 Joint Ventures
      12. | | 5.1.8 Major Players Financial Matrix
      13. | | | 5.1.8.1 Sales and Operating Income
      14. | | | 5.1.8.2 Major Players R&D Expenditure. 2023
      15. | 5.2 Company Profiles
      16. | | 5.2.1 AbbVie (US)
      17. | | | 5.2.1.1 Financial Overview
      18. | | | 5.2.1.2 Products Offered
      19. | | | 5.2.1.3 Key Developments
      20. | | | 5.2.1.4 SWOT Analysis
      21. | | | 5.2.1.5 Key Strategies
      22. | | 5.2.2 GSK (GB)
      23. | | | 5.2.2.1 Financial Overview
      24. | | | 5.2.2.2 Products Offered
      25. | | | 5.2.2.3 Key Developments
      26. | | | 5.2.2.4 SWOT Analysis
      27. | | | 5.2.2.5 Key Strategies
      28. | | 5.2.3 Pfizer (US)
      29. | | | 5.2.3.1 Financial Overview
      30. | | | 5.2.3.2 Products Offered
      31. | | | 5.2.3.3 Key Developments
      32. | | | 5.2.3.4 SWOT Analysis
      33. | | | 5.2.3.5 Key Strategies
      34. | | 5.2.4 Merck & Co. (US)
      35. | | | 5.2.4.1 Financial Overview
      36. | | | 5.2.4.2 Products Offered
      37. | | | 5.2.4.3 Key Developments
      38. | | | 5.2.4.4 SWOT Analysis
      39. | | | 5.2.4.5 Key Strategies
      40. | | 5.2.5 Bayer (DE)
      41. | | | 5.2.5.1 Financial Overview
      42. | | | 5.2.5.2 Products Offered
      43. | | | 5.2.5.3 Key Developments
      44. | | | 5.2.5.4 SWOT Analysis
      45. | | | 5.2.5.5 Key Strategies
      46. | | 5.2.6 Hoffmann-La Roche (CH)
      47. | | | 5.2.6.1 Financial Overview
      48. | | | 5.2.6.2 Products Offered
      49. | | | 5.2.6.3 Key Developments
      50. | | | 5.2.6.4 SWOT Analysis
      51. | | | 5.2.6.5 Key Strategies
      52. | | 5.2.7 AstraZeneca (GB)
      53. | | | 5.2.7.1 Financial Overview
      54. | | | 5.2.7.2 Products Offered
      55. | | | 5.2.7.3 Key Developments
      56. | | | 5.2.7.4 SWOT Analysis
      57. | | | 5.2.7.5 Key Strategies
      58. | | 5.2.8 Sanofi (FR)
      59. | | | 5.2.8.1 Financial Overview
      60. | | | 5.2.8.2 Products Offered
      61. | | | 5.2.8.3 Key Developments
      62. | | | 5.2.8.4 SWOT Analysis
      63. | | | 5.2.8.5 Key Strategies
      64. | | 5.2.9 Teva Pharmaceutical Industries (IL)
      65. | | | 5.2.9.1 Financial Overview
      66. | | | 5.2.9.2 Products Offered
      67. | | | 5.2.9.3 Key Developments
      68. | | | 5.2.9.4 SWOT Analysis
      69. | | | 5.2.9.5 Key Strategies
      70. | 5.3 Appendix
      71. | | 5.3.1 References
      72. | | 5.3.2 Related Reports
    6. LIST OF FIGURES
      1. | 6.1 MARKET SYNOPSIS
      2. | 6.2 NORTH AMERICA MARKET ANALYSIS
      3. | 6.3 US MARKET ANALYSIS BY CAUSATIVE ORGANISMS
      4. | 6.4 US MARKET ANALYSIS BY ROUTE OF ADMINISTRATION
      5. | 6.5 US MARKET ANALYSIS BY DISTRIBUTION CHANNEL
      6. | 6.6 CANADA MARKET ANALYSIS BY CAUSATIVE ORGANISMS
      7. | 6.7 CANADA MARKET ANALYSIS BY ROUTE OF ADMINISTRATION
      8. | 6.8 CANADA MARKET ANALYSIS BY DISTRIBUTION CHANNEL
      9. | 6.9 EUROPE MARKET ANALYSIS
      10. | 6.10 GERMANY MARKET ANALYSIS BY CAUSATIVE ORGANISMS
      11. | 6.11 GERMANY MARKET ANALYSIS BY ROUTE OF ADMINISTRATION
      12. | 6.12 GERMANY MARKET ANALYSIS BY DISTRIBUTION CHANNEL
      13. | 6.13 UK MARKET ANALYSIS BY CAUSATIVE ORGANISMS
      14. | 6.14 UK MARKET ANALYSIS BY ROUTE OF ADMINISTRATION
      15. | 6.15 UK MARKET ANALYSIS BY DISTRIBUTION CHANNEL
      16. | 6.16 FRANCE MARKET ANALYSIS BY CAUSATIVE ORGANISMS
      17. | 6.17 FRANCE MARKET ANALYSIS BY ROUTE OF ADMINISTRATION
      18. | 6.18 FRANCE MARKET ANALYSIS BY DISTRIBUTION CHANNEL
      19. | 6.19 RUSSIA MARKET ANALYSIS BY CAUSATIVE ORGANISMS
      20. | 6.20 RUSSIA MARKET ANALYSIS BY ROUTE OF ADMINISTRATION
      21. | 6.21 RUSSIA MARKET ANALYSIS BY DISTRIBUTION CHANNEL
      22. | 6.22 ITALY MARKET ANALYSIS BY CAUSATIVE ORGANISMS
      23. | 6.23 ITALY MARKET ANALYSIS BY ROUTE OF ADMINISTRATION
      24. | 6.24 ITALY MARKET ANALYSIS BY DISTRIBUTION CHANNEL
      25. | 6.25 SPAIN MARKET ANALYSIS BY CAUSATIVE ORGANISMS
      26. | 6.26 SPAIN MARKET ANALYSIS BY ROUTE OF ADMINISTRATION
      27. | 6.27 SPAIN MARKET ANALYSIS BY DISTRIBUTION CHANNEL
      28. | 6.28 REST OF EUROPE MARKET ANALYSIS BY CAUSATIVE ORGANISMS
      29. | 6.29 REST OF EUROPE MARKET ANALYSIS BY ROUTE OF ADMINISTRATION
      30. | 6.30 REST OF EUROPE MARKET ANALYSIS BY DISTRIBUTION CHANNEL
      31. | 6.31 APAC MARKET ANALYSIS
      32. | 6.32 CHINA MARKET ANALYSIS BY CAUSATIVE ORGANISMS
      33. | 6.33 CHINA MARKET ANALYSIS BY ROUTE OF ADMINISTRATION
      34. | 6.34 CHINA MARKET ANALYSIS BY DISTRIBUTION CHANNEL
      35. | 6.35 INDIA MARKET ANALYSIS BY CAUSATIVE ORGANISMS
      36. | 6.36 INDIA MARKET ANALYSIS BY ROUTE OF ADMINISTRATION
      37. | 6.37 INDIA MARKET ANALYSIS BY DISTRIBUTION CHANNEL
      38. | 6.38 JAPAN MARKET ANALYSIS BY CAUSATIVE ORGANISMS
      39. | 6.39 JAPAN MARKET ANALYSIS BY ROUTE OF ADMINISTRATION
      40. | 6.40 JAPAN MARKET ANALYSIS BY DISTRIBUTION CHANNEL
      41. | 6.41 SOUTH KOREA MARKET ANALYSIS BY CAUSATIVE ORGANISMS
      42. | 6.42 SOUTH KOREA MARKET ANALYSIS BY ROUTE OF ADMINISTRATION
      43. | 6.43 SOUTH KOREA MARKET ANALYSIS BY DISTRIBUTION CHANNEL
      44. | 6.44 MALAYSIA MARKET ANALYSIS BY CAUSATIVE ORGANISMS
      45. | 6.45 MALAYSIA MARKET ANALYSIS BY ROUTE OF ADMINISTRATION
      46. | 6.46 MALAYSIA MARKET ANALYSIS BY DISTRIBUTION CHANNEL
      47. | 6.47 THAILAND MARKET ANALYSIS BY CAUSATIVE ORGANISMS
      48. | 6.48 THAILAND MARKET ANALYSIS BY ROUTE OF ADMINISTRATION
      49. | 6.49 THAILAND MARKET ANALYSIS BY DISTRIBUTION CHANNEL
      50. | 6.50 INDONESIA MARKET ANALYSIS BY CAUSATIVE ORGANISMS
      51. | 6.51 INDONESIA MARKET ANALYSIS BY ROUTE OF ADMINISTRATION
      52. | 6.52 INDONESIA MARKET ANALYSIS BY DISTRIBUTION CHANNEL
      53. | 6.53 REST OF APAC MARKET ANALYSIS BY CAUSATIVE ORGANISMS
      54. | 6.54 REST OF APAC MARKET ANALYSIS BY ROUTE OF ADMINISTRATION
      55. | 6.55 REST OF APAC MARKET ANALYSIS BY DISTRIBUTION CHANNEL
      56. | 6.56 SOUTH AMERICA MARKET ANALYSIS
      57. | 6.57 BRAZIL MARKET ANALYSIS BY CAUSATIVE ORGANISMS
      58. | 6.58 BRAZIL MARKET ANALYSIS BY ROUTE OF ADMINISTRATION
      59. | 6.59 BRAZIL MARKET ANALYSIS BY DISTRIBUTION CHANNEL
      60. | 6.60 MEXICO MARKET ANALYSIS BY CAUSATIVE ORGANISMS
      61. | 6.61 MEXICO MARKET ANALYSIS BY ROUTE OF ADMINISTRATION
      62. | 6.62 MEXICO MARKET ANALYSIS BY DISTRIBUTION CHANNEL
      63. | 6.63 ARGENTINA MARKET ANALYSIS BY CAUSATIVE ORGANISMS
      64. | 6.64 ARGENTINA MARKET ANALYSIS BY ROUTE OF ADMINISTRATION
      65. | 6.65 ARGENTINA MARKET ANALYSIS BY DISTRIBUTION CHANNEL
      66. | 6.66 REST OF SOUTH AMERICA MARKET ANALYSIS BY CAUSATIVE ORGANISMS
      67. | 6.67 REST OF SOUTH AMERICA MARKET ANALYSIS BY ROUTE OF ADMINISTRATION
      68. | 6.68 REST OF SOUTH AMERICA MARKET ANALYSIS BY DISTRIBUTION CHANNEL
      69. | 6.69 MEA MARKET ANALYSIS
      70. | 6.70 GCC COUNTRIES MARKET ANALYSIS BY CAUSATIVE ORGANISMS
      71. | 6.71 GCC COUNTRIES MARKET ANALYSIS BY ROUTE OF ADMINISTRATION
      72. | 6.72 GCC COUNTRIES MARKET ANALYSIS BY DISTRIBUTION CHANNEL
      73. | 6.73 SOUTH AFRICA MARKET ANALYSIS BY CAUSATIVE ORGANISMS
      74. | 6.74 SOUTH AFRICA MARKET ANALYSIS BY ROUTE OF ADMINISTRATION
      75. | 6.75 SOUTH AFRICA MARKET ANALYSIS BY DISTRIBUTION CHANNEL
      76. | 6.76 REST OF MEA MARKET ANALYSIS BY CAUSATIVE ORGANISMS
      77. | 6.77 REST OF MEA MARKET ANALYSIS BY ROUTE OF ADMINISTRATION
      78. | 6.78 REST OF MEA MARKET ANALYSIS BY DISTRIBUTION CHANNEL
      79. | 6.79 KEY BUYING CRITERIA OF HEALTHCARE
      80. | 6.80 RESEARCH PROCESS OF MRFR
      81. | 6.81 DRO ANALYSIS OF HEALTHCARE
      82. | 6.82 DRIVERS IMPACT ANALYSIS: HEALTHCARE
      83. | 6.83 RESTRAINTS IMPACT ANALYSIS: HEALTHCARE
      84. | 6.84 SUPPLY / VALUE CHAIN: HEALTHCARE
      85. | 6.85 HEALTHCARE, BY CAUSATIVE ORGANISMS, 2024 (% SHARE)
      86. | 6.86 HEALTHCARE, BY CAUSATIVE ORGANISMS, 2024 TO 2035 (USD Billion)
      87. | 6.87 HEALTHCARE, BY ROUTE OF ADMINISTRATION, 2024 (% SHARE)
      88. | 6.88 HEALTHCARE, BY ROUTE OF ADMINISTRATION, 2024 TO 2035 (USD Billion)
      89. | 6.89 HEALTHCARE, BY DISTRIBUTION CHANNEL, 2024 (% SHARE)
      90. | 6.90 HEALTHCARE, BY DISTRIBUTION CHANNEL, 2024 TO 2035 (USD Billion)
      91. | 6.91 BENCHMARKING OF MAJOR COMPETITORS
    7. LIST OF TABLES
      1. | 7.1 LIST OF ASSUMPTIONS
      2. | | 7.1.1
      3. | 7.2 North America MARKET SIZE ESTIMATES; FORECAST
      4. | | 7.2.1 BY CAUSATIVE ORGANISMS, 2025-2035 (USD Billion)
      5. | | 7.2.2 BY ROUTE OF ADMINISTRATION, 2025-2035 (USD Billion)
      6. | | 7.2.3 BY DISTRIBUTION CHANNEL, 2025-2035 (USD Billion)
      7. | 7.3 US MARKET SIZE ESTIMATES; FORECAST
      8. | | 7.3.1 BY CAUSATIVE ORGANISMS, 2025-2035 (USD Billion)
      9. | | 7.3.2 BY ROUTE OF ADMINISTRATION, 2025-2035 (USD Billion)
      10. | | 7.3.3 BY DISTRIBUTION CHANNEL, 2025-2035 (USD Billion)
      11. | 7.4 Canada MARKET SIZE ESTIMATES; FORECAST
      12. | | 7.4.1 BY CAUSATIVE ORGANISMS, 2025-2035 (USD Billion)
      13. | | 7.4.2 BY ROUTE OF ADMINISTRATION, 2025-2035 (USD Billion)
      14. | | 7.4.3 BY DISTRIBUTION CHANNEL, 2025-2035 (USD Billion)
      15. | 7.5 Europe MARKET SIZE ESTIMATES; FORECAST
      16. | | 7.5.1 BY CAUSATIVE ORGANISMS, 2025-2035 (USD Billion)
      17. | | 7.5.2 BY ROUTE OF ADMINISTRATION, 2025-2035 (USD Billion)
      18. | | 7.5.3 BY DISTRIBUTION CHANNEL, 2025-2035 (USD Billion)
      19. | 7.6 Germany MARKET SIZE ESTIMATES; FORECAST
      20. | | 7.6.1 BY CAUSATIVE ORGANISMS, 2025-2035 (USD Billion)
      21. | | 7.6.2 BY ROUTE OF ADMINISTRATION, 2025-2035 (USD Billion)
      22. | | 7.6.3 BY DISTRIBUTION CHANNEL, 2025-2035 (USD Billion)
      23. | 7.7 UK MARKET SIZE ESTIMATES; FORECAST
      24. | | 7.7.1 BY CAUSATIVE ORGANISMS, 2025-2035 (USD Billion)
      25. | | 7.7.2 BY ROUTE OF ADMINISTRATION, 2025-2035 (USD Billion)
      26. | | 7.7.3 BY DISTRIBUTION CHANNEL, 2025-2035 (USD Billion)
      27. | 7.8 France MARKET SIZE ESTIMATES; FORECAST
      28. | | 7.8.1 BY CAUSATIVE ORGANISMS, 2025-2035 (USD Billion)
      29. | | 7.8.2 BY ROUTE OF ADMINISTRATION, 2025-2035 (USD Billion)
      30. | | 7.8.3 BY DISTRIBUTION CHANNEL, 2025-2035 (USD Billion)
      31. | 7.9 Russia MARKET SIZE ESTIMATES; FORECAST
      32. | | 7.9.1 BY CAUSATIVE ORGANISMS, 2025-2035 (USD Billion)
      33. | | 7.9.2 BY ROUTE OF ADMINISTRATION, 2025-2035 (USD Billion)
      34. | | 7.9.3 BY DISTRIBUTION CHANNEL, 2025-2035 (USD Billion)
      35. | 7.10 Italy MARKET SIZE ESTIMATES; FORECAST
      36. | | 7.10.1 BY CAUSATIVE ORGANISMS, 2025-2035 (USD Billion)
      37. | | 7.10.2 BY ROUTE OF ADMINISTRATION, 2025-2035 (USD Billion)
      38. | | 7.10.3 BY DISTRIBUTION CHANNEL, 2025-2035 (USD Billion)
      39. | 7.11 Spain MARKET SIZE ESTIMATES; FORECAST
      40. | | 7.11.1 BY CAUSATIVE ORGANISMS, 2025-2035 (USD Billion)
      41. | | 7.11.2 BY ROUTE OF ADMINISTRATION, 2025-2035 (USD Billion)
      42. | | 7.11.3 BY DISTRIBUTION CHANNEL, 2025-2035 (USD Billion)
      43. | 7.12 Rest of Europe MARKET SIZE ESTIMATES; FORECAST
      44. | | 7.12.1 BY CAUSATIVE ORGANISMS, 2025-2035 (USD Billion)
      45. | | 7.12.2 BY ROUTE OF ADMINISTRATION, 2025-2035 (USD Billion)
      46. | | 7.12.3 BY DISTRIBUTION CHANNEL, 2025-2035 (USD Billion)
      47. | 7.13 APAC MARKET SIZE ESTIMATES; FORECAST
      48. | | 7.13.1 BY CAUSATIVE ORGANISMS, 2025-2035 (USD Billion)
      49. | | 7.13.2 BY ROUTE OF ADMINISTRATION, 2025-2035 (USD Billion)
      50. | | 7.13.3 BY DISTRIBUTION CHANNEL, 2025-2035 (USD Billion)
      51. | 7.14 China MARKET SIZE ESTIMATES; FORECAST
      52. | | 7.14.1 BY CAUSATIVE ORGANISMS, 2025-2035 (USD Billion)
      53. | | 7.14.2 BY ROUTE OF ADMINISTRATION, 2025-2035 (USD Billion)
      54. | | 7.14.3 BY DISTRIBUTION CHANNEL, 2025-2035 (USD Billion)
      55. | 7.15 India MARKET SIZE ESTIMATES; FORECAST
      56. | | 7.15.1 BY CAUSATIVE ORGANISMS, 2025-2035 (USD Billion)
      57. | | 7.15.2 BY ROUTE OF ADMINISTRATION, 2025-2035 (USD Billion)
      58. | | 7.15.3 BY DISTRIBUTION CHANNEL, 2025-2035 (USD Billion)
      59. | 7.16 Japan MARKET SIZE ESTIMATES; FORECAST
      60. | | 7.16.1 BY CAUSATIVE ORGANISMS, 2025-2035 (USD Billion)
      61. | | 7.16.2 BY ROUTE OF ADMINISTRATION, 2025-2035 (USD Billion)
      62. | | 7.16.3 BY DISTRIBUTION CHANNEL, 2025-2035 (USD Billion)
      63. | 7.17 South Korea MARKET SIZE ESTIMATES; FORECAST
      64. | | 7.17.1 BY CAUSATIVE ORGANISMS, 2025-2035 (USD Billion)
      65. | | 7.17.2 BY ROUTE OF ADMINISTRATION, 2025-2035 (USD Billion)
      66. | | 7.17.3 BY DISTRIBUTION CHANNEL, 2025-2035 (USD Billion)
      67. | 7.18 Malaysia MARKET SIZE ESTIMATES; FORECAST
      68. | | 7.18.1 BY CAUSATIVE ORGANISMS, 2025-2035 (USD Billion)
      69. | | 7.18.2 BY ROUTE OF ADMINISTRATION, 2025-2035 (USD Billion)
      70. | | 7.18.3 BY DISTRIBUTION CHANNEL, 2025-2035 (USD Billion)
      71. | 7.19 Thailand MARKET SIZE ESTIMATES; FORECAST
      72. | | 7.19.1 BY CAUSATIVE ORGANISMS, 2025-2035 (USD Billion)
      73. | | 7.19.2 BY ROUTE OF ADMINISTRATION, 2025-2035 (USD Billion)
      74. | | 7.19.3 BY DISTRIBUTION CHANNEL, 2025-2035 (USD Billion)
      75. | 7.20 Indonesia MARKET SIZE ESTIMATES; FORECAST
      76. | | 7.20.1 BY CAUSATIVE ORGANISMS, 2025-2035 (USD Billion)
      77. | | 7.20.2 BY ROUTE OF ADMINISTRATION, 2025-2035 (USD Billion)
      78. | | 7.20.3 BY DISTRIBUTION CHANNEL, 2025-2035 (USD Billion)
      79. | 7.21 Rest of APAC MARKET SIZE ESTIMATES; FORECAST
      80. | | 7.21.1 BY CAUSATIVE ORGANISMS, 2025-2035 (USD Billion)
      81. | | 7.21.2 BY ROUTE OF ADMINISTRATION, 2025-2035 (USD Billion)
      82. | | 7.21.3 BY DISTRIBUTION CHANNEL, 2025-2035 (USD Billion)
      83. | 7.22 South America MARKET SIZE ESTIMATES; FORECAST
      84. | | 7.22.1 BY CAUSATIVE ORGANISMS, 2025-2035 (USD Billion)
      85. | | 7.22.2 BY ROUTE OF ADMINISTRATION, 2025-2035 (USD Billion)
      86. | | 7.22.3 BY DISTRIBUTION CHANNEL, 2025-2035 (USD Billion)
      87. | 7.23 Brazil MARKET SIZE ESTIMATES; FORECAST
      88. | | 7.23.1 BY CAUSATIVE ORGANISMS, 2025-2035 (USD Billion)
      89. | | 7.23.2 BY ROUTE OF ADMINISTRATION, 2025-2035 (USD Billion)
      90. | | 7.23.3 BY DISTRIBUTION CHANNEL, 2025-2035 (USD Billion)
      91. | 7.24 Mexico MARKET SIZE ESTIMATES; FORECAST
      92. | | 7.24.1 BY CAUSATIVE ORGANISMS, 2025-2035 (USD Billion)
      93. | | 7.24.2 BY ROUTE OF ADMINISTRATION, 2025-2035 (USD Billion)
      94. | | 7.24.3 BY DISTRIBUTION CHANNEL, 2025-2035 (USD Billion)
      95. | 7.25 Argentina MARKET SIZE ESTIMATES; FORECAST
      96. | | 7.25.1 BY CAUSATIVE ORGANISMS, 2025-2035 (USD Billion)
      97. | | 7.25.2 BY ROUTE OF ADMINISTRATION, 2025-2035 (USD Billion)
      98. | | 7.25.3 BY DISTRIBUTION CHANNEL, 2025-2035 (USD Billion)
      99. | 7.26 Rest of South America MARKET SIZE ESTIMATES; FORECAST
      100. | | 7.26.1 BY CAUSATIVE ORGANISMS, 2025-2035 (USD Billion)
      101. | | 7.26.2 BY ROUTE OF ADMINISTRATION, 2025-2035 (USD Billion)
      102. | | 7.26.3 BY DISTRIBUTION CHANNEL, 2025-2035 (USD Billion)
      103. | 7.27 MEA MARKET SIZE ESTIMATES; FORECAST
      104. | | 7.27.1 BY CAUSATIVE ORGANISMS, 2025-2035 (USD Billion)
      105. | | 7.27.2 BY ROUTE OF ADMINISTRATION, 2025-2035 (USD Billion)
      106. | | 7.27.3 BY DISTRIBUTION CHANNEL, 2025-2035 (USD Billion)
      107. | 7.28 GCC Countries MARKET SIZE ESTIMATES; FORECAST
      108. | | 7.28.1 BY CAUSATIVE ORGANISMS, 2025-2035 (USD Billion)
      109. | | 7.28.2 BY ROUTE OF ADMINISTRATION, 2025-2035 (USD Billion)
      110. | | 7.28.3 BY DISTRIBUTION CHANNEL, 2025-2035 (USD Billion)
      111. | 7.29 South Africa MARKET SIZE ESTIMATES; FORECAST
      112. | | 7.29.1 BY CAUSATIVE ORGANISMS, 2025-2035 (USD Billion)
      113. | | 7.29.2 BY ROUTE OF ADMINISTRATION, 2025-2035 (USD Billion)
      114. | | 7.29.3 BY DISTRIBUTION CHANNEL, 2025-2035 (USD Billion)
      115. | 7.30 Rest of MEA MARKET SIZE ESTIMATES; FORECAST
      116. | | 7.30.1 BY CAUSATIVE ORGANISMS, 2025-2035 (USD Billion)
      117. | | 7.30.2 BY ROUTE OF ADMINISTRATION, 2025-2035 (USD Billion)
      118. | | 7.30.3 BY DISTRIBUTION CHANNEL, 2025-2035 (USD Billion)
      119. | 7.31 PRODUCT LAUNCH/PRODUCT DEVELOPMENT/APPROVAL
      120. | | 7.31.1
      121. | 7.32 ACQUISITION/PARTNERSHIP
      122. | | 7.32.1

    Chlamydia Infection Treatment Market Segmentation

    Market Segmentation Overview

    • Detailed segmentation data will be available in the full report
    • Comprehensive analysis by multiple parameters
    • Regional and country-level breakdowns
    • Market size forecasts by segment
    Infographic

    Free Sample Request

    Kindly complete the form below to receive a free sample of this Report

    Get Free Sample

    Customer Strories

    “I am very pleased with how market segments have been defined in a relevant way for my purposes (such as "Portable Freezers & refrigerators" and "last-mile"). In general the report is well structured. Thanks very much for your efforts.”

    Victoria Milne

    Founder
    Case Study
    Chemicals and Materials

    Compare Licence

    ×
    Features License Type
    Single User Multiuser License Enterprise User
    Price $4,950 $5,950 $7,250
    Maximum User Access Limit 1 User Upto 10 Users Unrestricted Access Throughout the Organization
    Free Customization
    Direct Access to Analyst
    Deliverable Format
    Platform Access
    Discount on Next Purchase 10% 15% 15%
    Printable Versions