• Cat-intel
  • MedIntelliX
  • Resources
  • About Us
  • Hero Background
    English
    Chinese
    French
    Japanese
    Korean
    German
    Spanish

    Cardiomyopathy Medication Market Size

    ID: MRFR/HC/6784-HCR
    111 Pages
    Rahul Gotadki
    October 2025

    Cardiomyopathy Medication Market Research Report Information By Type (Dilated Cardiomyopathy, Hypertrophic Cardiomyopathy, Restrictive Cardiomyopathy, Unclassified Cardiomyopathy), By Treatment (Anticoagulants, Antiarrhythmics, Anti-Hypertensives, Cardiac Glycosides, Diuretics) and By End User (Homecare, Hospitals and Clinics, Others) – Forecast to 2035

    Share:
    Download PDF ×

    We do not share your information with anyone. However, we may send you emails based on your report interest from time to time. You may contact us at any time to opt-out.

    Cardiomyopathy Medication Market Infographic
    Purchase Options

    Cardiomyopathy Medication Size

    Cardiomyopathy Medication Market Growth Projections and Opportunities

    The market for cardiomyopathy medication is fundamentally affected by the prevalence of the infection. As cardiomyopathy keeps on influencing a developing number of people internationally, the interest for powerful medications is on the ascent. With a maturing worldwide population, the frequency of cardiomyopathy will in general increment, as the risk of creating heart-related conditions rises with age. This segment shift is a key market factor, driving the requirement for cutting edge medications taking special care of the older population. The accessibility and accessibility of healthcare framework assume an urgent part in the cardiomyopathy medication market. Districts with deep rooted healthcare frameworks are bound to observe more popularity for these medications because of better determination and treatment abilities. Public awareness and training drives in regards to cardiomyopathy assume an urgent part in market growth. Expanded awareness prompts early analysis and treatment, driving the interest for cardiomyopathy medications. The degree of protection inclusion for cardiomyopathy medications impacts patient access and rationality. Markets with thorough protection inclusion are probably going to encounter more appeal for these medications, adding to market development. The globalization of drug markets works with the dispersion and accessibility of cardiomyopathy medications around the world. This pattern empowers drug organizations to arrive at a more extensive patient base and grow their market presence. Creating economies address a huge growth opportunity for the cardiomyopathy medication market. As these markets observer enhancements in healthcare foundation and expanded awareness, the interest for medications rises.

    Cardiomyopathy Medication Market Size Graph
    Author
    Rahul Gotadki
    Assistant Manager

    He holds an experience of about 7+ years in Market Research and Business Consulting, working under the spectrum of Life Sciences and Healthcare domains. Rahul conceptualizes and implements a scalable business strategy and provides strategic leadership to the clients. His expertise lies in market estimation, competitive intelligence, pipeline analysis, customer assessment, etc. In addition to the above, his other responsibility includes strategic tracking of high growth markets & advising clients on the potential areas of focus they could direct their business initiatives

    Leave a Comment

    FAQs

    At what CAGR is the global cardiomyopathy medication market projected to grow during the forecast period?

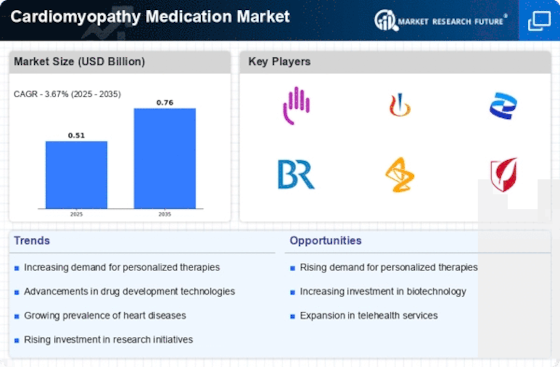
    The cardiomyopathy medication market is projected to grow at a 3.67% CAGR between 2024-2032.

    Which region is predicted to command the highest share in the cardiomyopathy medication market?

    The Americas are predicted to command the highest share in the cardiomyopathy medication market.

    What will be the value of the cardiomyopathy medication market during the forecast period?

    The cardiomyopathy medication market is predicted to touch USD 0.64 billion by 2032.

    What are the key factors driving the cardiomyopathy medication market growth?

    Increasing prevalence of hypertension and recent product launches are boosting market growth.

    Which factors may restrict the cardiomyopathy medication market growth?

    Availability of alternatives and high cost may restrict market growth.

    Market Summary

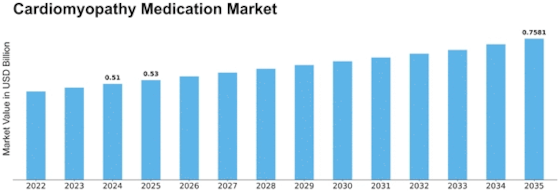
    The Global Cardiomyopathy Medication Market is projected to grow from 0.51 USD Billion in 2024 to 0.71 USD Billion by 2035.

    Key Market Trends & Highlights

    Cardiomyopathy Medication Key Trends and Highlights

    • The market is expected to experience a compound annual growth rate (CAGR) of 3.09% from 2025 to 2035.
    • By 2035, the market valuation is anticipated to reach 0.71 USD Billion, indicating a steady growth trajectory.
    • In 2024, the market is valued at 0.51 USD Billion, reflecting the current demand for cardiomyopathy treatments.
    • Growing adoption of innovative therapies due to increasing prevalence of cardiomyopathy is a major market driver.

    Market Size & Forecast

    2024 Market Size 0.51 (USD Billion)
    2035 Market Size 0.71 (USD Billion)
    CAGR (2025-2035) 3.09%
    Largest Regional Market Share in 2024 latin_america)

    Major Players

    Pfizer Inc., PhaseBio Pharmaceuticals, Inc., Array Biopharma, Inc., AstraZeneca, Sanofi-Aventis US LLC, Hoffmann-La Roche Ltd, Merck & Co., Inc., Capricor Therapeutics, MyoKardia, Janssen Products, LPI, Ionis Pharmaceuticals, Inc., Medtronic, Becton And Dickson & Co., Biomerieux, Teva Pharmaceutical Industries Ltd

    Market Trends

    Increase in number of cardiomyopathy cases and need for lifelong medication to manage the condition.

    The ongoing evolution of treatment modalities for cardiomyopathy suggests a growing emphasis on personalized medicine, which may enhance patient outcomes and redefine therapeutic strategies.

    National Institutes of Health (NIH)

    Cardiomyopathy Medication Market Market Drivers

    Rising Prevalence of Cardiomyopathy

    The increasing incidence of cardiomyopathy globally drives the Global Cardiomyopathy Medication Market Industry. As awareness of heart diseases rises, more individuals are diagnosed with various forms of cardiomyopathy, including dilated, hypertrophic, and restrictive types. For instance, studies indicate that the prevalence of cardiomyopathy is approximately 1 in 500 individuals, suggesting a substantial patient population requiring treatment. This growing patient base is projected to contribute to the market's expansion, with the industry expected to reach 0.51 USD Billion in 2024 and 0.71 USD Billion by 2035, reflecting a compound annual growth rate of 3.09% from 2025 to 2035.

    Market Segment Insights

    Cardiomyopathy Medication Market Segment Insights

    Cardiomyopathy Medication Type Insights

    Cardiomyopathy Medication Treatment Insights

    Cardiomyopathy Medication End User Insights

    Get more detailed insights about Cardiomyopathy Medication Market Research Report - Global Forecast till 2035

    Regional Insights

    Key Companies in the Cardiomyopathy Medication Market market include

    Industry Developments

    Future Outlook

    Cardiomyopathy Medication Market Future Outlook

    The Global Cardiomyopathy Medication Market is projected to grow at a 3.09% CAGR from 2024 to 2035, driven by advancements in drug development, increasing prevalence of cardiomyopathy, and enhanced healthcare access.

    New opportunities lie in:

    • Invest in personalized medicine approaches to tailor treatments for specific cardiomyopathy types.
    • Leverage telemedicine platforms to improve patient monitoring and adherence to medication.
    • Explore partnerships with biotech firms for innovative drug delivery systems.

    By 2035, the market is expected to demonstrate robust growth, reflecting advancements in treatment options and increased patient awareness.

    Market Segmentation

    Report Scope

    Report Attribute/Metric Details
      Market Size 2023   USD 0.5 Billion
      Market Size 2024   USD 0.51 Billion
      Market Size 2032   USD 0.64 Billion
      CAGR   3.67%
      Base Year   2023
      Forecast Period   2024-2032
      Historical Data   2022
      Forecast Units   Value (USD Billion)
      Report Coverage   Revenue Forecast, Competitive Landscape, Growth Factors, and Trends
      Segments Covered   By Type, By Treatmen and By End User
      Geographies Covered   North America, Europe, Asia-Pacific, and Rest of the World (RoW)
      Key Vendors   Pfizer Inc., PhaseBio Pharmaceuticals, Inc., Array Biopharma, Inc., AstraZeneca, Sanofi-Aventis US LLC, Hoffmann-La Roche Ltd, Merck & Co., Inc., Capricor Therapeutics, MyoKardia Janssen Products, LP, Ionis Pharmaceuticals, Inc.,Medtronic Becton And Dickson & Co., Biomerieux, Teva Pharmaceutical Industries Ltd
      Key Market Opportunities   Increase in number of cardiomyopathy cases and need for lifelong medication to manage the condition
      Key Market Drivers · Increased prevalence of hypertension, congenital heart abnormalities, and valve disease. ·  Rising incidence rate among the growing geriatric population . ·  Changes in lifestyle. ·  Lifelong medication required to manage the condition

    FAQs

    At what CAGR is the global cardiomyopathy medication market projected to grow during the forecast period?

    The cardiomyopathy medication market is projected to grow at a 3.67% CAGR between 2024-2032.

    Which region is predicted to command the highest share in the cardiomyopathy medication market?

    The Americas are predicted to command the highest share in the cardiomyopathy medication market.

    What will be the value of the cardiomyopathy medication market during the forecast period?

    The cardiomyopathy medication market is predicted to touch USD 0.64 billion by 2032.

    What are the key factors driving the cardiomyopathy medication market growth?

    Increasing prevalence of hypertension and recent product launches are boosting market growth.

    Which factors may restrict the cardiomyopathy medication market growth?

    Availability of alternatives and high cost may restrict market growth.

    1. SECTION I: EXECUTIVE SUMMARY AND KEY HIGHLIGHTS
      1. | 1.1 EXECUTIVE SUMMARY
      2. | | 1.1.1 Market Overview
      3. | | 1.1.2 Key Findings
      4. | | 1.1.3 Market Segmentation
      5. | | 1.1.4 Competitive Landscape
      6. | | 1.1.5 Challenges and Opportunities
      7. | | 1.1.6 Future Outlook
    2. SECTION II: SCOPING, METHODOLOGY AND MARKET STRUCTURE
      1. | 2.1 MARKET INTRODUCTION
      2. | | 2.1.1 Definition
      3. | | 2.1.2 Scope of the study
      4. | | | 2.1.2.1 Research Objective
      5. | | | 2.1.2.2 Assumption
      6. | | | 2.1.2.3 Limitations
      7. | 2.2 RESEARCH METHODOLOGY
      8. | | 2.2.1 Overview
      9. | | 2.2.2 Data Mining
      10. | | 2.2.3 Secondary Research
      11. | | 2.2.4 Primary Research
      12. | | | 2.2.4.1 Primary Interviews and Information Gathering Process
      13. | | | 2.2.4.2 Breakdown of Primary Respondents
      14. | | 2.2.5 Forecasting Model
      15. | | 2.2.6 Market Size Estimation
      16. | | | 2.2.6.1 Bottom-Up Approach
      17. | | | 2.2.6.2 Top-Down Approach
      18. | | 2.2.7 Data Triangulation
      19. | | 2.2.8 Validation
    3. SECTION III: QUALITATIVE ANALYSIS
      1. | 3.1 MARKET DYNAMICS
      2. | | 3.1.1 Overview
      3. | | 3.1.2 Drivers
      4. | | 3.1.3 Restraints
      5. | | 3.1.4 Opportunities
      6. | 3.2 MARKET FACTOR ANALYSIS
      7. | | 3.2.1 Value chain Analysis
      8. | | 3.2.2 Porter's Five Forces Analysis
      9. | | | 3.2.2.1 Bargaining Power of Suppliers
      10. | | | 3.2.2.2 Bargaining Power of Buyers
      11. | | | 3.2.2.3 Threat of New Entrants
      12. | | | 3.2.2.4 Threat of Substitutes
      13. | | | 3.2.2.5 Intensity of Rivalry
      14. | | 3.2.3 COVID-19 Impact Analysis
      15. | | | 3.2.3.1 Market Impact Analysis
      16. | | | 3.2.3.2 Regional Impact
      17. | | | 3.2.3.3 Opportunity and Threat Analysis
    4. SECTION IV: QUANTITATIVE ANALYSIS
      1. | 4.1 Healthcare, BY Type (USD Billion)
      2. | | 4.1.1 Dilated Cardiomyopathy
      3. | | 4.1.2 Hypertrophic Cardiomyopathy
      4. | | 4.1.3 Restrictive Cardiomyopathy
      5. | | 4.1.4 Arrhythmogenic Right Ventricular Dysplasia
      6. | | 4.1.5 Unclassified Cardiomyopathy
      7. | 4.2 Healthcare, BY Treatment (USD Billion)
      8. | | 4.2.1 Anticoagulants
      9. | | 4.2.2 Antiarrhythmics
      10. | | 4.2.3 Anti-Hypertensives
      11. | | 4.2.4 Cardiac Glycosides
      12. | | 4.2.5 Diuretics
      13. | 4.3 Healthcare, BY End User (USD Billion)
      14. | | 4.3.1 Homecare
      15. | | 4.3.2 Hospitals and Clinics
      16. | | 4.3.3 Others
      17. | 4.4 Healthcare, BY Region (USD Billion)
      18. | | 4.4.1 North America
      19. | | | 4.4.1.1 US
      20. | | | 4.4.1.2 Canada
      21. | | 4.4.2 Europe
      22. | | | 4.4.2.1 Germany
      23. | | | 4.4.2.2 UK
      24. | | | 4.4.2.3 France
      25. | | | 4.4.2.4 Russia
      26. | | | 4.4.2.5 Italy
      27. | | | 4.4.2.6 Spain
      28. | | | 4.4.2.7 Rest of Europe
      29. | | 4.4.3 APAC
      30. | | | 4.4.3.1 China
      31. | | | 4.4.3.2 India
      32. | | | 4.4.3.3 Japan
      33. | | | 4.4.3.4 South Korea
      34. | | | 4.4.3.5 Malaysia
      35. | | | 4.4.3.6 Thailand
      36. | | | 4.4.3.7 Indonesia
      37. | | | 4.4.3.8 Rest of APAC
      38. | | 4.4.4 South America
      39. | | | 4.4.4.1 Brazil
      40. | | | 4.4.4.2 Mexico
      41. | | | 4.4.4.3 Argentina
      42. | | | 4.4.4.4 Rest of South America
      43. | | 4.4.5 MEA
      44. | | | 4.4.5.1 GCC Countries
      45. | | | 4.4.5.2 South Africa
      46. | | | 4.4.5.3 Rest of MEA
    5. SECTION V: COMPETITIVE ANALYSIS
      1. | 5.1 Competitive Landscape
      2. | | 5.1.1 Overview
      3. | | 5.1.2 Competitive Analysis
      4. | | 5.1.3 Market share Analysis
      5. | | 5.1.4 Major Growth Strategy in the Healthcare
      6. | | 5.1.5 Competitive Benchmarking
      7. | | 5.1.6 Leading Players in Terms of Number of Developments in the Healthcare
      8. | | 5.1.7 Key developments and growth strategies
      9. | | | 5.1.7.1 New Product Launch/Service Deployment
      10. | | | 5.1.7.2 Merger & Acquisitions
      11. | | | 5.1.7.3 Joint Ventures
      12. | | 5.1.8 Major Players Financial Matrix
      13. | | | 5.1.8.1 Sales and Operating Income
      14. | | | 5.1.8.2 Major Players R&D Expenditure. 2023
      15. | 5.2 Company Profiles
      16. | | 5.2.1 Bristol-Myers Squibb (US)
      17. | | | 5.2.1.1 Financial Overview
      18. | | | 5.2.1.2 Products Offered
      19. | | | 5.2.1.3 Key Developments
      20. | | | 5.2.1.4 SWOT Analysis
      21. | | | 5.2.1.5 Key Strategies
      22. | | 5.2.2 Novartis (CH)
      23. | | | 5.2.2.1 Financial Overview
      24. | | | 5.2.2.2 Products Offered
      25. | | | 5.2.2.3 Key Developments
      26. | | | 5.2.2.4 SWOT Analysis
      27. | | | 5.2.2.5 Key Strategies
      28. | | 5.2.3 Pfizer (US)
      29. | | | 5.2.3.1 Financial Overview
      30. | | | 5.2.3.2 Products Offered
      31. | | | 5.2.3.3 Key Developments
      32. | | | 5.2.3.4 SWOT Analysis
      33. | | | 5.2.3.5 Key Strategies
      34. | | 5.2.4 Bayer (DE)
      35. | | | 5.2.4.1 Financial Overview
      36. | | | 5.2.4.2 Products Offered
      37. | | | 5.2.4.3 Key Developments
      38. | | | 5.2.4.4 SWOT Analysis
      39. | | | 5.2.4.5 Key Strategies
      40. | | 5.2.5 AstraZeneca (GB)
      41. | | | 5.2.5.1 Financial Overview
      42. | | | 5.2.5.2 Products Offered
      43. | | | 5.2.5.3 Key Developments
      44. | | | 5.2.5.4 SWOT Analysis
      45. | | | 5.2.5.5 Key Strategies
      46. | | 5.2.6 Gilead Sciences (US)
      47. | | | 5.2.6.1 Financial Overview
      48. | | | 5.2.6.2 Products Offered
      49. | | | 5.2.6.3 Key Developments
      50. | | | 5.2.6.4 SWOT Analysis
      51. | | | 5.2.6.5 Key Strategies
      52. | | 5.2.7 Sanofi (FR)
      53. | | | 5.2.7.1 Financial Overview
      54. | | | 5.2.7.2 Products Offered
      55. | | | 5.2.7.3 Key Developments
      56. | | | 5.2.7.4 SWOT Analysis
      57. | | | 5.2.7.5 Key Strategies
      58. | | 5.2.8 Merck & Co. (US)
      59. | | | 5.2.8.1 Financial Overview
      60. | | | 5.2.8.2 Products Offered
      61. | | | 5.2.8.3 Key Developments
      62. | | | 5.2.8.4 SWOT Analysis
      63. | | | 5.2.8.5 Key Strategies
      64. | | 5.2.9 Amgen (US)
      65. | | | 5.2.9.1 Financial Overview
      66. | | | 5.2.9.2 Products Offered
      67. | | | 5.2.9.3 Key Developments
      68. | | | 5.2.9.4 SWOT Analysis
      69. | | | 5.2.9.5 Key Strategies
      70. | 5.3 Appendix
      71. | | 5.3.1 References
      72. | | 5.3.2 Related Reports
    6. LIST OF FIGURES
      1. | 6.1 MARKET SYNOPSIS
      2. | 6.2 NORTH AMERICA MARKET ANALYSIS
      3. | 6.3 US MARKET ANALYSIS BY TYPE
      4. | 6.4 US MARKET ANALYSIS BY TREATMENT
      5. | 6.5 US MARKET ANALYSIS BY END USER
      6. | 6.6 CANADA MARKET ANALYSIS BY TYPE
      7. | 6.7 CANADA MARKET ANALYSIS BY TREATMENT
      8. | 6.8 CANADA MARKET ANALYSIS BY END USER
      9. | 6.9 EUROPE MARKET ANALYSIS
      10. | 6.10 GERMANY MARKET ANALYSIS BY TYPE
      11. | 6.11 GERMANY MARKET ANALYSIS BY TREATMENT
      12. | 6.12 GERMANY MARKET ANALYSIS BY END USER
      13. | 6.13 UK MARKET ANALYSIS BY TYPE
      14. | 6.14 UK MARKET ANALYSIS BY TREATMENT
      15. | 6.15 UK MARKET ANALYSIS BY END USER
      16. | 6.16 FRANCE MARKET ANALYSIS BY TYPE
      17. | 6.17 FRANCE MARKET ANALYSIS BY TREATMENT
      18. | 6.18 FRANCE MARKET ANALYSIS BY END USER
      19. | 6.19 RUSSIA MARKET ANALYSIS BY TYPE
      20. | 6.20 RUSSIA MARKET ANALYSIS BY TREATMENT
      21. | 6.21 RUSSIA MARKET ANALYSIS BY END USER
      22. | 6.22 ITALY MARKET ANALYSIS BY TYPE
      23. | 6.23 ITALY MARKET ANALYSIS BY TREATMENT
      24. | 6.24 ITALY MARKET ANALYSIS BY END USER
      25. | 6.25 SPAIN MARKET ANALYSIS BY TYPE
      26. | 6.26 SPAIN MARKET ANALYSIS BY TREATMENT
      27. | 6.27 SPAIN MARKET ANALYSIS BY END USER
      28. | 6.28 REST OF EUROPE MARKET ANALYSIS BY TYPE
      29. | 6.29 REST OF EUROPE MARKET ANALYSIS BY TREATMENT
      30. | 6.30 REST OF EUROPE MARKET ANALYSIS BY END USER
      31. | 6.31 APAC MARKET ANALYSIS
      32. | 6.32 CHINA MARKET ANALYSIS BY TYPE
      33. | 6.33 CHINA MARKET ANALYSIS BY TREATMENT
      34. | 6.34 CHINA MARKET ANALYSIS BY END USER
      35. | 6.35 INDIA MARKET ANALYSIS BY TYPE
      36. | 6.36 INDIA MARKET ANALYSIS BY TREATMENT
      37. | 6.37 INDIA MARKET ANALYSIS BY END USER
      38. | 6.38 JAPAN MARKET ANALYSIS BY TYPE
      39. | 6.39 JAPAN MARKET ANALYSIS BY TREATMENT
      40. | 6.40 JAPAN MARKET ANALYSIS BY END USER
      41. | 6.41 SOUTH KOREA MARKET ANALYSIS BY TYPE
      42. | 6.42 SOUTH KOREA MARKET ANALYSIS BY TREATMENT
      43. | 6.43 SOUTH KOREA MARKET ANALYSIS BY END USER
      44. | 6.44 MALAYSIA MARKET ANALYSIS BY TYPE
      45. | 6.45 MALAYSIA MARKET ANALYSIS BY TREATMENT
      46. | 6.46 MALAYSIA MARKET ANALYSIS BY END USER
      47. | 6.47 THAILAND MARKET ANALYSIS BY TYPE
      48. | 6.48 THAILAND MARKET ANALYSIS BY TREATMENT
      49. | 6.49 THAILAND MARKET ANALYSIS BY END USER
      50. | 6.50 INDONESIA MARKET ANALYSIS BY TYPE
      51. | 6.51 INDONESIA MARKET ANALYSIS BY TREATMENT
      52. | 6.52 INDONESIA MARKET ANALYSIS BY END USER
      53. | 6.53 REST OF APAC MARKET ANALYSIS BY TYPE
      54. | 6.54 REST OF APAC MARKET ANALYSIS BY TREATMENT
      55. | 6.55 REST OF APAC MARKET ANALYSIS BY END USER
      56. | 6.56 SOUTH AMERICA MARKET ANALYSIS
      57. | 6.57 BRAZIL MARKET ANALYSIS BY TYPE
      58. | 6.58 BRAZIL MARKET ANALYSIS BY TREATMENT
      59. | 6.59 BRAZIL MARKET ANALYSIS BY END USER
      60. | 6.60 MEXICO MARKET ANALYSIS BY TYPE
      61. | 6.61 MEXICO MARKET ANALYSIS BY TREATMENT
      62. | 6.62 MEXICO MARKET ANALYSIS BY END USER
      63. | 6.63 ARGENTINA MARKET ANALYSIS BY TYPE
      64. | 6.64 ARGENTINA MARKET ANALYSIS BY TREATMENT
      65. | 6.65 ARGENTINA MARKET ANALYSIS BY END USER
      66. | 6.66 REST OF SOUTH AMERICA MARKET ANALYSIS BY TYPE
      67. | 6.67 REST OF SOUTH AMERICA MARKET ANALYSIS BY TREATMENT
      68. | 6.68 REST OF SOUTH AMERICA MARKET ANALYSIS BY END USER
      69. | 6.69 MEA MARKET ANALYSIS
      70. | 6.70 GCC COUNTRIES MARKET ANALYSIS BY TYPE
      71. | 6.71 GCC COUNTRIES MARKET ANALYSIS BY TREATMENT
      72. | 6.72 GCC COUNTRIES MARKET ANALYSIS BY END USER
      73. | 6.73 SOUTH AFRICA MARKET ANALYSIS BY TYPE
      74. | 6.74 SOUTH AFRICA MARKET ANALYSIS BY TREATMENT
      75. | 6.75 SOUTH AFRICA MARKET ANALYSIS BY END USER
      76. | 6.76 REST OF MEA MARKET ANALYSIS BY TYPE
      77. | 6.77 REST OF MEA MARKET ANALYSIS BY TREATMENT
      78. | 6.78 REST OF MEA MARKET ANALYSIS BY END USER
      79. | 6.79 KEY BUYING CRITERIA OF HEALTHCARE
      80. | 6.80 RESEARCH PROCESS OF MRFR
      81. | 6.81 DRO ANALYSIS OF HEALTHCARE
      82. | 6.82 DRIVERS IMPACT ANALYSIS: HEALTHCARE
      83. | 6.83 RESTRAINTS IMPACT ANALYSIS: HEALTHCARE
      84. | 6.84 SUPPLY / VALUE CHAIN: HEALTHCARE
      85. | 6.85 HEALTHCARE, BY TYPE, 2024 (% SHARE)
      86. | 6.86 HEALTHCARE, BY TYPE, 2024 TO 2035 (USD Billion)
      87. | 6.87 HEALTHCARE, BY TREATMENT, 2024 (% SHARE)
      88. | 6.88 HEALTHCARE, BY TREATMENT, 2024 TO 2035 (USD Billion)
      89. | 6.89 HEALTHCARE, BY END USER, 2024 (% SHARE)
      90. | 6.90 HEALTHCARE, BY END USER, 2024 TO 2035 (USD Billion)
      91. | 6.91 BENCHMARKING OF MAJOR COMPETITORS
    7. LIST OF TABLES
      1. | 7.1 LIST OF ASSUMPTIONS
      2. | | 7.1.1
      3. | 7.2 North America MARKET SIZE ESTIMATES; FORECAST
      4. | | 7.2.1 BY TYPE, 2025-2035 (USD Billion)
      5. | | 7.2.2 BY TREATMENT, 2025-2035 (USD Billion)
      6. | | 7.2.3 BY END USER, 2025-2035 (USD Billion)
      7. | 7.3 US MARKET SIZE ESTIMATES; FORECAST
      8. | | 7.3.1 BY TYPE, 2025-2035 (USD Billion)
      9. | | 7.3.2 BY TREATMENT, 2025-2035 (USD Billion)
      10. | | 7.3.3 BY END USER, 2025-2035 (USD Billion)
      11. | 7.4 Canada MARKET SIZE ESTIMATES; FORECAST
      12. | | 7.4.1 BY TYPE, 2025-2035 (USD Billion)
      13. | | 7.4.2 BY TREATMENT, 2025-2035 (USD Billion)
      14. | | 7.4.3 BY END USER, 2025-2035 (USD Billion)
      15. | 7.5 Europe MARKET SIZE ESTIMATES; FORECAST
      16. | | 7.5.1 BY TYPE, 2025-2035 (USD Billion)
      17. | | 7.5.2 BY TREATMENT, 2025-2035 (USD Billion)
      18. | | 7.5.3 BY END USER, 2025-2035 (USD Billion)
      19. | 7.6 Germany MARKET SIZE ESTIMATES; FORECAST
      20. | | 7.6.1 BY TYPE, 2025-2035 (USD Billion)
      21. | | 7.6.2 BY TREATMENT, 2025-2035 (USD Billion)
      22. | | 7.6.3 BY END USER, 2025-2035 (USD Billion)
      23. | 7.7 UK MARKET SIZE ESTIMATES; FORECAST
      24. | | 7.7.1 BY TYPE, 2025-2035 (USD Billion)
      25. | | 7.7.2 BY TREATMENT, 2025-2035 (USD Billion)
      26. | | 7.7.3 BY END USER, 2025-2035 (USD Billion)
      27. | 7.8 France MARKET SIZE ESTIMATES; FORECAST
      28. | | 7.8.1 BY TYPE, 2025-2035 (USD Billion)
      29. | | 7.8.2 BY TREATMENT, 2025-2035 (USD Billion)
      30. | | 7.8.3 BY END USER, 2025-2035 (USD Billion)
      31. | 7.9 Russia MARKET SIZE ESTIMATES; FORECAST
      32. | | 7.9.1 BY TYPE, 2025-2035 (USD Billion)
      33. | | 7.9.2 BY TREATMENT, 2025-2035 (USD Billion)
      34. | | 7.9.3 BY END USER, 2025-2035 (USD Billion)
      35. | 7.10 Italy MARKET SIZE ESTIMATES; FORECAST
      36. | | 7.10.1 BY TYPE, 2025-2035 (USD Billion)
      37. | | 7.10.2 BY TREATMENT, 2025-2035 (USD Billion)
      38. | | 7.10.3 BY END USER, 2025-2035 (USD Billion)
      39. | 7.11 Spain MARKET SIZE ESTIMATES; FORECAST
      40. | | 7.11.1 BY TYPE, 2025-2035 (USD Billion)
      41. | | 7.11.2 BY TREATMENT, 2025-2035 (USD Billion)
      42. | | 7.11.3 BY END USER, 2025-2035 (USD Billion)
      43. | 7.12 Rest of Europe MARKET SIZE ESTIMATES; FORECAST
      44. | | 7.12.1 BY TYPE, 2025-2035 (USD Billion)
      45. | | 7.12.2 BY TREATMENT, 2025-2035 (USD Billion)
      46. | | 7.12.3 BY END USER, 2025-2035 (USD Billion)
      47. | 7.13 APAC MARKET SIZE ESTIMATES; FORECAST
      48. | | 7.13.1 BY TYPE, 2025-2035 (USD Billion)
      49. | | 7.13.2 BY TREATMENT, 2025-2035 (USD Billion)
      50. | | 7.13.3 BY END USER, 2025-2035 (USD Billion)
      51. | 7.14 China MARKET SIZE ESTIMATES; FORECAST
      52. | | 7.14.1 BY TYPE, 2025-2035 (USD Billion)
      53. | | 7.14.2 BY TREATMENT, 2025-2035 (USD Billion)
      54. | | 7.14.3 BY END USER, 2025-2035 (USD Billion)
      55. | 7.15 India MARKET SIZE ESTIMATES; FORECAST
      56. | | 7.15.1 BY TYPE, 2025-2035 (USD Billion)
      57. | | 7.15.2 BY TREATMENT, 2025-2035 (USD Billion)
      58. | | 7.15.3 BY END USER, 2025-2035 (USD Billion)
      59. | 7.16 Japan MARKET SIZE ESTIMATES; FORECAST
      60. | | 7.16.1 BY TYPE, 2025-2035 (USD Billion)
      61. | | 7.16.2 BY TREATMENT, 2025-2035 (USD Billion)
      62. | | 7.16.3 BY END USER, 2025-2035 (USD Billion)
      63. | 7.17 South Korea MARKET SIZE ESTIMATES; FORECAST
      64. | | 7.17.1 BY TYPE, 2025-2035 (USD Billion)
      65. | | 7.17.2 BY TREATMENT, 2025-2035 (USD Billion)
      66. | | 7.17.3 BY END USER, 2025-2035 (USD Billion)
      67. | 7.18 Malaysia MARKET SIZE ESTIMATES; FORECAST
      68. | | 7.18.1 BY TYPE, 2025-2035 (USD Billion)
      69. | | 7.18.2 BY TREATMENT, 2025-2035 (USD Billion)
      70. | | 7.18.3 BY END USER, 2025-2035 (USD Billion)
      71. | 7.19 Thailand MARKET SIZE ESTIMATES; FORECAST
      72. | | 7.19.1 BY TYPE, 2025-2035 (USD Billion)
      73. | | 7.19.2 BY TREATMENT, 2025-2035 (USD Billion)
      74. | | 7.19.3 BY END USER, 2025-2035 (USD Billion)
      75. | 7.20 Indonesia MARKET SIZE ESTIMATES; FORECAST
      76. | | 7.20.1 BY TYPE, 2025-2035 (USD Billion)
      77. | | 7.20.2 BY TREATMENT, 2025-2035 (USD Billion)
      78. | | 7.20.3 BY END USER, 2025-2035 (USD Billion)
      79. | 7.21 Rest of APAC MARKET SIZE ESTIMATES; FORECAST
      80. | | 7.21.1 BY TYPE, 2025-2035 (USD Billion)
      81. | | 7.21.2 BY TREATMENT, 2025-2035 (USD Billion)
      82. | | 7.21.3 BY END USER, 2025-2035 (USD Billion)
      83. | 7.22 South America MARKET SIZE ESTIMATES; FORECAST
      84. | | 7.22.1 BY TYPE, 2025-2035 (USD Billion)
      85. | | 7.22.2 BY TREATMENT, 2025-2035 (USD Billion)
      86. | | 7.22.3 BY END USER, 2025-2035 (USD Billion)
      87. | 7.23 Brazil MARKET SIZE ESTIMATES; FORECAST
      88. | | 7.23.1 BY TYPE, 2025-2035 (USD Billion)
      89. | | 7.23.2 BY TREATMENT, 2025-2035 (USD Billion)
      90. | | 7.23.3 BY END USER, 2025-2035 (USD Billion)
      91. | 7.24 Mexico MARKET SIZE ESTIMATES; FORECAST
      92. | | 7.24.1 BY TYPE, 2025-2035 (USD Billion)
      93. | | 7.24.2 BY TREATMENT, 2025-2035 (USD Billion)
      94. | | 7.24.3 BY END USER, 2025-2035 (USD Billion)
      95. | 7.25 Argentina MARKET SIZE ESTIMATES; FORECAST
      96. | | 7.25.1 BY TYPE, 2025-2035 (USD Billion)
      97. | | 7.25.2 BY TREATMENT, 2025-2035 (USD Billion)
      98. | | 7.25.3 BY END USER, 2025-2035 (USD Billion)
      99. | 7.26 Rest of South America MARKET SIZE ESTIMATES; FORECAST
      100. | | 7.26.1 BY TYPE, 2025-2035 (USD Billion)
      101. | | 7.26.2 BY TREATMENT, 2025-2035 (USD Billion)
      102. | | 7.26.3 BY END USER, 2025-2035 (USD Billion)
      103. | 7.27 MEA MARKET SIZE ESTIMATES; FORECAST
      104. | | 7.27.1 BY TYPE, 2025-2035 (USD Billion)
      105. | | 7.27.2 BY TREATMENT, 2025-2035 (USD Billion)
      106. | | 7.27.3 BY END USER, 2025-2035 (USD Billion)
      107. | 7.28 GCC Countries MARKET SIZE ESTIMATES; FORECAST
      108. | | 7.28.1 BY TYPE, 2025-2035 (USD Billion)
      109. | | 7.28.2 BY TREATMENT, 2025-2035 (USD Billion)
      110. | | 7.28.3 BY END USER, 2025-2035 (USD Billion)
      111. | 7.29 South Africa MARKET SIZE ESTIMATES; FORECAST
      112. | | 7.29.1 BY TYPE, 2025-2035 (USD Billion)
      113. | | 7.29.2 BY TREATMENT, 2025-2035 (USD Billion)
      114. | | 7.29.3 BY END USER, 2025-2035 (USD Billion)
      115. | 7.30 Rest of MEA MARKET SIZE ESTIMATES; FORECAST
      116. | | 7.30.1 BY TYPE, 2025-2035 (USD Billion)
      117. | | 7.30.2 BY TREATMENT, 2025-2035 (USD Billion)
      118. | | 7.30.3 BY END USER, 2025-2035 (USD Billion)
      119. | 7.31 PRODUCT LAUNCH/PRODUCT DEVELOPMENT/APPROVAL
      120. | | 7.31.1
      121. | 7.32 ACQUISITION/PARTNERSHIP
      122. | | 7.32.1

    Cardiomyopathy Medication Market Segmentation

    Market Segmentation Overview

    • Detailed segmentation data will be available in the full report
    • Comprehensive analysis by multiple parameters
    • Regional and country-level breakdowns
    • Market size forecasts by segment
    Infographic

    Free Sample Request

    Kindly complete the form below to receive a free sample of this Report

    Get Free Sample

    Customer Strories

    “I am very pleased with how market segments have been defined in a relevant way for my purposes (such as "Portable Freezers & refrigerators" and "last-mile"). In general the report is well structured. Thanks very much for your efforts.”

    Victoria Milne

    Founder
    Case Study
    Chemicals and Materials

    Compare Licence

    ×
    Features License Type
    Single User Multiuser License Enterprise User
    Price $4,950 $5,950 $7,250
    Maximum User Access Limit 1 User Upto 10 Users Unrestricted Access Throughout the Organization
    Free Customization
    Direct Access to Analyst
    Deliverable Format
    Platform Access
    Discount on Next Purchase 10% 15% 15%
    Printable Versions