• Cat-intel
  • MedIntelliX
  • Resources
  • About Us
  • Request Free Sample ×

    Kindly complete the form below to receive a free sample of this Report

    Leading companies partner with us for data-driven Insights

    clients tt-cursor

    Breakfast Products Market

    ID: MRFR/F-B & N/38467-CR
    250 Pages
    Harshita Gorade
    December 2024

    Breakfast Products Market Research Report Information By Type (Cereals & Grains, Bakery Products, Beverages, Egg And Meat Based Products), By Price Range (Economy, Premium), By Claim (Organic And Natural, Gluten-Free, Vegan And Plant-Based, High-Protein / Low-Carb, Sugar-Free / Low-Sugar, Functional Foods, Conventional), By Age Group (Kids, Adults, Senior), By Source (Animal Based, Plant Based), By End-User (Residential, Commercial), By Distribution Channel (B2B, B2C), By Packaging Format (Single-Serve Packs, Family Packs, Bulk Packaging...

    Share:
    Download PDF ×

    We do not share your information with anyone. However, we may send you emails based on your report interest from time to time. You may contact us at any time to opt-out.

    Breakfast Products Market Research Report — Global Forecast till 2032 Infographic
    Purchase Options
    $ 4,950.0
    $ 5,950.0
    $ 7,250.0
    Table of Contents

    Breakfast Products Market Summary

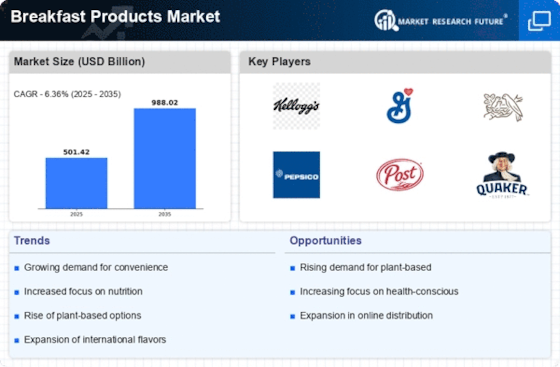
    The Global Breakfast Products Market is projected to grow significantly from 494.0 USD Billion in 2024 to 987.5 USD Billion by 2035.

    Key Market Trends & Highlights

    Breakfast Products Key Trends and Highlights

    • The market is expected to experience a compound annual growth rate (CAGR) of 6.5 percent from 2025 to 2035.
    • By 2035, the market valuation is anticipated to reach 987.5 USD Billion, indicating robust growth potential.
    • In 2024, the market is valued at 494.0 USD Billion, reflecting a strong foundation for future expansion.
    • Growing adoption of healthy eating habits due to increasing health consciousness is a major market driver.

    Market Size & Forecast

    2024 Market Size 494.0 (USD Billion)
    2035 Market Size 987.5 (USD Billion)
    CAGR (2025-2035) 6.5%

    Major Players

    Nestle SA, Marico, PepsiCo, Inc., General Mills, The Kellogg Company, The Kraft Heinz Company, Post Holdings, Inc., The Hain Celestial Group, Inc., Patanjali Foods Limited, Food For Life

    Breakfast Products Market Trends

    Rising demand for single serve, on-the-go options

    The Breakfast Products Market is witnessing key trends driven by changing consumer preferences. Rising demand for healthy and nutritious options is a major trend, particularly in developed regions like North America and Europe. Consumers are increasingly opting for foods rich in vitamins, protein, and fiber while avoiding sugar and artificial ingredients. This has led to the popularity of plant-based milk, fortified cereals, protein-rich yogurts, and gluten-free alternatives. The growing awareness of lifestyle-related ailments like diabetes and obesity has also driven the “clean label” movement, encouraging manufacturers to disclose ingredients and prioritize organic, non-GMO, and allergy-free products.

    Convenience and on-the-go breakfast solutions are gaining traction as busy urban lifestyles demand quick, portable options such as smoothies, breakfast bars, and pre-packaged meals. The COVID-19 pandemic briefly restrained this trend, but it has since rebounded with innovations in single-serve packaging and microwaveable products catering to time-pressed consumers. Companies also offer tailored options for vegan or low-carb diets. Sustainability and ethical sourcing have become central to the breakfast industry as consumers seek eco-friendly products. This includes sustainable packaging, ethical production practices, and responsible sourcing.

    Companies are adopting certifications like Rainforest Alliance and fair-trade, using regenerative agriculture, and incorporating recyclable or biodegradable packaging. Efforts to minimize food waste by repurposing ingredients are also notable. Brands prioritizing health, convenience, and sustainability are well-positioned to thrive in the evolving breakfast market.

    The increasing consumer preference for convenient and nutritious breakfast options appears to be reshaping the landscape of the global breakfast products market, driving innovation and diversification in product offerings.

    U.S. Department of Agriculture

    Breakfast Products Market Drivers

    Market Growth Projections

    The Global Breakfast Products Market Industry is poised for substantial growth, with projections indicating a market size of 494.0 USD Billion in 2024 and a remarkable increase to 987.5 USD Billion by 2035. This trajectory suggests a compound annual growth rate of 6.5% from 2025 to 2035, highlighting the industry's resilience and adaptability. Factors such as rising health consciousness, convenience demands, and innovative product offerings are likely to drive this growth. As the market evolves, stakeholders must remain vigilant to emerging trends and consumer preferences to capitalize on the opportunities presented by this expanding sector.

    Growing E-commerce Channels

    The expansion of e-commerce platforms significantly impacts the Global Breakfast Products Market Industry. Online shopping provides consumers with greater access to a diverse range of breakfast products, often at competitive prices. This shift towards digital purchasing is particularly evident among younger consumers, who favor the convenience of online shopping. As e-commerce continues to grow, it is likely to reshape traditional retail dynamics, allowing brands to reach a broader audience. The increasing reliance on online channels may contribute to the overall market growth, as consumers seek convenience and variety in their breakfast choices.

    Rising Health Consciousness

    The Global Breakfast Products Market Industry experiences a notable shift as consumers increasingly prioritize health and wellness. This trend is reflected in the growing demand for nutritious breakfast options, such as whole grains, low-sugar cereals, and plant-based proteins. In 2024, the market is projected to reach 494.0 USD Billion, driven by the desire for healthier eating habits. Consumers are more inclined to choose products that offer functional benefits, such as added vitamins and minerals. This shift towards health-oriented breakfast products suggests a potential for sustained growth in the industry, as manufacturers adapt to meet evolving consumer preferences.

    Innovative Product Offerings

    Innovation plays a crucial role in shaping the Global Breakfast Products Market Industry. Manufacturers are increasingly introducing unique flavors, textures, and formulations to attract diverse consumer segments. For instance, the rise of gluten-free and keto-friendly breakfast options caters to specific dietary needs, while exotic flavors appeal to adventurous eaters. This emphasis on innovation not only enhances product variety but also drives consumer interest and engagement. As the market evolves, the introduction of novel breakfast products is expected to sustain a compound annual growth rate of 6.5% from 2025 to 2035, indicating a robust potential for growth.

    Convenience and On-the-Go Options

    The fast-paced lifestyle of modern consumers significantly influences the Global Breakfast Products Market Industry. There is a marked increase in demand for convenient, ready-to-eat breakfast options that cater to busy schedules. Products such as breakfast bars, instant oatmeal, and single-serve yogurt are gaining traction, as they offer quick solutions without compromising nutrition. This trend is likely to contribute to the market's expansion, with projections indicating a growth trajectory that could see the industry reach 987.5 USD Billion by 2035. The convenience factor appears to resonate particularly with younger demographics, who prioritize efficiency in their daily routines.

    Cultural Diversity and Globalization

    Cultural diversity and globalization are pivotal drivers of the Global Breakfast Products Market Industry. As consumers become more exposed to international cuisines, there is a rising interest in diverse breakfast options that reflect various cultural traditions. This trend encourages manufacturers to explore and introduce products inspired by global flavors, such as Asian rice dishes or Mediterranean spreads. The incorporation of these diverse offerings not only caters to evolving consumer tastes but also enhances market appeal across different regions. The growing appreciation for multicultural breakfast experiences suggests a dynamic landscape for the industry, fostering innovation and expansion.

    Market Segment Insights

    Breakfast Products Market Segment Insights

    Breakfast Products Market Segment Insights

    Global Breakfast Products Type Insights

    Global Breakfast Products Type Insights

    Based on the type, the Breakfast Products Market has been bifurcated into cereals & grains, bakery products, breakfast beverages, egg-based products, meat & protein products, and snacks & on-the-go products. The cereals & grains segment is divided into ready-to-eat (RTE) cereals and ancient grains. The ready-to-eat (RTE) Cereals sub-segment is divided into oats, muesli, granola, cornflakes, and others. The ancient grains sub-segment is divided into quinoa and amaranth. The bakery products sub-segment is divided into dairy & plant-based alternatives, milk & plant milks, yogurt & dairy alternatives, cheese, and spreads.

    The breakfast beverages sub-segment is divided into tea & coffee, smoothies & ready-to-drink beverages, and fruit juices. The Bakery Products segment accounted for the largest market share of 34.23% in 2023 and is likely to register a CAGR of 5.84% during the projected period. Whereas the Egg and Meat Based Products segment will likely register the highest CAGR of 7.41% during the projected period. A component of breakfast meals are bakery items that provide many different kinds of alternatives to suit different dietary requirements and tastes.

    Bread, pastries, muffins, bagels, croissants, and rolls are typical breakfast bakery items; each has a distinct flavor and texture to go well with the morning meal. Breads that are traditional in nature, such as whole wheat, white, and multigrain, frequently serve themselves on their own or with spreads like jam and butter. With their perfect blend of sweetness and texture, muffins, especially bran, and fruit variants like banana nut and blueberry make a quick and easy breakfast choice for people who are often on the go. Popular morning bakery foods include pastries like Danishes, croissants, and cinnamon rolls.

    Their flaky, rich textures go well with tea or coffee.

    Global Breakfast Products Price Range Insights

    Global Breakfast Products Price Range Insights

    Based on price range, the Breakfast Products Market has been segmented into economy/mass and premium. The Economy/Mass segment accounted for the largest market share of 66.80% in 2023 and is likely to register a CAGR of 6.75% during the projected period. Whereas the Premium segment will likely register the CAGR of 5.53% during the projected period. Breakfast economics, or the mass price range for breakfast products, means that breakfast products should be priced at a level that is standard and reasonable and provides the required primary breakfast convenience.

    This includes ready-to-eat cereals, instant oatmeal, granola sticks, breakfast biscuits, and so on that find a market for varied segments, primarily families or individuals on a budget with low to average income levels. In this segment of the market, manufacturers implement measures to cut costs, especially materials, try to create a quick technology of production, and thus use cheaper while functional packaging design. Supermarkets usually sell private labels that occupy quite a niche in the price segment. As the lower-range consumers need to be targeted, manufacturers have widely launched economical night meal varieties.

    Figure 2: Breakfast Products Market, by price range, 2023 & 2032 (USD Billion)

    Source: Secondary Research, Primary Research, Market Research Future Database and Analyst Review

    Breakfast Products Market Claim Insights

    Breakfast Products Market Claim Insights

    Based on the claim, the Breakfast Products Market has been bifurcated into Organic and Natural, gluten-free, vegan and plant-based, high-protein / low-carb, sugar-free / low-sugar, functional foods, and conventional. The High-Protein / Low-Carb segment accounted for the largest market share of 30.92% in 2023 and is likely to register a CAGR of 7.44% during the projected period. Whereas the Gluten-Free segment will likely register the CAGR of 6.78% during the projected period.

    Over the last couple of years, there has been an increase in the high-protein, low-carb breakfast products market due to the upsurge in the interest of people in the low-carb diet like ketogenic and paleo diets, along with the other known health benefits associated with the high-protein nutrition. Such products appeal to several people who want to control their weight, improve muscle recovery, or simply maintain solid energy provision all day long.

    Normally the high-protein breakfast would include foods such as eggs, Greek yogurt, cottage cheese, protein shakes, or specially manufactured foods such as low-carb granola, protein bars, or pancakes using coconut or almond flour. The main reason for this development is the change in focus toward functional foods that offer more than basic nutrition. Consumers have become more demanding on the type of breakfast products that they prefer, as they look for those that have high protein content and low carb options that will stimulate positive hunger.

    Figure 3: Breakfast Products Market, by claim, 2023 & 2032 (USD Billion)

    Breakfast Products Market Age Group Insights

    Breakfast Products Market Age Group Insights

    Based on the age group, the Breakfast Products Market has been bifurcated into kids, adults, and senior. The Adults segment accounted for the largest market share of 44.06% in 2023 and is likely to register a CAGR of 7.11% during the projected period. Whereas the Senior segment will likely register the CAGR of 6.09% during the projected period. For adults, breakfast is about more than just nourishment; it is also about proper timing. Due to busy lifestyles, many working adults need a nutritious meal that is quickly prepared and keeps them feeling full for long.

    High-protein oatmeal cups are good as they take less time to prepare yet provide rich nutritional value. However, it is also important to follow a healthy diet and include a proper mix of carbohydrates, fiber, and omega-3 fatty acids to keep one’s energy levels high and heart functioning well. Oatmeal cups come in different flavors to make them more appealing. Other than sweeteners like maple syrup and agave, there are also healthy options like vanilla almond or flavored berries.

    Figure 4: Breakfast Products Market, by Age Goup, 2023 & 2032 (USD Billion)

    Source: Secondary Research, Primary Research, Market Research Future Database and Analyst Review

    Breakfast Products Market Source Insights

    Breakfast Products Market Source Insights

    Based on the source, the Breakfast Products Market has been bifurcated into plant based and animal based. The Animal-based segment accounted for the largest market share of 62.18% in 2023 and is likely to register a CAGR of 6.59% during the projected period. Whereas the Plant-based segment will likely register the CAGR of 5.98% during the projected period. Animal products have long been a popular source of energy and nutrients that help stave off hunger throughout the day. There are quite a few breakfast products that are based on meat, including eggs, bacon, sausage, milk, cheese, and yogurt.

    These foods stand out because of their taste, their multifaceted nature, and invulnerable nutrition, particularly their ample supply of high-quality protein that is necessary in tissue formation, muscle maintenance, and metabolism. Eggs, a non-muscle meat product, are consumed widely around the world because of their ability to be cooked in several ways and their dense nutrient profile. They have vitamin B12, vitamin D, and vitamin A in abundance, along with iron and selenium. Often garnished out for their taste, bacon and sausages contain saturated fats and have cholesterol and therefore need to be consumed within a more balanced nutritional diet.

    Another huge source in the segment of such breakfast foods is the breakfast complements, exerting a large number of dairy raw sources of calcium and vitamin D, which are extremely important for the bones.

    Figure 5: Breakfast Products Market, by source, 2023 & 2032 (USD Billion)

    Breakfast Products Market End User Insights

    Breakfast Products Market End User Insights

    Based on the end user, the Breakfast Products Market has been bifurcated into residential and commercial. The commercial segment is divided into HoReCa/HoReBa, Corporates, and Others. The Residential segment accounted for the largest market share of 65.59% in 2023 and is likely to register a CAGR of 6.62% during the projected period. Whereas the Commercial segment will likely register the CAGR of 5.84% during the projected period. In many households in particular, breakfast remains central to family schedules.

    However, due to busy schedules during the mornings, a lot of families look for breakfast that is quick and easy yet healthy and diverse. Cereals, oatmeal, and yogurt in general are foods that are widely used and are helpful to having meals fast. More and more customers appreciate temptingly easy options such as granola bars, breakfast biscuits, ready-to-eat smoothies, and the like. Such options are relatively new and cater to the higher need for convenience among consumers.

    There is a shift in the attitude of consumers towards breakfast products to keep in shape and health and opt for breakfast cereals, particularly for families.

    Figure 6: Breakfast Products Market, by End-User, 2023 & 2032 (USD Billion)

    Breakfast Products Market Distribution Channel Insights

    Breakfast Products Market Distribution Channel Insights

    Based on the distribution channel, the Breakfast Products Market has been bifurcated into B2B and B2C. The B2C segment is divided into supermarket & hypermarket, departmental stores, online, and others. The B2C segment accounted for the largest market share of 64.74% in 2023 and is likely to register a CAGR of 6.57% during the projected period. Whereas the B2B segment will likely register the CAGR of 5.96% during the projected period. This business-to-consumer (B2C) breakfast product distribution channel serves end consumers through a variety of retail shops, including both online and offline.

    Such channels comprise supermarkets, groceries, convenience shops, and online and direct selling channels. The emphasis in B2C, however, is on making available different types of breakfast products for routine use, thus making breakfast foods readily available in the market. In the more traditional settings, breakfast items are stocked on the shelves in stores, and advertisements are made targeting certain groups of people. Breakfast items sold in supermarkets and grocery stores include cereals, bread, spreads, juices, coffee, yogurt, and pre-packaged breakfast snacks, among others.

    These types of stores have a great need for their supply chains to sustain the available product to market, and many use local and national wholesalers.

    Figure 7: Breakfast Products Market, by Distribution Channel, 2023 & 2032 (USD Billion)

    Breakfast Products Market Packaging Type Insights

    Breakfast Products Market Packaging Type Insights

    Based on the packaging format, the Breakfast Products Market has been bifurcated into single-serve packs, family packs, bulk packaging, and others. The Family Packs segment accounted for the largest market share of 34.74% in 2023 and is likely to register a CAGR of 6.37% during the projected period. Whereas the Single-Serve Packs segment will likely register the highest CAGR of 6.95% during the projected period. In the breakfast product market, family packs, which are intended for large family households, are commonplace. Serving sizes are lower than if breakfast cereals, oats, or cereal in general are bought in smaller units.

    This goes a long way in meeting the needs of families with several members and ensuring that there is enough supply of the product to cater for everyone. Packages with more serving sizes also save time, as there is a reduced frequency of grocery shopping due to the fact that they will last longer than the smaller packages. Family packs are quite popular, especially among the parents, due to the fact that the packs help in reducing breakfast items going missing and panic during mornings when they are likely to be busy.

    Figure 8: Breakfast Products Market, By Packaging Format, 2023 & 2032 (USD Billion)

    Source: Secondary Research, Primary Research, Market Research Future Database and Analyst Review

    Get more detailed insights about Breakfast Products Market Research Report — Global Forecast till 2032

    Regional Insights

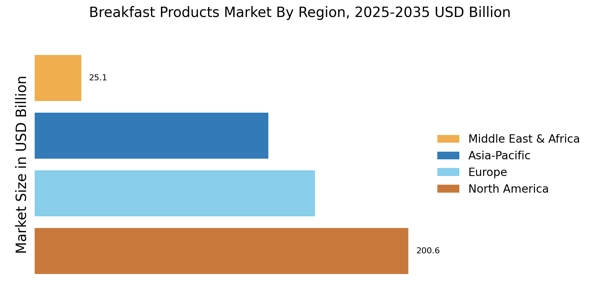
    Based on region, the report on the Breakfast Products Market has been segmented into North America, South America, Europe, Asia Pacific, Middle East & Africa. The APAC accounted for 35.01% of the market share in 2023 and is poised to reach USD 302.88 billion by 2032. The Asia-Pacific region comprises China, India, and the rest of Asia-Pacific. The breakfast products market in the Asia-Pacific region is a dynamic and rapidly growing sector, shaped by diverse culinary traditions and evolving consumer preferences.

    This market encompasses a wide array of offerings, ranging from traditional dishes to modern convenience foods, reflecting the rich cultural tapestry of the region. One of the primary segments is cereals and grains, where ready-to-eat (RTE) cereals have gained significant traction. These cereals are particularly appealing to busy consumers seeking quick yet nutritious breakfast options. Brands like Kellogg's and Nestlé have introduced various products that cater to local tastes, such as rice-based cereals in Southeast Asia and oat-based options in Australia. In addition to cereals, bakery products play an essential role in breakfast routines across Asia-Pacific.

    Figure 5: Breakfast Products Market, by region, 2023 & 2032 (USD Billion)

    Breakfast Products Market, by region, 2023 & 2032

    Source: Secondary Research, Primary Research, Market Research Future Database and Analyst Review

    Key Players and Competitive Insights

    Breakfast Products Market is likely to grow with a CAGR of 6.36% during the forthcoming years. This growth can be attributed to several key factors, including changing consumer preferences, increased health consciousness, and the demand for convenience in meal options. A growing awareness of health and wellness is reshaping breakfast choices. Consumers are increasingly opting for nutritious options such as oats, muesli, and whole-grain products due to rising incidences of lifestyle-related diseases like diabetes and obesity. The demand for ready-to-eat (RTE) and easy-to-prepare breakfast foods is surging, particularly among busy urban populations.

    Products that offer quick preparation times cater to the fast-paced lifestyles of consumers who prioritize convenience without compromising health. As urban areas expand, more individuals are leading hectic lives that necessitate quick meal solutions. This trend is particularly evident in regions with increasing disposable incomes, where consumers seek accessible and nutritious breakfast options. There is substantial potential for companies to innovate within the breakfast segment. The rise of plant-based diets and gluten-free options presents opportunities for brands to develop new products that meet these dietary preferences.

    Key Companies in the Breakfast Products Market market include

    Industry Developments

    October 24- General Mills is launching a new limited-edition cereal called The One with The Vanilla Bean Latte Cereal Flavor, inspired by the TV show ‘Friends, ‘which will be available in December 2024. This cereal features a blend of whole wheat and corn flakes with a sweet vanilla and coffee flavor.

    September 24- Marico Limited has launched Saffola Masala Millets to enhance its health-focused product line. The new offering is available in two flavours, Masala Delight and Tomato Delight, and is part of Marico’s strategy to expand its millet-based portfolio under the Saffola brand.

    Future Outlook

    Breakfast Products Market Future Outlook

    The Global Breakfast Products Market is projected to grow at a 6.5% CAGR from 2024 to 2035, driven by rising health consciousness, innovative product offerings, and expanding distribution channels.

    New opportunities lie in:

    • Develop plant-based breakfast options to cater to health-conscious consumers.
    • Leverage e-commerce platforms for direct-to-consumer sales strategies.
    • Invest in sustainable packaging solutions to enhance brand appeal and reduce environmental impact.

    By 2035, the market is expected to achieve substantial growth, reflecting evolving consumer preferences and innovative product developments.

    Market Segmentation

    Breakfast Products Market Type Outlook

    • Cereals & Grains
    • Bakery Products
    • Beverages
    • Egg And Meat Based Products

    Breakfast Products Market Claim Outlook

    • Organic And Natural
    • Gluten-Free, Vegan and Plant-Based
    • High-Protein / Low-Carb
    • Sugar-Free / Low-Sugar
    • Functional Foods
    • Conventional

    Breakfast Products Market Source Outlook

    • Animal-based
    • Plant-based

    Breakfast Products Market End User Outlook

    • Residential
    • Commercial

    Global Breakfast Products Regional Outlook

    North America
    • USA
    • Canada
    • Mexico

    Breakfast Products Market Age Group Outlook

    • Kids
    • Adults
    • Senior

    Breakfast Products Market Price Range Outlook

    • Economy/Mass
    • Premium

    Global Breakfast Products Packaging Type Outlook

    • Single-Serve Packs
    • Family Packs
    • Bulk Packaging
    • Others

    Global Breakfast Products Distribution Channel Outlook

    • B2B
    • B2C

    Report Scope

    Report Attribute/Metric Details
    Market Size 2023 USD 471.44 billion
    Market Size 2032 USD 820.74 billion
    Compound Annual Growth Rate (CAGR) 6.36% (2024-2032)
    Base Year 2023
    Forecast Period 2024-2032
    Historical Data 2018-2022
    Forecast Units Value (USD Billion)
    Report Coverage Revenue Forecast, Competitive Landscape, Growth Factors, and Trends
    Segments Covered Type, Price Range, Claim, Age, Source, End-User, Distribution Channel, Region
    Geographies Covered North America, Europe, South America, Asia Pacific, Middle East & Africa
    Countries Covered USA, Canada, Mexico, UK, Germany, France, Italy Spain, Russia, China, India, Japan, South Korea, Australia & New Zealand, Brazil, Argentina, South Africa, Turkey, GCC countries.
    Key Companies Profiled ·         Nestle SA ·         Marico ·         PepsiCo, Inc. ·         General Mills ·         The Kellogg Company ·         The Kraft Heinz Company ·         Post Holdings, Inc. ·         The Hain Celestial Group, Inc. ·         Patanjali Foods Limited ·         Food For Life
    Key Market Opportunities ·         Expansion Of Healthy & Functional Foods ·         Growing Veganism and Flexitarianism ·         Increasing Popularity of Frozen Breakfast Foods
    Key Market Dynamics ·         Growing Demand for An Easy-To-Prepare and Ready-To-Eat Meal Due to The Busy Schedule ·         Rising Demand for Plant-Based and Protein-Rich Breakfast ·         Rising Healthy Packaged Food Consumption and Changing the Dietary Pattern

    Market Highlights

    Author
    Harshita Gorade
    Research Analyst

    Harshita Post graduate MBA in Business Administration from Welingkar Institute, Mumbai and 5 years of experience in the field of product market research. As a Research Analyst, I have cross-domain experience in packaging, and industrial Automation & Equipment. I am currently looking after the research process of packaging, logistics & transportation, and industrial automation & equipment at Market Research Future Reports. My responsibilities at the organization involve handling syndicate and custom reports as well as responding to client inquiries, and organize, co-ordinate with a group of 5 to 6 persons to manage all workflows.

    Leave a Comment

    FAQs

    How much is the Breakfast Products Market in 2024?

    The Processed meat market accounted for USD 501.15 billion.

    What is the key driving factor for the Breakfast Products Market?

    Growing Demand for An Easy-To-Prepare and Ready-To-Eat Meal Due to The Busy Schedule, Rising Demand for Plant-Based and Protein-Rich Breakfast, Rising Healthy Packaged Food Consumption and Changing the Dietary Pattern

    What is the growth rate of the Breakfast Products Market?

    The growth rate of the Breakfast Products Market is 6.36% CAGR.

    Which region held the largest market share in the Breakfast Products Market?

    The Asia Pacific region held the largest market share in the Breakfast Products Market.

    Who are the key players in the Global Breakfast Products?

    Nestle SA Marico PepsiCo, Inc. General Mills The Kellogg Company The Kraft Heinz Company Post Holdings, Inc. The Hain Celestial Group, Inc. Patanjali Foods Limited Food For Life

    1. 'TABLE OF CONTENTS
    2. EXECUTIVE SUMMARY 25
      1. MARKET ATTRACTIVENESS
    3. ANALYSIS 27
      1. GLOBAL BREAKFAST PRODUCTS MARKET, BY TYPE 28
        1. GLOBAL
    4. BREAKFAST PRODUCTS MARKET, BY PRICE RANGE 29
      1. GLOBAL BREAKFAST PRODUCTS
    5. MARKET, BY CLAIM 30
      1. GLOBAL BREAKFAST PRODUCTS MARKET, BY AGE GROUP 31
        1. GLOBAL BREAKFAST PRODUCTS MARKET, BY SOURCE 32
        2. GLOBAL BREAKFAST
    6. PRODUCTS MARKET, BY END USER 33
      1. GLOBAL BREAKFAST PRODUCTS MARKET, BY
    7. DISTRIBUTION CHANNEL 34
      1. GLOBAL BREAKFAST PRODUCTS MARKET, BY PACKGING
    8. FORMAT 35
      1. GLOBAL BREAKFAST PRODUCTS MARKET, BY REGION 36
    9. MARKET INTRODUCTION 38
      1. DEFINITION 38
      2. SCOPE OF THE STUDY 38
      3. RESEARCH
    10. OBJECTIVE 38
      1. MARKET STRUCTURE 39
    11. RESEARCH METHODOLOGY 40
    12. OVERVIEW 40
      1. DATA FLOW 42
        1. DATA MINING PROCESS 42
      2. PURCHASED
    13. DATABASE: 43
      1. SECONDARY SOURCES: 44
        1. SECONDARY RESEARCH DATA FLOW:
      2. PRIMARY RESEARCH: 46
        1. PRIMARY RESEARCH DATA FLOW: 47
    14. PRIMARY RESEARCH: NUMBER OF INTERVIEWS CONDUCTED 48
      1. PRIMARY RESEARCH:
    15. REGIONAL COVERAGE 48
      1. APPROACHES FOR MARKET SIZE ESTIMATION: 49
    16. CONSUMPTION & NET TRADE APPROACH 49
      1. REVENUE ANALYSIS APPROACH 49
      2. DATA FORECASTING 50
        1. DATA FORECASTING TECHNIQUE 50
      3. DATA
    17. MODELING 51
      1. MICROECONOMIC FACTOR ANALYSIS: 51
        1. DATA MODELING:
      2. TEAMS AND ANALYST CONTRIBUTION 54
    18. MARKET DYNAMICS 56
    19. INTRODUCTION 56
      1. DRIVERS 57
        1. GROWING DEMAND FOR AN EASY-TO-PREPARE
    20. AND READY-TO-EAT MEAL DUE TO THE BUSY SCHEDULE 57
      1. RISING DEMAND FOR PLANT-BASED
    21. AND PROTEIN-RICH BREAKFAST 59
      1. RISING HEALTHY PACKAGED FOOD CONSUMPTION
    22. AND CHANGING THE DIETARY PATTERN 60
      1. RESTRAINTS 62
        1. PREFERENCE
    23. FOR TRADITIONAL BREAKFAST 62
      1. PREFERENCE FOR FRESH FOOD 62
      2. OPPORTUNITY
        1. EXPANSION OF HEALTHY & FUNCTIONAL FOODS 64
        2. GROWING
    24. VEGANISM AND FLEXITARIANISM 64
      1. INCREASING POPULARITY OF FROZEN BREAKFAST
    25. FOODS 65
      1. CHALLENGES 66
        1. DECLINING POPULARITY OF TRADITIONAL SUGARY
    26. BREAKFAST CEREALS 66
      1. PRICE SENSITIVITY RESTRICTS ADOPTION OF PREMIUM,
    27. HEALTH-FOCUSED BREAKFAST PRODUCTS 66
      1. STRATEGIC INSIGHTS 68
        1. TECHNOLOGY
    28. UPDATE 68
      1. REGIONAL MARKETS TO LOOKOUT FOR 68
      2. REGULATORY UPDATE
      3. MARKET TRENDS 69
      4. IMPACT ANALYSIS OF COVID-19 70
    29. IMPACT ON OVERALL FOOD & BEVERAGES INDUSTRY 71
      1. ECONOMIC IMPACT
        1. IMPACT ON GLOBAL BREAKFAST PRODUCTS MARKET 71
        2. IMPACT ON
    30. SUPPLY CHAIN OF BREAKFAST PRODUCTS 72
      1. IMPACT ON MARKET DEMAND OF BREAKFAST
    31. PRODUCTS 72
      1. IMPACT DUE TO RESTRICTIONS/LOCKDOWN 73
        1. CONSUMER
    32. SENTIMENTS 73
      1. IMPACT ON PRICING OF BREAKFAST PRODUCTS 73
        1. CONSUMER
    33. BEHAVIOR ANALYSIS 74
    34. MARKET FACTOR ANALYSIS 75
      1. VALUE CHAIN ANALYSIS
        1. RAW MATERIALS 75
        2. MANUFACTURING / PRODUCTION/ PROCESSING
        3. PACKING 76
      2. SUPPLY CHAIN ANALYSIS 77
        1. PARTICIPANTS
    35. (AT DIFFERENT NODES) 77
      1. RAW MATERIAL SUPPLIERS 77
        1. MANUFACTURERS
        2. INTEGRATION
    36. LEVELS 78
      1. KEY ISSUES ADDRESSED (KEY SUCCESS FACTORS) 79
      2. PORTER’S
    37. FIVE FORCES MODEL 80
      1. BARGAINING POWER OF SUPPLIERS 80
        1. BARGAINING
    38. POWER OF BUYERS 81
      1. THREAT OF NEW ENTRANTS 81
        1. THREAT OF SUBSTITUTES
        2. INTENSITY OF RIVALRY 82
      2. REGULATORY LANDSCAPE 82
    39. STRATEGY INSIGHTS 84
      1. PRICING ANALYSIS BY REGION 86
      2. MRFR RECOMMENDATIONS
        1. NATURAL OR CONVENTIONAL OR ORGANIC AS WELL AS CONVENIENCE USE 87
        2. CONSUMPTION BASED ON SEASON 87
      3. GLOBAL PRODUCTION ANALYSIS 88
      4. ANALYSIS ON NATURAL FLAVORS WITH RESPECT TO BREAKFAST PRODUCTS 88
    40. COMPETITORS INFORMATION 89
      1. PRODUCT OFFERING WITH PACK SIZE 89
    41. FLAVOR 89
      1. IMPORT/EXPORT ANALYSIS OF BREAKFAST CEREALS 90
        1. EXPORT
    42. ANALYSIS OF BREAKFAST CEREALS 90
      1. IMPORT ANALYSIS OF BREAKFAST CEREALS
    43. GLOBAL BREAKFAST PRODUCTS MARKET, BY TYPE 92
      1. INTRODUCTION 92
      2. CEREALS & GRAINS 93
        1. READY-TO-EAT (RTE) CEREALS 94
    44. OATS 94
      1. MUESLI 94
        1. GRANOLA 94
        2. ANCIENT GRAINS 95
    45. AMARANTH 95
      1. BAKERY PRODUCTS 96
      2. BEVERAGES 97
      3. EGG AND MEAT
    46. BASED PRODUCTS 97
    47. GLOBAL BREAKFAST PRODUCTS MARKET, BY PRICE RANGE 99
      1. INTRODUCTION 99
      2. ECONOMY/MASS 100
      3. PREMIUM 101
    48. GLOBAL
    49. BREAKFAST PRODUCTS MARKET, BY CLAIM 102
      1. INTRODUCTION 102
      2. ORGANIC
    50. AND NATURAL 103
      1. GLUTEN-FREE 104
      2. VEGAN AND PLANT-BASED 105
    51. HIGH-PROTEIN / LOW-CARB 106
      1. SUGAR-FREE / LOW-SUGAR 106
      2. FUNCTIONAL
    52. FOODS 107
      1. CONVENTIONAL 108
    53. GLOBAL BREAKFAST PRODUCTS MARKET, BY
    54. AGE GROUP 110
      1. INTRODUCTION 110
      2. KIDS 111
      3. ADULTS 112
      4. SENIOR 112
    55. GLOBAL BREAKFAST PRODUCTS MARKET, BY SOURCE 114
    56. INTRODUCTION 114
      1. PLANT-BASED 115
      2. ANIMAL-BASED 116
    57. GLOBAL
    58. BREAKFAST PRODUCTS MARKET, BY END USER 118
      1. INTRODUCTION 118
    59. RESIDENTIAL 119
      1. COMMERICAL 120
        1. HORECA/HOREBA 120
    60. CORPORATES 120
      1. OTHERS 120
    61. GLOBAL BREAKFAST PRODUCTS MARKET,
    62. BY DISTRIBUTION CHANNEL 122
      1. INTRODUCTION 122
      2. B2B 123
    63. B2C 124
      1. SUPERMARKET & HYPERMARKET 124
        1. DEPARTMENTAL STORES
        2. ONLINE 125
        3. OTHERS 125
    64. GLOBAL BREAKFAST PRODUCTS
    65. MARKET, BY PACKAGING FORMAT 127
      1. INTRODUCTION 127
      2. SINGLE-SERVE
    66. PACKS 128
      1. FAMILY PACKS 129
      2. BULK PACKAGING 130
      3. OTHERS
    67. GLOBAL BREAKFAST PRODUCTS MARKET, BY REGION 132
      1. OVERVIEW 132
      2. NORTH AMERICA 133
        1. US 139
        2. CANADA 142
        3. MEXICO
      3. SOUTH AMERICA 148
        1. BRAZIL 154
        2. ARGENTINA 157
        3. REST OF SOUTH AMERICA 160
      4. EUROPE 163
        1. UK 168
    68. GERMANY 171
      1. SPAIN 174
        1. ITALY 177
        2. FRANCE 180
        3. RUSSIA 183
        4. REST OF EUROPE 186
      2. ASIA-PACIFIC 190
        1. ASIA-PACIFIC 193
        2. CHINA 196
        3. INDIA
        4. JAPAN 202
        5. SOUTH KOREA 205
        6. AUSTRALIA &
    69. NEW ZEALAND 208
      1. REST OF ASIA-PACIFIC 211
      2. MIDDLE EAST &
    70. AFRICA 214
      1. GCC 220
        1. TURKEY 223
        2. NORTHERN AFRICA
        3. SOUTHERN AFRICA 229
    71. COMPETITIVE LANDSCAPE 233
    72. INTRODUCTION 233
      1. COMPETITION DASHBOARD 234
        1. PRODUCT PORTFOLIO
        2. REGIONAL PRESENCE 235
        3. STRATEGIC ALLIANCES 235
    73. INDUSTRY EXPERIENCES 235
      1. MARKET SHARE ANALYSIS, 2023 235
      2. WHO
    74. ARE THE MAJOR DISRUPTORS & INNOVATORS 235
      1. WHAT STRATEGIES ARE BEING
    75. ADOPTED BY MARKET LEADERS 236
      1. COMPARATIVE ANALYSIS: KEY PLAYERS FINANCIAL
      2. LIST OF KEY PLAYERS/BRANDS, BY REGION 237
      3. KEY DEVELOPMENTS
    76. & GROWTH STRATEGIES 237
      1. PRODUCT LAUNCH 237
    77. COMPANY PROFILES
      1. GENERAL MILLS INC. 240
        1. COMPANY OVERVIEW 240
    78. FINANCIAL OVERVIEW 241
      1. PRODUCTS OFFERED 241
        1. KEY DEVELOPMENTS
        2. SWOT ANALYSIS 243
        3. KEY STRATEGY 243
      2. NESTLE
    79. SA 244
      1. COMPANY OVERVIEW 244
        1. FINANCIAL OVERVIEW 245
    80. PRODUCTS OFFERED 245
      1. KEY DEVELOPMENTS 246
        1. SWOT ANALYSIS
        2. KEY STRATEGY 247
      2. MARICO 248
        1. COMPANY OVERVIEW
        2. FINANCIAL OVERVIEW 249
        3. PRODUCTS OFFERED 249
    81. KEY DEVELOPMENTS 250
      1. SWOT ANALYSIS 250
        1. KEY STRATEGY 251
      2. PEPSICO, INC. 252
        1. COMPANY OVERVIEW 252
        2. FINANCIAL
    82. OVERVIEW 253
      1. PRODUCTS OFFERED 253
        1. KEY DEVELOPMENTS 254
        2. SWOT ANALYSIS 255
        3. KEY STRATEGY 255
      2. KELLANOVA 256
        1. COMPANY OVERVIEW 256
        2. FINANCIAL OVERVIEW 257
        3. PRODUCTS
    83. OFFERED 257
      1. KEY DEVELOPMENTS 258
        1. SWOT ANALYSIS 259
    84. KEY STRATEGY 259
      1. THE KRAFT HEINZ COMPANY 260
        1. COMPANY OVERVIEW
        2. FINANCIAL OVERVIEW 261
        3. PRODUCTS OFFERED 261
    85. KEY DEVELOPMENTS 262
      1. SWOT ANALYSIS 262
        1. KEY STRATEGY 262
      2. POST HOLDINGS, INC. 264
        1. COMPANY OVERVIEW 264
        2. FINANCIAL
    86. OVERVIEW 265
      1. PRODUCTS OFFERED 266
        1. KEY DEVELOPMENTS 266
        2. SWOT ANALYSIS 267
        3. KEY STRATEGY 267
      2. THE HAIN CELESTIAL
    87. GROUP, INC. 269
      1. COMPANY OVERVIEW 269
        1. FINANCIAL OVERVIEW
        2. PRODUCTS OFFERED 270
        3. KEY DEVELOPMENTS 271
    88. SWOT ANALYSIS 271
      1. KEY STRATEGY 271
      2. PATANJALI FOODS LTD. 273
        1. COMPANY OVERVIEW 273
        2. FINANCIAL OVERVIEW 274
        3. PRODUCTS
    89. OFFERED 274
      1. KEY DEVELOPMENTS 275
        1. SWOT ANALYSIS 275
    90. KEY STRATEGY 275
      1. FOOD FOR LIFE 277
        1. COMPANY OVERVIEW 277
        2. FINANCIAL OVERVIEW 277
        3. PRODUCTS OFFERED 278
    91. KEY DEVELOPMENTS 278
      1. KEY STRATEGY 278
      2. DATA CITATIONS 280
    92. SHARE ASSESSMENT 52
    93. (USD BILLION) 93
    94. GRAINS, 2018-2032 (USD BILLION) 96
    95. BY BAKERY PRODUCTS, 2018-2032 (USD BILLION) 96
    96. MARKET, BY BEVERAGES, 2018-2032 (USD BILLION) 97
    97. MARKET, BY EGG AND MEAT BASED PRODUCTS, 2018-2032 (USD BILLION) 98
    98. GLOBAL BREAKFAST PRODUCTS MARKET, BY PRICE RANGE, 2018-2032 (USD BILLION) 99
    99. (USD BILLION) 104
    100. 2032 (USD BILLION) 105
    101. AND PLANT-BASED, 2018-2032 (USD BILLION) 105
    102. MARKET, BY HIGH-PROTEIN / LOW-CARB, 2018-2032 (USD BILLION) 106
    103. BREAKFAST PRODUCT MARKET, BY SUGAR-FREE / LOW-SUGAR, 2018-2032 (USD BILLION) 107
    104. BILLION) 108
    105. (USD BILLION) 109
    106. 2032 (USD BILLION) 110
    107. 2032 (USD BILLION) 111
    108. 2032 (USD BILLION) 112
    109. 2032 (USD BILLION) 113
    110. 2032 (USD BILLION) 114
    111. 2032 (USD BILLION) 116
    112. 2032 (USD BILLION) 117
    113. USER, 2018-2032 (USD BILLION) 118
    114. BY RESIDENTIAL, 2018-2032 (USD BILLION) 119
    115. MARKET, BY COMMERCIAL, 2018-2032 (USD BILLION) 121
    116. PRODUCTS MARKET, BY DISTRIBUTION CHANNEL, 2018-2032 (USD BILLION) 122
    117. GLOBAL BREAKFAST PRODUCT MARKET, BY B2B, 2018-2032 (USD BILLION) 124
    118. GLOBAL BREAKFAST PRODUCT MARKET, BY B2C, 2018-2032 (USD BILLION) 126
    119. GLOBAL BREAKFAST PRODUCTS MARKET, BY PACKAGING FORMAT, 2018-2032 (USD BILLION)
    120. (USD BILLION) 129
    121. 2032 (USD BILLION) 129
    122. PACKAGING, 2018-2032 (USD BILLION) 130
    123. BY OTHERS, 2018-2032 (USD BILLION) 131
    124. BY REGION, 2018-2032 (USD BILLION) 132
    125. BY COUNTRY, 2018-2032 (USD BILLION) 135
    126. MARKET, BY TYPE, 2018-2032 (USD BILLION) 136
    127. PRODUCTS MARKET, BY PRICE RANGE, 2018-2032 (USD BILLION) 136
    128. AMERICA BREAKFAST PRODUCTS MARKET, BY CLAIM, 2018-2032 (USD BILLION) 137
    129. NORTH AMERICA BREAKFAST PRODUCTS MARKET, BY AGE GROUP, 2018-2032 (USD BILLION)
    130. (USD BILLION) 137
    131. USER, 2018-2032 (USD BILLION) 138
    132. MARKET, BY DISTRIBUTION CHANNEL, 2018-2032 (USD BILLION) 138
    133. AMERICA BREAKFAST PRODUCTS MARKET, BY PACKAGING FORMAT, 2018-2032 (USD BILLION)
    134. (USD BILLION) 141
    135. 2032 (USD BILLION) 141
    136. 2032 (USD BILLION) 142
    137. RANGE, 2018-2032 (USD BILLION) 142
    138. BY CLAIM, 2018-2032 (USD BILLION) 143
    139. BY AGE GROUP, 2018-2032 (USD BILLION) 143
    140. MARKET, BY SOURCE, 2018-2032 (USD BILLION) 143
    141. MARKET, BY END USER, 2018-2032 (USD BILLION) 144
    142. PRODUCTS MARKET, BY DISTRIBUTION CHANNEL, 2018-2032 (USD BILLION) 144
    143. CANADA BREAKFAST PRODUCTS MARKET, BY PACKAGING FORMAT, 2018-2032 (USD BILLION)
    144. BILLION) 145
    145. (USD BILLION) 146
    146. 2032 (USD BILLION) 146
    147. 2032 (USD BILLION) 146
    148. USER, 2018-2032 (USD BILLION) 147
    149. BY DISTRIBUTION CHANNEL, 2018-2032 (USD BILLION) 147
    150. PRODUCTS MARKET, BY PACKAGING FORMAT, 2018-2032 (USD BILLION) 147
    151. SOUTH AMERICA BREAKFAST PRODUCTS, BY COUNTRY, 2018-2032 (USD BILLION) 150
    152. SOUTH AMERICA BREAKFAST PRODUCTS MARKET, BY TYPE, 2018-2032 (USD BILLION) 151
    153. BILLION) 151
    154. (USD BILLION) 152
    155. GROUP, 2018-2032 (USD BILLION) 152
    156. MARKET, BY SOURCE, 2018-2032 (USD BILLION) 152
    157. PRODUCTS MARKET, BY END USER, 2018-2032 (USD BILLION) 153
    158. BREAKFAST PRODUCTS MARKET, BY DISTRIBUTION CHANNEL, 2018-2032 (USD BILLION) 153
    159. (USD BILLION) 153
    160. (USD BILLION) 154
    161. 2032 (USD BILLION) 154
    162. 2032 (USD BILLION) 155
    163. GROUP, 2018-2032 (USD BILLION) 155
    164. BY SOURCE, 2018-2032 (USD BILLION) 155
    165. BY END USER, 2018-2032 (USD BILLION) 156
    166. MARKET, BY DISTRIBUTION CHANNEL, 2018-2032 (USD BILLION) 156
    167. BREAKFAST PRODUCTS MARKET, BY PACKAGING FORMAT, 2018-2032 (USD BILLION) 156
    168. ARGENTINA BREAKFAST PRODUCTS MARKET, BY TYPE, 2018-2032 (USD BILLION) 157
    169. BILLION) 158
    170. (USD BILLION) 158
    171. 2032 (USD BILLION) 158
    172. END USER, 2018-2032 (USD BILLION) 159
    173. MARKET, BY DISTRIBUTION CHANNEL, 2018-2032 (USD BILLION) 159
    174. BREAKFAST PRODUCTS MARKET, BY PACKAGING FORMAT, 2018-2032 (USD BILLION) 159
    175. REST OF SOUTH AMERICA BREAKFAST PRODUCTS MARKET, BY TYPE, 2018-2032 (USD BILLION)
    176. 2032 (USD BILLION) 160
    177. MARKET, BY CLAIM, 2018-2032 (USD BILLION) 161
    178. BREAKFAST PRODUCTS MARKET, BY AGE GROUP, 2018-2032 (USD BILLION) 161
    179. REST OF SOUTH AMERICA BREAKFAST PRODUCTS MARKET, BY SOURCE, 2018-2032 (USD BILLION)
    180. 2032 (USD BILLION) 162
    181. MARKET, BY DISTRIBUTION CHANNEL, 2018-2032 (USD BILLION) 162
    182. OF SOUTH AMERICA BREAKFAST PRODUCTS MARKET, BY PACKAGING FORMAT, 2018-2032 (USD
    183. BILLION) 162
    184. BILLION) 165
    185. (USD BILLION) 165
    186. 2032 (USD BILLION) 166
    187. CLAIM, 2018-2032 (USD BILLION) 166
    188. BY AGE GROUP, 2018-2032 (USD BILLION) 166
    189. MARKET, BY SOURCE, 2018-2032 (USD BILLION) 167
    190. MARKET, BY END USER, 2018-2032 (USD BILLION) 167
    191. PRODUCTS MARKET, BY DISTRIBUTION CHANNEL, 2018-2032 (USD BILLION) 167
    192. EUROPE BREAKFAST PRODUCTS MARKET, BY PACKAGING FORMAT, 2018-2032 (USD BILLION)
    193. BILLION) 169
    194. BILLION) 169
    195. (USD BILLION) 169
    196. (USD BILLION) 170
    197. (USD BILLION) 170
    198. 2032 (USD BILLION) 170
    199. FORMAT, 2018-2032 (USD BILLION) 171
    200. BY TYPE, 2018-2032 (USD BILLION) 171
    201. BY PRICE RANGE, 2018-2032 (USD BILLION) 172
    202. MARKET, BY CLAIM, 2018-2032 (USD BILLION) 172
    203. MARKET, BY AGE GROUP, 2018-2032 (USD BILLION) 172
    204. PRODUCTS MARKET, BY SOURCE, 2018-2032 (USD BILLION) 173
    205. PRODUCTS MARKET, BY END USER, 2018-2032 (USD BILLION) 173
    206. BREAKFAST PRODUCTS MARKET, BY DISTRIBUTION CHANNEL, 2018-2032 (USD BILLION) 173
    207. BILLION) 174
    208. (USD BILLION) 174
    209. 2032 (USD BILLION) 175
    210. 2032 (USD BILLION) 175
    211. GROUP, 2018-2032 (USD BILLION) 175
    212. BY SOURCE, 2018-2032 (USD BILLION) 176
    213. BY END USER, 2018-2032 (USD BILLION) 176
    214. MARKET, BY DISTRIBUTION CHANNEL, 2018-2032 (USD BILLION) 176
    215. BREAKFAST PRODUCTS MARKET, BY PACKAGING FORMAT, 2018-2032 (USD BILLION) 177
    216. ITALY BREAKFAST PRODUCTS MARKET, BY TYPE, 2018-2032 (USD BILLION) 177
    217. ITALY BREAKFAST PRODUCTS MARKET, BY PRICE RANGE, 2018-2032 (USD BILLION) 178
    218. BILLION) 179
    219. 2032 (USD BILLION) 179
    220. FORMAT, 2018-2032 (USD BILLION) 180
    221. BY TYPE, 2018-2032 (USD BILLION) 180
    222. BY PRICE RANGE, 2018-2032 (USD BILLION) 181
    223. MARKET, BY CLAIM, 2018-2032 (USD BILLION) 181
    224. MARKET, BY AGE GROUP, 2018-2032 (USD BILLION) 181
    225. PRODUCTS MARKET, BY SOURCE, 2018-2032 (USD BILLION) 182
    226. PRODUCTS MARKET, BY END USER, 2018-2032 (USD BILLION) 182
    227. BREAKFAST PRODUCTS MARKET, BY DISTRIBUTION CHANNEL, 2018-2032 (USD BILLION) 182
    228. BILLION) 183
    229. (USD BILLION) 183
    230. 2032 (USD BILLION) 184
    231. CLAIM, 2018-2032 (USD BILLION) 184
    232. BY AGE GROUP, 2018-2032 (USD BILLION) 184
    233. MARKET, BY SOURCE, 2018-2032 (USD BILLION) 185
    234. MARKET, BY END USER, 2018-2032 (USD BILLION) 185
    235. PRODUCTS MARKET, BY DISTRIBUTION CHANNEL, 2018-2032 (USD BILLION) 185
    236. RUSSIA BREAKFAST PRODUCTS MARKET, BY PACKAGING FORMAT, 2018-2032 (USD BILLION)
    237. (USD BILLION) 186
    238. RANGE, 2018-2032 (USD BILLION) 187
    239. MARKET, BY CLAIM, 2018-2032 (USD BILLION) 187
    240. PRODUCTS MARKET, BY AGE GROUP, 2018-2032 (USD BILLION) 187
    241. EUROPE BREAKFAST PRODUCTS MARKET, BY SOURCE, 2018-2032 (USD BILLION) 188
    242. REST OF EUROPE BREAKFAST PRODUCTS MARKET, BY END USER, 2018-2032 (USD BILLION)
    243. 2032 (USD BILLION) 188
    244. BY PACKAGING FORMAT, 2018-2032 (USD BILLION) 189
    245. PRODUCTS, BY COUNTRY, 2018-2032 (USD BILLION) 192
    246. PRODUCTS MARKET, BY TYPE, 2018-2032 (USD BILLION) 193
    247. BREAKFAST PRODUCTS MARKET, BY PRICE RANGE, 2018-2032 (USD BILLION) 193
    248. ASIA-PACIFIC BREAKFAST PRODUCTS MARKET, BY CLAIM, 2018-2032 (USD BILLION) 194
    249. BILLION) 194
    250. (USD BILLION) 194
    251. USER, 2018-2032 (USD BILLION) 195
    252. MARKET, BY DISTRIBUTION CHANNEL, 2018-2032 (USD BILLION) 195
    253. BREAKFAST PRODUCTS MARKET, BY PACKAGING FORMAT, 2018-2032 (USD BILLION) 195
    254. CHINA BREAKFAST PRODUCTS MARKET, BY TYPE, 2018-2032 (USD BILLION) 196
    255. CHINA BREAKFAST PRODUCTS MARKET, BY PRICE RANGE, 2018-2032 (USD BILLION) 196
    256. BILLION) 198
    257. 2032 (USD BILLION) 198
    258. FORMAT, 2018-2032 (USD BILLION) 198
    259. BY TYPE, 2018-2032 (USD BILLION) 199
    260. BY PRICE RANGE, 2018-2032 (USD BILLION) 199
    261. MARKET, BY CLAIM, 2018-2032 (USD BILLION) 200
    262. MARKET, BY AGE GROUP, 2018-2032 (USD BILLION) 200
    263. PRODUCTS MARKET, BY SOURCE, 2018-2032 (USD BILLION) 200
    264. PRODUCTS MARKET, BY END USER, 2018-2032 (USD BILLION) 201
    265. PRODUCTS MARKET, BY DISTRIBUTION CHANNEL, 2018-2032 (USD BILLION) 201
    266. INDIA BREAKFAST PRODUCTS MARKET, BY PACKAGING FORMAT, 2018-2032 (USD BILLION)
    267. BILLION) 202
    268. (USD BILLION) 203
    269. 2032 (USD BILLION) 203
    270. 2032 (USD BILLION) 203
    271. USER, 2018-2032 (USD BILLION) 204
    272. BY DISTRIBUTION CHANNEL, 2018-2032 (USD BILLION) 204
    273. PRODUCTS MARKET, BY PACKAGING FORMAT, 2018-2032 (USD BILLION) 204
    274. SOUTH KOREA BREAKFAST PRODUCTS MARKET, BY TYPE, 2018-2032 (USD BILLION) 205
    275. SOUTH KOREA BREAKFAST PRODUCTS MARKET, BY PRICE RANGE, 2018-2032 (USD BILLION)
    276. BILLION) 206
    277. 2032 (USD BILLION) 206
    278. BY SOURCE, 2018-2032 (USD BILLION) 206
    279. MARKET, BY END USER, 2018-2032 (USD BILLION) 207
    280. PRODUCTS MARKET, BY DISTRIBUTION CHANNEL, 2018-2032 (USD BILLION) 207
    281. SOUTH KOREA BREAKFAST PRODUCTS MARKET, BY PACKAGING FORMAT, 2018-2032 (USD BILLION)
    282. 2032 (USD BILLION) 208
    283. PRODUCTS MARKET, BY PRICE RANGE, 2018-2032 (USD BILLION) 208
    284. & NEW ZEALAND BREAKFAST PRODUCTS MARKET, BY CLAIM, 2018-2032 (USD BILLION) 209
    285. 2032 (USD BILLION) 209
    286. PRODUCTS MARKET, BY SOURCE, 2018-2032 (USD BILLION) 209
    287. & NEW ZEALAND BREAKFAST PRODUCTS MARKET, BY END USER, 2018-2032 (USD BILLION)
    288. CHANNEL, 2018-2032 (USD BILLION) 210
    289. BREAKFAST PRODUCTS MARKET, BY PACKAGING FORMAT, 2018-2032 (USD BILLION) 210
    290. REST OF ASIA-PACIFIC BREAKFAST PRODUCTS MARKET, BY TYPE, 2018-2032 (USD BILLION)
    291. 2032 (USD BILLION) 211
    292. MARKET, BY CLAIM, 2018-2032 (USD BILLION) 212
    293. BREAKFAST PRODUCTS MARKET, BY AGE GROUP, 2018-2032 (USD BILLION) 212
    294. REST OF ASIA-PACIFIC BREAKFAST PRODUCTS MARKET, BY SOURCE, 2018-2032 (USD BILLION)
    295. 2032 (USD BILLION) 213
    296. MARKET, BY DISTRIBUTION CHANNEL, 2018-2032 (USD BILLION) 213
    297. OF ASIA-PACIFIC BREAKFAST PRODUCTS MARKET, BY PACKAGING FORMAT, 2018-2032 (USD BILLION)
    298. (USD BILLION) 216
    299. BY TYPE, 2018-2032 (USD BILLION) 217
    300. PRODUCTS MARKET, BY PRICE RANGE, 2018-2032 (USD BILLION) 217
    301. EAST & AFRICA BREAKFAST PRODUCTS MARKET, BY CLAIM, 2018-2032 (USD BILLION) 218
    302. (USD BILLION) 218
    303. BY SOURCE, 2018-2032 (USD BILLION) 218
    304. PRODUCTS MARKET, BY END USER, 2018-2032 (USD BILLION) 219
    305. EAST & AFRICA BREAKFAST PRODUCTS MARKET, BY DISTRIBUTION CHANNEL, 2018-2032
    306. (USD BILLION) 219
    307. BY PACKAGING FORMAT, 2018-2032 (USD BILLION) 219
    308. MARKET, BY TYPE, 2018-2032 (USD BILLION) 220
    309. MARKET, BY PRICE RANGE, 2018-2032 (USD BILLION) 220
    310. PRODUCTS MARKET, BY CLAIM, 2018-2032 (USD BILLION) 221
    311. PRODUCTS MARKET, BY AGE GROUP, 2018-2032 (USD BILLION) 221
    312. PRODUCTS MARKET, BY SOURCE, 2018-2032 (USD BILLION) 221
    313. PRODUCTS MARKET, BY END USER, 2018-2032 (USD BILLION) 222
    314. PRODUCTS MARKET, BY DISTRIBUTION CHANNEL, 2018-2032 (USD BILLION) 222
    315. GCC BREAKFAST PRODUCTS MARKET, BY PACKAGING FORMAT, 2018-2032 (USD BILLION)

    Breakfast Products Market Segmentation

    Market Segmentation Overview

    • Detailed segmentation data will be available in the full report
    • Comprehensive analysis by multiple parameters
    • Regional and country-level breakdowns
    • Market size forecasts by segment
    Report Infographic
    Free Sample Request

    Kindly complete the form below to receive a free sample of this Report

    Customer Strories

    “I am very pleased with how market segments have been defined in a relevant way for my purposes (such as "Portable Freezers & refrigerators" and "last-mile"). In general the report is well structured. Thanks very much for your efforts.”

    Victoria Milne Founder
    Case Study

    Chemicals and Materials