• Cat-intel
  • MedIntelliX
  • Resources
  • About Us
  • Hero Background
    English
    Chinese
    French
    Japanese
    Korean
    German
    Spanish

    Applied AI in Energy & Utilities Market Size

    ID: MRFR/ICT/10653-HCR
    215 Pages
    Aarti Dhapte
    October 2025

    Applied AI in Energy & Utilities Market Research Report: Information By Deployment Type (On-Premises and Cloud), By Application (Robotics, Renewables Management, Demand Forecasting, AI-Based Inventory Management, Energy Production and Scheduling, Asset Tracking and Maintenance, Digital Twins, AI-Based Cybersecurity, Emission Tracking, Logistics Network Optimizations, and Others), By End Us...

    Share:
    Download PDF ×

    We do not share your information with anyone. However, we may send you emails based on your report interest from time to time. You may contact us at any time to opt-out.

    Applied AI in Energy & Utilities Market Infographic
    $ 4,950.0
    $ 5,950.0
    $ 7,250.0

    Applied Ai In Energy Utilities Size

    Applied AI in Energy & Utilities Market Growth Projections and Opportunities

    Efficiency as well as sustainability quests and assimilation of intelligent technologies are some of the motives that make applied AI market dynamics in energy and utilities become dynamic. Energy optimization, predictive maintenance, grid management and asset monitoring are a few examples of the plethora of applications included in this domain. Over time, several key drivers have continually evolved making this market very dynamic and reflecting the sector’s ability to innovate as well as endure change brought about by shifting energy landscapes and environmental pressures. Another driver shaping the market dynamics of Applied AI in Energy & Utilities is the urgent need for enhanced operational efficiency and better asset management. By analyzing data coming from a lot of sensors, devices or even infrastructure, artificial intelligence applications can be used to predict equipment failures; optimize maintenance schedules; improve overall performance through operating procedures enhancement. The power to spot anomalies using AI helps future glitches before they happen resulting to reduced downtimes, minimized operation costs, extended life periods for vital assets. A quest for operational excellence is one factor driving up adoption rates of Artificial Intelligence across energy production and distribution companies.

    However, smart grids’ development alongside renewable energy incorporation significantly affects the applied ai in energy & utilities market dynamics. In an effort to optimize how electricity is produced distributed and consumed considering growing integration of solar wind among other sources onto the power grid AI techs play central roles here being deployed.. Smart grids use AI solutions to cope with renewable energy fluctuation levels while balancing demand and supply as well as improving grid reliability. This brings about adaptive/ responsive forms of energy systems which can handle intermittent decentralized renewables.

    On the other hand, sustainable operations requirements also impact significantly on applied ai in energy & utilities’ market dynamics. It results into initiatives related to saving on energy use , reducing carbon footprints , optimizing resource usage etc within various industries being geared towards causing changes that enhance both internal responsiveness but also maintain competitiveness within their business ecosystems at large . Machine learning algorithms sift historical plus real-time data to single out areas where energy can be saved, emissions cut and sustainable practices adopted. These are just some of the reasons for incorporating AI-centered solutions as part of the industry’s strategy to mitigate climate change and deliver greener energy supplies.
    Applied AI in Energy & Utilities Market Size Graph

    Market Summary

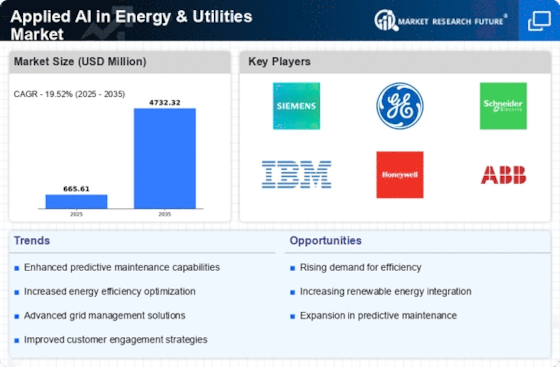
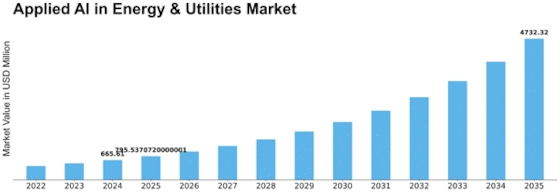
    The Global Applied AI in Energy and Utilities Market is projected to experience substantial growth from 665.61 USD Million in 2024 to 4732.32 USD Million by 2035.

    Key Market Trends & Highlights

    Applied AI in Energy & Utilities Key Trends and Highlights

    • The market is expected to grow at a compound annual growth rate (CAGR) of 19.52% from 2025 to 2035.
    • By 2035, the market valuation is anticipated to reach 4732.3 USD Million, indicating a robust expansion.
    • in 2024, the market is valued at 665.61 USD Million, reflecting the current investment landscape in applied AI technologies.
    • Growing adoption of AI technologies due to the increasing demand for operational efficiency is a major market driver.

    Market Size & Forecast

    2024 Market Size 665.61 (USD Million)
    2035 Market Size 4732.32 (USD Million)
    CAGR (2025-2035) 19.52%
    Largest Regional Market Share in 2024 latin_america)

    Major Players

    AAIC, AltaML Inc., ATOS SE, CEZ Group, Google, IBM, Microsoft Corporation, MindTitan, Nvidia, SmatCloud Inc., Utility Dive

    Market Trends

    The integration of artificial intelligence in energy management systems is poised to enhance operational efficiency and sustainability across the utilities sector, as indicated by ongoing governmental initiatives to promote smart grid technologies.

    U.S. Department of Energy

    Applied AI in Energy & Utilities Market Market Drivers

    Advancements in AI Technology

    Technological advancements in AI are significantly influencing the Global Applied AI in Energy and Utilities Market Industry. Innovations such as machine learning, deep learning, and natural language processing are being harnessed to develop sophisticated energy management systems. These technologies enable utilities to analyze vast datasets, predict energy demand, and optimize resource allocation. For example, AI-driven predictive analytics can forecast energy consumption patterns, allowing for better grid management. As these technologies continue to evolve, they are expected to drive substantial growth in the market, with a projected increase from 665.6 USD Million in 2024 to 4732.3 USD Million by 2035.

    Enhanced Operational Efficiency

    Operational efficiency remains a critical driver in the Global Applied AI in Energy and Utilities Market Industry. AI applications are increasingly employed to streamline operations, reduce downtime, and enhance predictive maintenance. For example, utilities are leveraging AI algorithms to analyze data from smart meters and sensors, enabling real-time monitoring and decision-making. This proactive approach not only minimizes operational costs but also improves service reliability. As organizations continue to adopt these technologies, the market is anticipated to grow at a CAGR of 19.52% from 2025 to 2035, reflecting the increasing reliance on AI for operational excellence.

    Regulatory Support and Incentives

    Regulatory frameworks play a pivotal role in shaping the Global Applied AI in Energy and Utilities Market Industry. Governments are increasingly implementing policies and incentives to promote the adoption of AI technologies in energy management. These regulations often focus on sustainability and efficiency, encouraging utilities to invest in AI-driven solutions. For instance, various countries offer tax incentives for companies that integrate AI into their operations, thereby fostering innovation. This supportive regulatory environment is likely to propel market growth, as organizations seek to align with governmental objectives while enhancing their operational capabilities.

    Consumer Engagement and Smart Grids

    The rise of consumer engagement through smart grids is a notable driver in the Global Applied AI in Energy and Utilities Market Industry. Smart grids facilitate two-way communication between utilities and consumers, enabling more efficient energy usage. AI technologies are employed to analyze consumer behavior and preferences, allowing utilities to tailor services and improve customer satisfaction. For instance, AI can predict peak usage times and suggest energy-saving measures to consumers. This enhanced engagement not only benefits consumers but also supports utilities in managing demand effectively, contributing to the overall growth of the market.

    Growing Demand for Renewable Energy

    The Global Applied AI in Energy and Utilities Market Industry is witnessing a surge in demand for renewable energy sources, driven by global initiatives to reduce carbon emissions. Governments worldwide are setting ambitious targets for renewable energy adoption, which necessitates advanced AI solutions for efficient energy management. For instance, AI technologies are being utilized to optimize the integration of solar and wind energy into existing grids, enhancing reliability and reducing costs. This shift is expected to contribute significantly to the market, with projections indicating a market value of 665.6 USD Million in 2024, escalating to 4732.3 USD Million by 2035.

    Market Segment Insights

    Global Applied AI in Energy & Utilities Market- Segment Insights

    The global applied AI in energy & utilities market, in this report, has been segmented on the basis of deployment type into on-premises and cloud.

    The energy and utilities sector are increasingly supporting cloud deployment for its growing implementation of AI technologies. This shift is due to the expanding industrial use of AI for tasks such as grid optimization and resource management demands significant computational power, which cloud platforms can offer without the need for substantial upfront investments in hardware.

    Further, the real-time data processing and analytics requirements of the energy sector align perfectly with the capabilities of cloud infrastructure. Cloud services provide high availability and rapid data processing, which are essential for functions like grid monitoring, predictive maintenance, and demand forecasting.

    Moreover, cloud-based AI solutions enable seamless collaboration and remote access, allowing experts to analyze data and make informed decisions from anywhere. This feature is especially beneficial for an industry with dispersed assets and remote monitoring needs.

    FIGURE 2: GLOBAL APPLIED AI IN ENERGY & UTILITIES MARKET, BY DEPLOYMENT TYPE, 2022 VS 2032 (USD MILLION)

    Get more detailed insights about Applied AI in Energy & Utilities Market Research Report - Forecast till 2034

    Regional Insights

    Based on Region, the global applied AI in energy & utilities is segmented into North America, Europe, Asia-Pacific, Middle East & Africa, and South America. Further, the major countries studied in the market report are the U.S., Canada, Germany, UK, Italy, Spain, China, Japan, India, Australia, UAE, and Brazil. North America holds a prominent share in the market and Asia-Pacific is likely to account for a massive growth during the forecast period in the market.

    The North American energy and utilities market is undergoing a significant transformation due to a surge in investments in renewable energy technologies, particularly in the United States. In 2022, these investments reached a staggering US$ 32.3 billion, showcasing a remarkable increase from US$ 29.1 billion in 2013. This growth is driven by green stimulus programs and tax credits that promote renewable energy projects, making it a hotspot for innovation and technological advancements. Notably, the Inflation Reduction Act has allocated US$ 160 billion in tax credits for renewable energy companies, further incentivizing the adoption of clean energy solutions.

    Consequently, the demand for applied AI in the energy and utilities sector is poised for substantial growth. AI's potential lies in optimizing energy production and grid management, enhancing the efficiency and reliability of renewable energy sources, and addressing the intermittency challenges associated with solar and wind power.

    FIGURE 3: APPLIED AI IN ENERGY & UTILITIES MARKET SIZE BY REGION 2022 VS 2032, (USD MILLION)

    APPLIED AI IN ENERGY & UTILITIES MARKET SIZE BY REGION 2022 VS 2032

    Source: Secondary Research, Primary Research, Market Research Future Database, and Analyst Review

    Furthermore, the launch of a US$ 500 million fund by Itochu and Sumitomo Mitsui Trust Bank for renewable energy projects in North America underscores the commitment to expanding the renewable energy sector. This fund will invest in various renewable energy projects, including solar, wind, hydrogen, and ammonia-based solutions.

    Canada is also actively advancing its renewable energy initiatives, with plans to reduce greenhouse gas emissions and achieve a net-zero grid by 2035. Federal funding programs like the Smart Renewables and Electrification Pathways program are providing substantial support for renewable energy and electrical grid modernization projects. This support not only reduces greenhouse gas emissions but also strengthens Canada's transition to a net-zero economy by 2050. Investments from various sources, including the government and industry players, are contributing to the growth of renewable energy in Canada.

    In conclusion, the synergy of increasing investments and government incentives positions North America as a thriving hub for AI-driven innovations in the energy and utilities sector, ultimately driving the market growth.

    Key Players and Competitive Insights

    Prominent market players in the applied AI in energy and utilities sector employ a range of growth strategies to remain competitive. They are heavily investing in research and development to continuously enhance their AI solutions, focusing on predictive maintenance, smart grid management, and energy-efficient technologies. Additionally, strategic partnerships are a key component of their growth strategy, allowing them to expand their market reach, access new segments, and foster data sharing collaborations.

    The market players are also prioritizing customization and scalability of their offerings, ensuring that their AI solutions can adapt to diverse infrastructures and customer needs. By maintaining a strong focus on data security, compliance, customer-centricity, and global expansion, these companies effectively navigate the evolving landscape of the energy and utilities industry while staying ahead of the competition.

    Key Companies in the Applied AI in Energy & Utilities Market market include

    Industry Developments

    Future Outlook

    Applied AI in Energy & Utilities Market Future Outlook

    The Applied AI in Energy & Utilities Market is projected to grow at a 19.52% CAGR from 2025 to 2035, driven by advancements in predictive analytics, smart grid technologies, and regulatory support.

    New opportunities lie in:

    • Develop AI-driven demand response solutions to optimize energy consumption.
    • Implement predictive maintenance systems for utility infrastructure to reduce downtime.
    • Leverage AI for real-time energy management in renewable energy integration.

    By 2035, the market is expected to be robust, characterized by innovative AI applications and enhanced operational efficiencies.

    Market Segmentation

    Applied AI in Energy & Utilities Market- End User Outlook

    • Energy Transmission
    • Energy Generation
    • Energy Distribution
    • Utilities
    • Wind Farms
    • Others

    Applied AI in Energy & Utilities Market- Regional Outlook

    • US
    • Canada
    • Mexico

    Applied AI in Energy & Utilities Market- Application Outlook

    • Robotics
    • Renewables Management
    • Demand Forecasting
    • Ai-Based Inventory Management
    • Energy Production and Scheduling
    • Asset Tracking and Maintenance
    • Digital Twins
    • AI-Based Cybersecurity
    • Emission Tracking
    • Logistics Network Optimizations
    • Others

    Applied AI in Energy & Utilities Market- Deployment Type Outlook

    • On Premises
    • Cloud

    Report Scope

    Report Attribute/Metric Details
    Market Size 2024 665.60 (USD Million)
    Market Size 2025 795.53 (USD Million)
    Market Size 2035 4732.32 (USD Million)
    Compound Annual Growth Rate (CAGR) 19.52% (2025 - 2035)
    Report Coverage Revenue Forecast, Competitive Landscape, Growth Factors, and Trends
    Base Year 2024
    Market Forecast Period 2025 - 2035
    Historical Data 2019 - 2023
    Market Forecast Units USD Million
    Segments Covered Deployment Type, Application, and End User
    Geographies Covered Europe, North America, Asia-Pacific, Middle East & Africa, and South America
    Countries Covered US, Canada, Mexico, Germany, France, UK, Italy, Spain, China, Japan, India, South Korea, Australia, Saudi Arabia, UAE, South Africa, Brazil, Argentina, Chile, and others.
    Key Companies Profiled AAIC, AltaML Inc., ATOS SE, CEZ Group, Google, IBM, Microsoft Corporation, MindTitan, Nvidia, SmatCloud Inc., and Utility Dive
    Key Market Opportunities Microgrid Expansion Creates AI Optimization Prospects Smart Cities Emerge With AI-Enhanced Energy Management
    Key Market Dynamics Smart Demand-Side Management Powered by AI Analytics Data Abundance Fuels Utility Sector AI Advancements

    Market Highlights

    Author

    Aarti Dhapte
    Team Lead - Research

    She holds an experience of about 6+ years in market research and business consulting, working under the spectrum of information communication technology, telecommunications and semiconductor domains. aarti conceptualizes and implements a scalable business strategy and provides strategic leadership to the clients. her expertise lies in market estimation, competitive intelligence, pipeline analysis, customer assessment, etc.

    Leave a Comment

    Latest Comments

    John Doe
    john@example.com

    This is a great article! Really helped me understand the topic better.

    Posted on July 23, 2025, 10:15 AM
    Jane Smith
    jane@domain.com

    Thanks for sharing this. I’ve bookmarked it for later reference.

    Posted on July 22, 2025, 7:45 PM

    FAQs

    How much is the Applied AI in Energy & Utilities market?

    The Applied AI in Energy & Utilities Market was valued at USD 665.6 million in 2024.

    What is the growth rate of the Applied AI in Energy & Utilities market?

    The global market is projected to grow at a CAGR of 19.52% during the forecast period, 2025-2034.

    Which region held the largest market share in the Applied AI in Energy & Utilities market?

    North America had the largest share of the global market.

    Who are the key players in the Applied AI in Energy & Utilities market?

    The key players in the market are AAIC, AltaML Inc., ATOS SE, CEZ Group, Google, IBM, Microsoft Corporation, MindTitan, Nvidia, SmatCloud Inc., and Utility Dive.

    1. EXECUTIVE SUMMARY
      1. Market Attractiveness Analysis
        1. Global APPLIED AI IN ENERGY & UTILITES Market, by Deployment Type
        2. Global APPLIED AI IN ENERGY & UTILITES Market, by Application
      2. 1.1.3.
    2. Global APPLIED AI IN ENERGY & UTILITES Market, by End User
    3. Global
    4. APPLIED AI IN ENERGY & UTILITES Market, by Region
    5. MARKET INTRODUCTION
      1. Definition
      2. Scope of the Study
      3. Market Structure
      4. 2.4.
      5. Key Buying Criteria
      6. Macro Factor Indicator Analysis
    6. RESEARCH METHODOLOGY
      1. Research Process
      2. Primary Research
      3. Secondary Research
      4. Market Size Estimation
      5. Forecast Model
      6. List of Assumptions
    7. MARKET DYNAMICS
      1. Introduction
      2. Drivers
        1. Energy
        2. Renewable Energy
      3. Efficiency Enhancement Through Applied AI Solutions
      4. Integration Drives AI Adoption in Utilities
      5. Restraints
        1. Initial
        2. Talent Shortage Hinders
      6. Costs Pose Barrier to Widespread AI Adoption
      7. AI Progress in Utility Industry
      8. Opportunities
        1. Microgrid
        2. Smart Cities Emerge With
      9. Expansion Creates AI Optimization Prospects
      10. AI-Enhanced Energy Management
      11. Covid-19 Impact Analysis
        1. Impact
        2. Impact on Applied AI in Energy &
        3. YOY growth 2020-2022
      12. on Energy & Utilities Industry
      13. Utilities Market
    8. COVID-19 IMPACT ON SUPPLY
    9. CHAIN MARKET FACTOR ANALYSIS
      1. Value Chain Analysis/Supply Chain Analysis
      2. Porter’s Five Forces Model
        1. Bargaining Power of Suppliers
        2. Bargaining Power of Buyers
        3. Threat of New Entrants
        4. Intensity of Rivalry
      3. 5.2.4.
      4. Threat of Substitutes
      5. Market SWOT Analysis
      6. Market PESTEL Analysis
      7. Regulatory Framework
      8. Case Study
    10. GLOBAL APPLIED AI IN ENERGY & UTILITES MARKET, BY DEPLOYMENT TYPE
      1. 6.1.
      2. Introduction
      3. On-Premises
      4. Cloud
    11. GLOBAL APPLIED AI IN
    12. ENERGY & UTILITES MARKET, BY APPLICATION
      1. Introduction
      2. Robotics
      3. Renewables Management
      4. Demand Forecasting
      5. Ai-Based Inventory
      6. Management
      7. Energy Production and Scheduling
      8. Asset Tracking and
      9. Maintenance
      10. Digital Twins
      11. Ai-Based Cybersecurity
      12. 7.10.
      13. Emission Tracking
      14. Logistics Network Optimizations
      15. Others
    13. GLOBAL APPLIED AI IN ENERGY & UTILITES MARKET, BY END USER
      1. Introduction
      2. Energy Transmission
      3. Energy Generation
      4. Energy Distribution
      5. Utilities
      6. Wind Farms
      7. Others
    14. GLOBAL APPLIED
    15. AI IN ENERGY & UTILITES MARKET SIZE ESTIMATION & FORECAST, BY REGION
      1. Introduction
      2. North America
        1. Market Estimates &
        2. Market Estimates & Forecast, by
        3. Market Estimates & Forecast, by Application,
        4. Market Estimates & Forecast, by End User, 2019-2032
        5. US
      3. Forecast, by Country, 2019-2032
      4. Deployment Type, 2019-2032
      5. 9.2.5.3.
    16. Market Estimates & Forecast, by End User, 2019-2032
      1. 9.2.5.4.
      2. 9.2.6.
      3. Canada
      4. 9.2.6.3.
    17. Market Estimates & Forecast, by Deployment Type, 2019-2032
    18. Market Estimates & Forecast, by Application, 2019-2032
    19. Market Estimates & Forecast, by End User, 2019-2032
      1. 9.2.7.1.
    20. Mexico
    21. Market Estimates & Forecast, by Deployment Type, 2019-2032
      1. Estimates & Forecast, by Application, 2019-2032
      2. & Forecast, by End User, 2019-2032
      3. & Forecast, by Country, 2019-2032
      4. by Deployment Type, 2019-2032
      5. 9.3.5.3.
    22. Market
    23. Market Estimates
      1. Europe
        1. Market Estimates
        2. Market Estimates & Forecast,
        3. Market Estimates & Forecast, by Application,
        4. Market Estimates & Forecast, by End User, 2019-2032
        5. UK
    24. Market Estimates & Forecast, by End User, 2019-2032
      1. 9.3.6.1.
    25. Germany
    26. Market Estimates & Forecast, by Deployment Type, 2019-2032
      1. Estimates & Forecast, by Application, 2019-2032
      2. & Forecast, by End User, 2019-2032
      3. & Forecast, by Deployment Type, 2019-2032
      4. Forecast, by Application, 2019-2032
      5. by End User, 2019-2032
      6. by Deployment Type, 2019-2032
      7. Application, 2019-2032
      8. Type, 2019-2032
      9. 9.3.10.
      10. Rest of Europe
      11. Estimates & Forecast, by Deployment Type, 2019-2032
      12. & Forecast, by Application, 2019-2032
      13. by End User, 2019-2032
      14. by Deployment Type, 2019-2032
      15. Application, 2019-2032
      16. Type, 2019-2032
      17. 9.4.7.2.
    27. Market
    28. Market Estimates
    29. France
    30. Market Estimates
    31. Market Estimates &
    32. Market Estimates & Forecast,
    33. Italy
    34. Market Estimates & Forecast,
    35. Market Estimates & Forecast, by
    36. Market Estimates & Forecast, by End User,
    37. Spain
    38. Market Estimates & Forecast, by Deployment
    39. Market Estimates & Forecast, by Application, 2019-2032
    40. Market Estimates & Forecast, by End User, 2019-2032
    41. Market Estimates & Forecast, by Deployment Type,
    42. Market Estimates & Forecast, by Application, 2019-2032
    43. Market Estimates & Forecast, by End User, 2019-2032
      1. Asia-Pacific
        1. Market Estimates & Forecast, by Country, 2019-2032
        2. Market
        3. Market Estimates
        4. Market Estimates & Forecast,
        5. China
        6. Japan
        7. India
    44. Market Estimates & Forecast, by Application, 2019-2032
      1. Estimates & Forecast, by End User, 2019-2032
      2. 9.4.8.1.
    45. Market
    46. South Korea
    47. Market Estimates & Forecast, by Deployment Type, 2019-2032
      1. Estimates & Forecast, by Application, 2019-2032
      2. & Forecast, by End User, 2019-2032
      3. 9.4.9.1.
    48. Market
    49. Market Estimates
    50. Rest of Asia-Pacific
    51. Market Estimates & Forecast, by Deployment Type, 2019-2032
      1. Estimates & Forecast, by Application, 2019-2032
      2. & Forecast, by End User, 2019-2032
      3. Estimates & Forecast, by Deployment Type, 2019-2032
      4. & Forecast, by Application, 2019-2032
      5. by End User, 2019-2032
      6. Forecast, by Deployment Type, 2019-2032
      7. by Application, 2019-2032
      8. User, 2019-2032
      9. by Deployment Type, 2019-2032
      10. Application, 2019-2032
      11. by Deployment Type, 2019-2032
      12. Application, 2019-2032
    52. Market
    53. Market Estimates
      1. Rest of the World
        1. Market
        2. Market Estimates
        3. Market Estimates & Forecast,
        4. Middle East
        5. Africa
        6. Latin America
    54. COMPETITIVE LANDSCAPE
      1. Introduction
      2. Key
      3. Developments & Growth Strategies
      4. Competitor Benchmarking
      5. 10.4.
      6. Vendor Share Analysis, 2022(% Share)
    55. COMPANY PROFILES
      1. AAIC
        1. Company Overview
        2. Financial Overview
        3. Solutions/Services
        4. Key Market Developments
        5. SWOT Analysis
      2. Offerred
      3. 11.1.6.
      4. Key Strategies
      5. AltaML Inc.
      6. ATOS SE
      7. IBM Corporation
      8. CEZ Group
      9. Google
      10. Microsoft Corporation
      11. 11.8.
      12. MindTitan
      13. SmatCloud Inc.
      14. NVIDIA Corporation
      15. Utility
      16. Dive
    56. LIST OF TABLES
    57. MARKET SYNOPSIS
    58. GLOBAL
    59. APPLIED AI IN ENERGY & UTILITES MARKET, BY DEPLOYMENT TYPE, 2019-2032 (USD MILLION)
    60. GLOBAL APPLIED AI IN ENERGY & UTILITES MARKET, BY APPLICATION, 2019-2032
      1. (USD MILLION)
    61. GLOBAL APPLIED AI IN ENERGY & UTILITES MARKET, BY
      1. END USER, 2019-2032 (USD MILLION)
    62. GLOBAL APPLIED AI IN ENERGY &
    63. UTILITES MARKET, BY REGION, 2019-2032 (USD MILLION)
    64. NORTH AMERICA APPLIED
    65. AI IN ENERGY & UTILITES MARKET, BY COUNTRY, 2019-2032 (USD MILLION)
      1. TABLE
    66. NORTH AMERICA APPLIED AI IN ENERGY & UTILITES MARKET, BY DEPLOYMENT TYPE,
    67. NORTH AMERICA APPLIED AI IN ENERGY & UTILITES
    68. MARKET, BY APPLICATION, 2019-2032 (USD MILLION)
    69. NORTH AMERICA APPLIED
    70. AI IN ENERGY & UTILITES MARKET, BY END USER, 2019-2032 (USD MILLION)
      1. TABLE
    71. US APPLIED AI IN ENERGY & UTILITES MARKET, BY DEPLOYMENT TYPE, 2019-2032
      1. (USD MILLION)
    72. US APPLIED AI IN ENERGY & UTILITES MARKET, BY APPLICATION,
    73. US APPLIED AI IN ENERGY & UTILITES MARKET,
      1. BY END USER, 2019-2032 (USD MILLION)
    74. CANADA APPLIED AI IN ENERGY &
    75. UTILITES MARKET, BY DEPLOYMENT TYPE, 2019-2032 (USD MILLION)
    76. CANADA
    77. APPLIED AI IN ENERGY & UTILITES MARKET, BY APPLICATION, 2019-2032 (USD MILLION)
    78. CANADA APPLIED AI IN ENERGY & UTILITES MARKET, BY END USER, 2019-2032
      1. (USD MILLION)
    79. MEXICO APPLIED AI IN ENERGY & UTILITES MARKET, BY
      1. DEPLOYMENT TYPE, 2019-2032 (USD MILLION)
    80. MEXICO APPLIED AI IN ENERGY
    81. & UTILITES MARKET, BY APPLICATION, 2019-2032 (USD MILLION)
    82. MEXICO
    83. APPLIED AI IN ENERGY & UTILITES MARKET, BY END USER, 2019-2032 (USD MILLION)
    84. EUROPE APPLIED AI IN ENERGY & UTILITES MARKET, BY COUNTRY, 2019-2032
      1. (USD MILLION)
    85. EUROPE APPLIED AI IN ENERGY & UTILITES MARKET, BY
      1. DEPLOYMENT TYPE, 2019-2032 (USD MILLION)
    86. EUROPE APPLIED AI IN ENERGY
    87. & UTILITES MARKET, BY APPLICATION, 2019-2032 (USD MILLION)
    88. EUROPE
    89. APPLIED AI IN ENERGY & UTILITES MARKET, BY END USER, 2019-2032 (USD MILLION)
    90. UK APPLIED AI IN ENERGY & UTILITES MARKET, BY DEPLOYMENT TYPE, 2019-2032
      1. (USD MILLION)
    91. UK APPLIED AI IN ENERGY & UTILITES MARKET, BY APPLICATION,
    92. UK APPLIED AI IN ENERGY & UTILITES MARKET,
      1. BY END USER, 2019-2032 (USD MILLION)
    93. GERMANY APPLIED AI IN ENERGY
    94. & UTILITES MARKET, BY DEPLOYMENT TYPE, 2019-2032 (USD MILLION)
      1. TABLE 27
    95. GERMANY APPLIED AI IN ENERGY & UTILITES MARKET, BY APPLICATION, 2019-2032 (USD
      1. MILLION)
    96. GERMANY APPLIED AI IN ENERGY & UTILITES MARKET, BY END
      1. USER, 2019-2032 (USD MILLION)
    97. FRANCE APPLIED AI IN ENERGY & UTILITES
    98. MARKET, BY DEPLOYMENT TYPE, 2019-2032 (USD MILLION)
    99. FRANCE APPLIED
    100. AI IN ENERGY & UTILITES MARKET, BY APPLICATION, 2019-2032 (USD MILLION)
      1. TABLE
    101. FRANCE APPLIED AI IN ENERGY & UTILITES MARKET, BY END USER, 2019-2032 (USD
      1. MILLION)
    102. SPAIN APPLIED AI IN ENERGY & UTILITES MARKET, BY DEPLOYMENT
      1. TYPE, 2019-2032 (USD MILLION)
    103. SPAIN APPLIED AI IN ENERGY & UTILITES
    104. MARKET, BY APPLICATION, 2019-2032 (USD MILLION)
    105. SPAIN APPLIED AI IN
    106. ENERGY & UTILITES MARKET, BY END USER, 2019-2032 (USD MILLION)
      1. TABLE 35
    107. ITALY APPLIED AI IN ENERGY & UTILITES MARKET, BY DEPLOYMENT TYPE, 2019-2032
      1. (USD MILLION)
    108. ITALY APPLIED AI IN ENERGY & UTILITES MARKET, BY
      1. APPLICATION, 2019-2032 (USD MILLION)
    109. ITALY APPLIED AI IN ENERGY &
    110. UTILITES MARKET, BY END USER, 2019-2032 (USD MILLION)
    111. REST OF EUROPE
    112. APPLIED AI IN ENERGY & UTILITES MARKET, BY DEPLOYMENT TYPE, 2019-2032 (USD MILLION)
    113. REST OF EUROPE APPLIED AI IN ENERGY & UTILITES MARKET, BY APPLICATION,
    114. REST OF EUROPE APPLIED AI IN ENERGY &
    115. UTILITES MARKET, BY END USER, 2019-2032 (USD MILLION)
    116. ASIA-PACIFIC
    117. APPLIED AI IN ENERGY & UTILITES MARKET, BY COUNTRY, 2019-2032 (USD MILLION)
    118. ASIA-PACIFIC APPLIED AI IN ENERGY & UTILITES MARKET, BY DEPLOYMENT
      1. TYPE, 2019-2032 (USD MILLION)
    119. ASIA-PACIFIC APPLIED AI IN ENERGY &
    120. UTILITES MARKET, BY APPLICATION, 2019-2032 (USD MILLION)
    121. ASIA-PACIFIC
    122. APPLIED AI IN ENERGY & UTILITES MARKET, BY END USER, 2019-2032 (USD MILLION)
    123. CHINA APPLIED AI IN ENERGY & UTILITES MARKET, BY DEPLOYMENT TYPE,
    124. CHINA APPLIED AI IN ENERGY & UTILITES
    125. MARKET, BY APPLICATION, 2019-2032 (USD MILLION)
    126. CHINA APPLIED AI IN
    127. ENERGY & UTILITES MARKET, BY END USER, 2019-2032 (USD MILLION)
      1. TABLE 48
    128. JAPAN APPLIED AI IN ENERGY & UTILITES MARKET, BY DEPLOYMENT TYPE, 2019-2032
      1. (USD MILLION)
    129. JAPAN APPLIED AI IN ENERGY & UTILITES MARKET, BY
      1. APPLICATION, 2019-2032 (USD MILLION)
    130. JAPAN APPLIED AI IN ENERGY &
    131. UTILITES MARKET, BY END USER, 2019-2032 (USD MILLION)
    132. INDIA APPLIED
    133. AI IN ENERGY & UTILITES MARKET, BY DEPLOYMENT TYPE, 2019-2032 (USD MILLION)
    134. INDIA APPLIED AI IN ENERGY & UTILITES MARKET, BY APPLICATION, 2019-2032
      1. (USD MILLION)
    135. INDIA APPLIED AI IN ENERGY & UTILITES MARKET, BY
      1. END USER, 2019-2032 (USD MILLION)
    136. SOUTH KOREA APPLIED AI IN ENERGY
    137. & UTILITES MARKET, BY DEPLOYMENT TYPE, 2019-2032 (USD MILLION)
      1. TABLE 55
    138. SOUTH KOREA APPLIED AI IN ENERGY & UTILITES MARKET, BY APPLICATION, 2019-2032
      1. (USD MILLION)
    139. SOUTH KOREA APPLIED AI IN ENERGY & UTILITES MARKET,
      1. BY END USER, 2019-2032 (USD MILLION)
    140. REST OF ASIA-PACIFIC APPLIED
    141. AI IN ENERGY & UTILITES MARKET, BY DEPLOYMENT TYPE, 2019-2032 (USD MILLION)
    142. REST OF ASIA-PACIFIC APPLIED AI IN ENERGY & UTILITES MARKET, BY APPLICATION,
    143. REST OF ASIA-PACIFIC APPLIED AI IN ENERGY
    144. & UTILITES MARKET, BY END USER, 2019-2032 (USD MILLION)
    145. REST OF
    146. THE WORLD APPLIED AI IN ENERGY & UTILITES MARKET, BY DEPLOYMENT TYPE, 2019-2032
      1. (USD MILLION)
    147. REST OF THE WORLD APPLIED AI IN ENERGY & UTILITES
    148. MARKET, BY APPLICATION, 2019-2032 (USD MILLION)
    149. REST OF THE WORLD
    150. APPLIED AI IN ENERGY & UTILITES MARKET, BY END USER, 2019-2032 (USD MILLION)
    151. MIDDLE EAST APPLIED AI IN ENERGY & UTILITES MARKET, BY DEPLOYMENT
      1. TYPE, 2019-2032 (USD MILLION)
    152. MIDDLE EAST APPLIED AI IN ENERGY &
    153. UTILITES MARKET, BY APPLICATION, 2019-2032 (USD MILLION)
    154. MIDDLE EAST
    155. APPLIED AI IN ENERGY & UTILITES MARKET, BY END USER, 2019-2032 (USD MILLION)
    156. AFRICA APPLIED AI IN ENERGY & UTILITES MARKET, BY DEPLOYMENT TYPE,
    157. AFRICA APPLIED AI IN ENERGY & UTILITES
    158. MARKET, BY APPLICATION, 2019-2032 (USD MILLION)
    159. AFRICA APPLIED AI
    160. IN ENERGY & UTILITES MARKET, BY END USER, 2019-2032 (USD MILLION)
      1. TABLE
    161. SOUTH AMERICA APPLIED AI IN ENERGY & UTILITES MARKET, BY DEPLOYMENT TYPE,
    162. SOUTH AMERICA APPLIED AI IN ENERGY & UTILITES
    163. MARKET, BY APPLICATION, 2019-2032 (USD MILLION)
    164. SOUTH AMERICA APPLIED
    165. AI IN ENERGY & UTILITES MARKET, BY END USER, 2019-2032 (USD MILLION)
      1. TABLE
    166. BUSINESS EXPANSIONS/PRODUCT LAUNCHES
    167. PARTNERSHIPS/AGREEMENTS/CONTRACTS/COLLABORATIONS
    168. ACQUISITIONS/MERGERS
    169. ALTAML INC. : PRODUCTS OFFERED
    170. ALTAML INC. : KEY DEVELOPMENT
    171. ATOS SE : PRODUCTS OFFERED
    172. ATOS SE : KEY DEVELOPMENT
    173. IBM CORPORATION : PRODUCTS OFFERED
    174. IBM CORPORATION : KEY DEVELOPMENT
    175. CEZ GROUP : PRODUCTS
      1. OFFERED
    176. CEZ GROUP : KEY DEVELOPMENT
    177. GOOGLE : PRODUCTS
      1. OFFERED
    178. GOOGLE : KEY DEVELOPMENT
    179. MICROSOFT CORPORATION
      1. : PRODUCTS OFFERED
    180. MICROSOFT CORPORATION : KEY DEVELOPMENT
      1. TABLE
    181. MINDTITAN : PRODUCTS OFFERED
    182. MINDTITAN : KEY DEVELOPMENT
      1. TABLE
    183. SMATCLOUD INC. : PRODUCTS OFFERED
    184. SMATCLOUD INC. : KEY DEVELOPMENT
    185. NVIDIA CORPORATION : PRODUCTS OFFERED
    186. NVIDIA CORPORATION
      1. : KEY DEVELOPMENT
    187. UTILITY DIVE : PRODUCTS OFFERED
    188. UTILITY
      1. DIVE : KEY DEVELOPMENT
    189. AAIC : PRODUCTS OFFERED
    190. AAIC
      1. : KEY DEVELOPMENT
    191. LIST OF FIGURES
    192. MARKET SYNOPSIS
    193. MARKET ATTRACTIVENESS ANALYSIS: GLOBAL APPLIED AI IN ENERGY &
    194. UTILITES MARKET
    195. GLOBAL APPLIED AI IN ENERGY & UTILITES MARKET:
      1. MARKET STRUCTURE
    196. BOTTOM-UP AND TOP-DOWN APPROACHES
    197. NORTH
      1. AMERICA: APPLIED AI IN ENERGY & UTILITES MARKET SIZE (USD MILLION) & MARKET
      2. SHARE (%), BY COUNTRY (2022 VS 2032)
    198. EUROPE: APPLIED AI IN ENERGY
    199. & UTILITES MARKET SIZE (USD MILLION) & MARKET SHARE (%), BY COUNTRY (2022
      1. VS 2032)
    200. ASIA–PACIFIC: APPLIED AI IN ENERGY & UTILITES MARKET
    201. SIZE (USD MILLION) & MARKET SHARE (%), BY COUNTRY (2022 VS 2032)
      1. FIGURE
    202. GLOBAL APPLIED AI IN ENERGY & UTILITES MARKET SIZE (USD MILLION) & MARKET
      1. SHARE (%), BY DEPLOYMENT TYPE (2022 VS 2032)
    203. GLOBAL APPLIED AI IN
    204. ENERGY & UTILITES MARKET SIZE (USD MILLION) & MARKET SHARE (%), BY APPLICATION
      1. (2022 VS 2032)
    205. GLOBAL APPLIED AI IN ENERGY & UTILITES MARKET
    206. SIZE (USD MILLION) & MARKET SHARE (%), BY END USER (2022 VS 2032)
      1. FIGURE
    207. MARKET DYNAMIC ANALYSIS OF THE GLOBAL APPLIED AI IN ENERGY & UTILITES MARKET
    208. DRIVER IMPACT ANALYSIS
    209. RESTRAINT IMPACT ANALYSIS
      1. FIGURE
    210. VALUE CHAIN: GLOBAL APPLIED AI IN ENERGY & UTILITES MARKET
      1. FIGURE 15
      2. PORTER''S FIVE FORCES ANALYSIS OF THE GLOBAL APPLIED AI IN ENERGY & UTILITES
      3. MARKET
    211. GLOBAL APPLIED AI IN ENERGY & UTILITES MARKET, BY DEPLOYMENT
      1. TYPE, 2022 (% SHARE)
    212. GLOBAL APPLIED AI IN ENERGY & UTILITES MARKET,
      1. BY DEPLOYMENT TYPE, 2022 VS 2032 (USD MILLION)
    213. GLOBAL APPLIED AI
    214. IN ENERGY & UTILITES MARKET, BY APPLICATION, 2022 (% SHARE)
    215. GLOBAL
    216. APPLIED AI IN ENERGY & UTILITES MARKET, BY APPLICATION, 2022 VS 2032 (USD MILLION)
    217. GLOBAL APPLIED AI IN ENERGY & UTILITES MARKET, BY END USER, 2022
      1. (% SHARE)
    218. GLOBAL APPLIED AI IN ENERGY & UTILITES MARKET, BY END
      1. USER, 2022 VS 2032 (USD MILLION)
    219. GLOBAL APPLIED AI IN ENERGY &
    220. UTILITES MARKET, BY REGION, 2022 (% SHARE)
    221. GLOBAL APPLIED AI IN ENERGY
    222. & UTILITES MARKET, BY REGION, 2022 VS 2032 (USD MILLION)
    223. NORTH
    224. AMERICA APPLIED AI IN ENERGY & UTILITES MARKET, BY COUNTRY, 2022 (% SHARE)
    225. NORTH AMERICA APPLIED AI IN ENERGY & UTILITES MARKET, BY COUNTRY,
    226. NORTH AMERICA APPLIED AI IN ENERGY &
    227. UTILITES MARKET, BY DEPLOYMENT TYPE, 2022-2032 (USD MILLION)
    228. NORTH
    229. AMERICA APPLIED AI IN ENERGY & UTILITES MARKET, BY APPLICATION, 2022-2032 (USD
      1. MILLION)
    230. NORTH AMERICA APPLIED AI IN ENERGY & UTILITES MARKET,
      1. BY END USER, 2022-2032 (USD MILLION)
    231. EUROPE APPLIED AI IN ENERGY
    232. & UTILITES MARKET, BY COUNTRY, 2022 (% SHARE)
    233. EUROPE APPLIED
    234. AI IN ENERGY & UTILITES MARKET, BY COUNTRY, 2022 VS 2032 (USD MILLION)
      1. FIGURE
    235. EUROPE APPLIED AI IN ENERGY & UTILITES MARKET, BY DEPLOYMENT TYPE, 2022-2032
      1. (USD MILLION)
    236. EUROPE APPLIED AI IN ENERGY & UTILITES MARKET,
      1. BY APPLICATION, 2022-2032 (USD MILLION)
    237. EUROPE APPLIED AI IN ENERGY
    238. & UTILITES MARKET, BY END USER, 2022-2032 (USD MILLION)
    239. ASIA-PACIFIC
    240. APPLIED AI IN ENERGY & UTILITES MARKET, BY COUNTRY, 2022 (% SHARE)
      1. FIGURE
    241. ASIA-PACIFIC APPLIED AI IN ENERGY & UTILITES MARKET, BY COUNTRY, 2022 VS
    242. ASIA-PACIFIC APPLIED AI IN ENERGY & UTILITES
    243. MARKET, BY DEPLOYMENT TYPE, 2022-2032 (USD MILLION)
    244. ASIA-PACIFIC
    245. APPLIED AI IN ENERGY & UTILITES MARKET, BY APPLICATION, 2022-2032 (USD MILLION)
    246. ASIA-PACIFIC APPLIED AI IN ENERGY & UTILITES MARKET, BY END USER,
    247. REST OF THE WORLD APPLIED AI IN ENERGY &
    248. UTILITES MARKET, BY DEPLOYMENT TYPE, 2022-2032 (USD MILLION)
    249. REST
    250. OF THE WORLD APPLIED AI IN ENERGY & UTILITES MARKET, BY APPLICATION, 2022-2032
      1. (USD MILLION)
    251. REST OF THE WORLD APPLIED AI IN ENERGY & UTILITES
    252. MARKET, BY END USER, 2022-2032 (USD MILLION)
    253. MIDDLE EAST APPLIED
    254. AI IN ENERGY & UTILITES MARKET, BY DEPLOYMENT TYPE, 2022-2032 (USD MILLION)
    255. MIDDLE EAST APPLIED AI IN ENERGY & UTILITES MARKET, BY APPLICATION,
    256. MIDDLE EAST APPLIED AI IN ENERGY & UTILITES
    257. MARKET, BY END USER, 2022-2032 (USD MILLION)
    258. AFRICA APPLIED AI IN
    259. ENERGY & UTILITES MARKET, BY DEPLOYMENT TYPE, 2022-2032 (USD MILLION)
      1. FIGURE
    260. AFRICA APPLIED AI IN ENERGY & UTILITES MARKET, BY APPLICATION, 2022-2032
      1. (USD MILLION)
    261. AFRICA APPLIED AI IN ENERGY & UTILITES MARKET,
      1. BY END USER, 2022-2032 (USD MILLION)
    262. SOUTH AMERICA APPLIED AI IN
    263. ENERGY & UTILITES MARKET, BY DEPLOYMENT TYPE, 2022-2032 (USD MILLION)
      1. FIGURE
    264. SOUTH AMERICA APPLIED AI IN ENERGY & UTILITES MARKET, BY APPLICATION, 2022-2032
      1. (USD MILLION)
    265. SOUTH AMERICA APPLIED AI IN ENERGY & UTILITES MARKET,
      1. BY END USER, 2022-2032 (USD MILLION)
    266. GLOBAL APPLIED AI IN ENERGY
      1. & UTILITES MARKET: COMPETITIVE BENCHMARKING
    267. VENDOR SHARE ANALYSIS
      1. (2022) (%)
    268. ALTAML INC. : FINANCIAL OVERVIEW SNAPSHOT
      1. FIGURE
    269. ALTAML INC. : SWOT ANALYSIS
    270. ATOS SE : FINANCIAL OVERVIEW SNAPSHOT
    271. ATOS SE : SWOT ANALYSIS
    272. IBM CORPORATION : FINANCIAL OVERVIEW
      1. SNAPSHOT
    273. IBM CORPORATION : SWOT ANALYSIS
    274. CEZ GROUP
      1. : FINANCIAL OVERVIEW SNAPSHOT
    275. CEZ GROUP : SWOT ANALYSIS
      1. FIGURE
    276. GOOGLE : FINANCIAL OVERVIEW SNAPSHOT
    277. GOOGLE : SWOT ANALYSIS
    278. MICROSOFT CORPORATION : FINANCIAL OVERVIEW SNAPSHOT
    279. MICROSOFT
      1. CORPORATION : SWOT ANALYSIS
    280. MINDTITAN : FINANCIAL OVERVIEW SNAPSHOT
    281. MINDTITAN : SWOT ANALYSIS
    282. SMATCLOUD INC. : FINANCIAL
      1. OVERVIEW SNAPSHOT
    283. SMATCLOUD INC. : SWOT ANALYSIS
    284. NVIDIA
      1. CORPORATION : FINANCIAL OVERVIEW SNAPSHOT
    285. NVIDIA CORPORATION : SWOT
      1. ANALYSIS
    286. UTILITY DIVE : FINANCIAL OVERVIEW SNAPSHOT
      1. FIGURE 72
      2. UTILITY DIVE : SWOT ANALYSIS
    287. AAIC : FINANCIAL OVERVIEW SNAPSHOT
    288. AAIC : SWOT ANALYSIS

    Applied AI in Energy & Utilities Market Segmentation

    Market Segmentation Overview

    • Detailed segmentation data will be available in the full report
    • Comprehensive analysis by multiple parameters
    • Regional and country-level breakdowns
    • Market size forecasts by segment
    Infographic

    Free Sample Request

    Kindly complete the form below to receive a free sample of this Report

    Get Free Sample

    Customer Strories

    “I am very pleased with how market segments have been defined in a relevant way for my purposes (such as "Portable Freezers & refrigerators" and "last-mile"). In general the report is well structured. Thanks very much for your efforts.”

    Victoria Milne

    Founder
    Case Study
    Chemicals and Materials