info@marketresearchfuture.com   📞  +1 (855) 661-4441(US)   📞  +44 1720 412 167(UK)
Certified Global Research Member
Isomar fd.webp Wcrc 57.webp
Key Questions Answered
  • Global Market Outlook
  • In-depth analysis of global and regional trends
  • Analyze and identify the major players in the market, their market share, key developments, etc.
  • To understand the capability of the major players based on products offered, financials, and strategies.
  • Identify disrupting products, companies, and trends.
  • To identify opportunities in the market.
  • Analyze the key challenges in the market.
  • Analyze the regional penetration of players, products, and services in the market.
  • Comparison of major players’ financial performance.
  • Evaluate strategies adopted by major players.
  • Recommendations
Why Choose Market Research Future?
  • Vigorous research methodologies for specific market.
  • Knowledge partners across the globe
  • Large network of partner consultants.
  • Ever-increasing/ Escalating data base with quarterly monitoring of various markets
  • Trusted by fortune 500 companies/startups/ universities/organizations
  • Large database of 5000+ markets reports.
  • Effective and prompt pre- and post-sales support.

App Analytics Market Share

ID: MRFR//5139-CR | 142 Pages | Author: Ankit Gupta| August 2019

In this setting, smart placement is very important for success, and companies use a range of ways to find their spot. Businesses often use differentiation to make their goods stand out from competitors by giving them special features or making them more useful. Adding cutting-edge technologies, new user interfaces, or data that is made just for certain businesses can help with this.
To figure out market share, pricing strategies are also very important. Certain companies try to offer the lowest prices on data products so that they can get a lot of different types of customers. Some however choose to charge more because they want to show off how unique and powerful their data tools are. This section goes after different types of people. This helps companies get more customers and stay ahead of the competition.


Expertise and being different are two things that companies often use to stand out in the market. People or companies in this case are served by unique data solutions that are made to fit their needs. When it comes to the pros and cons of online shopping, one company might focus on making sure its goods are the best they can be by offering data solutions for e-commerce apps. You can become the best in your field with this customized way.

A lot of businesses also keep their market shares in the App Analytics Market by coming up with new products all the time. Firms that add new functions and follow new trends to keep up with new technologies will be the best in their fields. This not only brings in tech-savvy customers but also makes sure the business stays current and competitive in the ever-evolving field of app analytics. By making regular changes, adding new features, and adapting to how the market wants things to change, a business can keep or grow its market share.

Covered Aspects:

Report Attribute/Metric Details
Base Year For Estimation 2022
Historical Data 2020 & 2021
Forecast Period 2022-2030
Growth Rate 23.32% (2022-2030)

App Analytics Market Overview


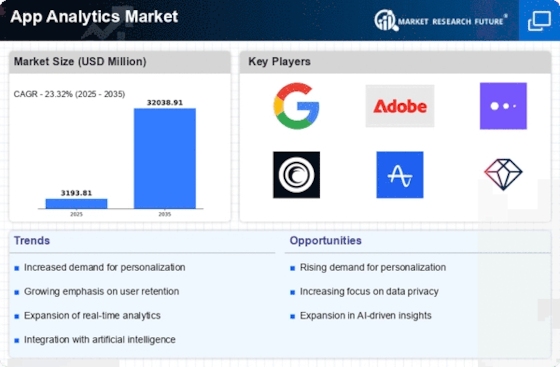
App Analytics Market Size was valued at USD 1,896 Million in 2021. The App Analytics market industry is projected to grow from USD 308.29 Million in 2022 to USD 1673.75 Million by 2030, exhibiting a compound annual growth rate (CAGR) of 23.32% during the forecast period (2022 - 2030). The growing penetration of smartphones, increasing application and downloads of apps, new technology development and integrations, increasing focus on digital marketing analytics, and demand for user analytics positively boost the market growth.


App Analytics Market Overview


Source: Secondary Research, Primary Research, MRFR Database and Analyst Review


App Analytics Market Trends


Increasing application development and downloads boost the market growth ly


Application development has increased worldwide after COVID-19 pushing the demand for app analytics simultaneously. In 2022, Russia’s invasion of Ukraine and increasing tensions between China and the U.S. pushed countries to focus more on domestic production.


According to data from business of Apps, in 2021, there is an increase of only 0.5% in app downloads compared to a 24.2% increment in 2020. The primary reason for this decline in 2021 is attributed to China India sour relations resulting from political and economic scenarios. In 2020, the Indian government banned 52 apps primarily, and this toll has gone to 400 apps, which has impacted the download statistics and new app development in 2021 a lot. In addition, Ukraine-Russia also impacted this market a lot due to decreased number of subscribers and further COVID impact, which continued in China and some of the developed countries in 2021 and 2022.


Figure 1: Application downloads per yearApplication downloads per year


Source: Secondary Research, Primary Research, MRFR Database and Analyst Review


As seen from the figure above, the app downloads data in 2016 and 2017 were grown by more than 20%. This growth was due to the introduction of 4G at a larger scale in China and India, but with the increased penetration in 2018 and 2019, the market had grown by nearly 10% in 2018 and 2019. But with the impact of Covid, 2020 was a year of recovery due to increased apps in the healthcare and health monitoring sector. In addition to that number of smartphones had also outnumbered in 2020. But again, in 2021, this growth is increased by a margin of 0.5%.


Instead of this decline, the number of downloads remains at the same level. These downloads are mainly from the information end. The industry that ran primarily on game apps is now flooded with other verticals such as healthcare, transportation, government-based apps, and many more. This increment, in turn, forced many companies to use app analytics for their future growth propositions. Due to downloads, as mentioned earlier demand, app analytics will help many companies to track their employee performance, customer feedback, and many other potential usages.


App Analytics Market Segment Insights


App Analytics by Application Type Insights


Based on application type, the App Analytics market segmentation includes revenue analytics, app performance analytics and operations, crash analytics, cross-platform analysis, user analytics, in-behavioral analytics, ad monitoring and marketing analytics, campaign analytics, and others. The ad monitoring and marketing analytics segment held the largest revenue share of 20.21% in 2021 and is expected to remain dominant through the forecast period. The primary reason for this segment’s growth is the increasing usage of social media platforms for ads and marketing. In addition, increasing focus on digital platforms such as e-commerce websites, news, and another informative website, paid pay-per-click programs, and many tools analyze online ads between videos for better results. As a result of these increasing complexities in the digital system, the market is expected to grow substantially.


With the help of analytics tools, product marketing or sales team can create and analyze feedback loops. As companies launch campaigns, update their app or sites and release new features, teams can easily track the responses. Based on these data points, respective teams can modify further changes, leading to better product responses.


Figure 2: App Analytics Market, by Application Type, 2021 & 2030 (USD Million)App Analytics Market, by Application Type, 2021 & 2030


Source: Secondary Research, Primary Research, MRFR Database and Analyst Review


The revenue analytics segment second-largest application area for the app analytics market. The market is expected to show revenue growth at a CAGR of 23.54% through the forecast period. In 2022, according to ITU estimates, approximately 5.3 billion people (66% of the population) will be using the internet worldwide. The increasing integration of machine learning models and mobile analytics solutions, including app analytics and Artificial Intelligence (AI), are helping many companies find revenue generation points, which helps the market grow through the forecast period.


Most app management metrics solutions or platforms are evolving, and instead of a simple presentation, the information is present in a dashboard and user-friendly analytics models. Google uses Firebase to explore analytics for communication devices. Attribution, notifications, storage, deep links, invitations, AdWords, and AdMob, are all infused together to give consumers or companies the most incredible insights. For example, Microsoft Clarity and Google Analytics offer app analytics assistants to uncover appealing insights without the requirement of data mining.


November 2022 - Vianova had done an agreement with on-demand transportation company Fenix. According to the contract, the company will help Fenix to gain insights about its fleets in five countries, including United Arab Emirates, Saudi Arabia, Bahrain, and Qatar.


April 2022: April 2022 - Mobile Marketing collaborated with Roomvo to develop visualizer analytics module for them. According to the company, with the usage of analytics insights Roomvo, their respective partners or merchants could gain new points of insight from their customers and helping them to target right area for developments in their value chain.


App Analytics by Platform Type Insights


Based on platform type, the App Analytics market segmentation includes Web-Based, and Mobile Based apps. The mobile-based segment held the largest revenue share of 65.5% in 2021 and is expected to remain dominant through the forecast period. Even though declining smartphone sales impacted the market in 2022, this decline is short-term. Even so, at the same time, web-based applications have shown promising potential due to work-from-home culture and the usage of analytics to understand customers and supply chains in a better manner.


Mobile analytics is far more accurate and convenient than web-based analytics platforms. Most mobile analytics tools use software development kits (SDK) to track vendors. Depending on the infusion of new technologies, such as artificial intelligence, user activity can use modified codes to track custom events. Compared to web analytics, SDKs had not had to depend on cookies to identify its user. Therefore, it will give more precise results when compared to web analytics. Also, as mobile phones penetrate the most internet traffic ly, target more analytics requirements over this platform.


Even though mobile analytics face a significant problem from the aspects of security. Due to sensitive data threats and breaches, small app analytics firms with compromised security tools for low lost loose data of the prospective clients create an impact on the market growth.


App Analytics Industry Verticals Insights


Based on industry verticals, the App Analytics market segmentation includes BFSI, Retail, Media and Entertainment, Logistics, Travel and Transport (LTT), Telecom and IT, Healthcare, Hospitality, and Others. The retail segment dominated the market with a share of 23.2% in 2021 and is projected to remain in its position through the forecast period.


Figure 3: App Analytics Market, by Industry Vertical, 2021 & 2030 (USD Million)App Analytics Market, by Industry Vertical, 2021 & 2030


Source: Secondary Research, Primary Research, MRFR Database and Analyst Review


Retail management has become a complex process focusing on customer satisfaction rather than developing products. Customers expect personalization, faster implementation options, and cohesive omnichannel platforms in every store or outlet. Increasing competitive pressures and the continuous evolving of commerce channels are driving the demand for App Analytics tools.


According to National Retail Federation reports, revenues generated from retail outlets in the U.S. exceeded USD 4.86 trillion last year. In addition, retail industry sales are expected to grow between 6% and 8%. Out of overall sales in the U.S., 35% was the contribution from e-commerce, expected to grow between 11% to 13% every year. App analytics solutions for retail and e-commerce are gaining popularity in nations including the U.S., China, India, Norway, Sweden, South Korea, Taiwan, and others.


App Analytics Regional Insights


By Region, the study segments the market into North America, Europe, Asia-Pacific, and the Rest of the World. The North America App Analytics market accounted for USD 608.6 Million in 2021 and is expected to exhibit a 22.03% CAGR during the study period. This demand is attributed to the increasing deployment of app analytics for every industry in the U.S. According to MRFR study, till now, the penetration rate has been highest when compared to other industries.


.Figure 3: APP ANALYTICS MARKET SHARE BY REGION 2021 (%)APP ANALYTICS MARKET SHARE BY REGION 2021


Source: Secondary Research, Primary Research, MRFR Database and Analyst Review


At present, Asia Pacific is the third-largest regional App Analytics market in 2021. However, at the end of the forecast period, Asia-Pacific is expected to be the dominant region with a share of more than 30%, is also anticipated to grow at the fastest growth rate. In this region, countries such as Vietnam, China, Malaysia, India, and Indonesia are expected to drive the demand for App Analytics over the forecast period.


App Analytics Key Market Players & Competitive Insights


Major market players are spending money on marketing activities, which will help the App Analytics market grow even more. Market participants are also taking various strategic initiatives to grow their worldwide footprint, including new technology integrations, contractual agreements, mergers and acquisitions, increased investments, and collaboration with other organizations. Competitors in the App Analytics industry must offer cost-effective items to expand and survive in an increasingly competitive and rising market environment.


One of the primary business strategies adopted by App Analytics industry solution providers is to benefit and make clients knowledgeable. In recent years, App Analytics has shown a tremendous boost due to e-commerce market acceptance and focus on going online. The App Analytics market is partially fragmented, with the presence of big players having nearly 30% share in 2021. The major companies in the market are Amazon.com Inc., Facebook Inc., Google LLC, Microsoft Corporation, and Content square SaaS.


Key Companies in the App Analytics market includes


  • Taplytics, Inc. (U.S.)


  • Kochava (U.S.)


  • Adobe Systems Inc. (U.S.)


  • IBM Corporation (U.S.)


  • Amazon.com, Inc. (U.S.)


  • Google (U.S.)


  • Yahoo Inc. (U.S.)


  • Countly (U.K.)


  • Localytics (U.S.)


  • Swrve (U.S.)


  • Apptentive (U.S.)


  • Moengage (U.S.)


  • Mixpanel (U.S.)


  • Content Square SAS (France)


  • TUNE Inc. (U.S.)


  • Clever Tap (U.S.)


  • AppsFlyer (U.S.)


  • appScatter (U.K.)


  • Amplitude (U.S.)


  • Appsee (U.S.)


App Analytics Industry Developments


The MDM Analytics team is pleased to declare the April 2024 release of Market Prospector 4.0, a robust market profiling software service that has been utilized for over three decades by leading North American distributors and manufacturers of electrical, industrial, construction, and facilities maintenance supplies. Using its proprietary market profiling models, Market Prospector has assisted hundreds of electrical, industrial, construction, and facility maintenance product marketers in sizing, segmenting, and forecasting product markets, expanding market share, and targeting high-potential prospect accounts. In addition to serving manufacturers and distributors as our primary clientele, MDM Analytics also provides services to international consulting firms, financial experts, and M&A specialists. The majority of market research firms offer national-level market size estimates for product categories. MDM Analytics provides clients with the "DNA" of estimated market and account potential across distinct product category, territory, and customer segmentation dimensions by employing a more precise top-down and bottom-up modeling methodology.


In November 2023, Salesforce introduced Service Intelligence, an analytics application designed to improve customer satisfaction and agent efficiency. Data Cloud, the real-time hyperscale data engine developed by Salesforce, provides Service Intelligence with the capability to provide users with direct access to their business data within Service Cloud. This eliminates the superfluous nature of navigating between displays in search of information. Businesses can bridge the gap between data and action with AI-powered Service Intelligence, which transforms raw data into valuable consumer insights. This provides service personnel with the necessary information to effectively carry out their primary objective, which is to provide outstanding customer experiences. Service Intelligence provides a view of critical metrics, including average time to close, customer satisfaction, and individual and team obligations, via pre-built, customizable dashboards. This facilitates comprehension and visibility for agents and managers, bolstered by the insights generated by AI.


App Analytics Market Segmentation


App Analytics Application Outlook


  • Revenue Analytics


  • App Performance Analytics and Operations


  • Crash Analytics


  • Cross Platform Analysis


  • User Analytics


  • In-Behavioral Analytics


  • Ad Monitoring and Marketing Analytics


  • Campaign Analytics


  • Others


App Analytics Industry Vertical Outlook


  • BFSI


  • Retail


  • Media and Entertainment


  • Logistics, Travel, and Transport (LTT)


  • Telecom and IT


  • Healthcare


  • Hospitality


  • Others


App Analytics Platform Outlook


  • Web-Based


  • Mobile-Based


App Analytics Regional Outlook


  • North America


    • US

    • Canada


  • Europe


    • Germany

    • France

    • UK

    • Italy

    • Spain

    • Rest of Europe


  • Asia-Pacific


    • China

    • Japan

    • India

    • Australia

    • South Korea

    • Australia

    • Rest of Asia-Pacific


  • Rest of the World


    • Middle East

    • Africa

    • Latin America


Leading companies partner with us for data-driven Insights
client_1 client_2 client_3 client_4 client_5 client_6 client_7 client_8 client_9 client_10
Kindly complete the form below to receive a free sample of this Report
Please fill in Business Email for Quick Response

We do not share your information with anyone. However, we may send you emails based on your report interest from time to time. You may contact us at any time to opt-out.

Purchase Option
Single User $ 4,950
Multiuser License $ 5,950
Enterprise User $ 7,250
Compare Licenses
Tailored for You
  • Dedicated Research on any specifics segment or region.
  • Focused Research on specific players in the market.
  • Custom Report based only on your requirements.
  • Flexibility to add or subtract any chapter in the study.
  • Historic data from 2014 and forecasts outlook till 2040.
  • Flexibility of providing data/insights in formats (PDF, PPT, Excel).
  • Provide cross segmentation in applicable scenario/markets.