• Cat-intel
  • MedIntelliX
  • Resources
  • About Us
  • Hero Background
    English
    Chinese
    French
    Japanese
    Korean
    German
    Spanish

    Anesthesia Delivery Devices Market Share

    ID: MRFR/MED/0777-HCR
    80 Pages
    Kinjoll Dey
    October 2025

    Anesthesia delivery devices market research report, by types (Monitoring devices, anaesthesia delivery devices, disposables device and other) by end users (hospitals, research centres, clinics and others) - Global Forecast to 2035

    Share:
    Download PDF ×

    We do not share your information with anyone. However, we may send you emails based on your report interest from time to time. You may contact us at any time to opt-out.

    Anesthesia Delivery Devices Market Infographic
    Purchase Options

    Market Share

    Anesthesia Delivery Devices Market Share Analysis

    In the ever-evolving landscape of healthcare, the Anesthesia Delivery Devices Market has witnessed a dynamic interplay of market share positioning strategies among key industry players. These strategies are crucial as they directly impact a company's competitive standing and influence its ability to meet the diverse needs of healthcare professionals and patients alike.

    One prevalent approach to securing market share in the Anesthesia Delivery Devices Market involves product innovation and technological advancements. Companies invest heavily in research and development to introduce cutting-edge devices that offer enhanced safety, efficiency, and patient comfort during anesthesia administration. By staying at the forefront of technological breakthroughs, a company can differentiate itself, attract healthcare providers seeking state-of-the-art solutions, and consequently capture a significant share of the market.

    Strategic partnerships and collaborations constitute another pivotal facet of market share positioning. Given the complexity of the healthcare industry, collaboration with other key stakeholders, such as hospitals, research institutions, and pharmaceutical companies, can be a game-changer. Joint ventures or alliances enable companies to pool resources, share expertise, and leverage each other's strengths to develop comprehensive solutions that cater to the evolving demands of the Anesthesia Delivery Devices Market. Through strategic partnerships, companies can broaden their market reach and solidify their position in the competitive landscape.

    Pricing strategies also play a crucial role in determining market share within the Anesthesia Delivery Devices Market. In a landscape where cost-effectiveness and value for money are paramount considerations, companies often adopt pricing strategies that strike a balance between affordability and quality. Some choose to position themselves as providers of cost-effective solutions, targeting price-sensitive segments of the market. Others opt for a premium pricing model, positioning their products as high-end, technologically advanced options for healthcare facilities willing to invest in top-tier anesthesia delivery devices.

    Geographical expansion is yet another dimension of market share positioning. Companies strategically target regions with growing healthcare needs and increasing demand for anesthesia delivery devices. By expanding their presence globally, they can tap into new markets, diversify their customer base, and mitigate risks associated with dependence on specific regions. This approach requires an understanding of local regulations, cultural nuances, and healthcare infrastructure to effectively penetrate and establish a stronghold in diverse markets.

    Moreover, a focus on customer education and support is integral to securing and expanding market share. Anesthesia delivery devices are intricate pieces of medical equipment, and healthcare professionals require in-depth knowledge to utilize them effectively. Companies that invest in comprehensive training programs, user-friendly manuals, and responsive customer support services enhance their reputation and foster long-term relationships with healthcare providers. By prioritizing customer education, companies not only ensure the optimal use of their products but also build trust and loyalty within the market.

    Author
    Kinjoll Dey
    Research Analyst Level I

    He is an extremely curious individual currently working in Healthcare and Medical Devices Domain. Kinjoll is comfortably versed in data centric research backed by healthcare educational background. He leverages extensive data mining and analytics tools such as Primary and Secondary Research, Statistical Analysis, Machine Learning, Data Modelling. His key role also involves Technical Sales Support, Client Interaction and Project management within the Healthcare team. Lastly, he showcases extensive affinity towards learning new skills and remain fascinated in implementing them.

    Leave a Comment

    FAQs

    What is the expected growth rate of the Global Anesthesia Delivery Devices Market?

    Anesthesia Delivery Devices Market is expected to expand at 6.42% CAGR from 2024 to 2032.

    Who are the prominent players of the Global Anesthesia Delivery Devices Market?

    Fisher and Paykel, Philips Healthcare, OSI Systems, MEDTRONIC, Sedana Medical, MAQUET Holding B.V. & Co. KG., Getinge Group, Smiths Medical, Covidien plc, Teleflex, Intersurgical Ltd, Drägerwerk AG & Co., ResMed, and GE Healthcare are prominent players of the global anesthesia delivery devices market.

    What is the trend engulfing the Global Anesthesia Delivery Devices Market?

    The integration of artificial intelligence to ensure the right dosage of anesthesia to patients is the trend to watch out for in the Global Anesthesia Delivery Devices Market.

    Which region can showcase the highest growth rate in the Global Anesthesia Delivery Devices Market?

    The APAC region can showcase the highest growth rate in the Global Anesthesia Delivery Devices Market due to constant development of economies and an uptick in surgeries.

    What are the major drivers of the Global Anesthesia Delivery Devices Market?

    Continuous development of anesthesia delivery devices and increasing volume of surgeries are major drivers of the Global Anesthesia Delivery Devices Market.

    Market Summary

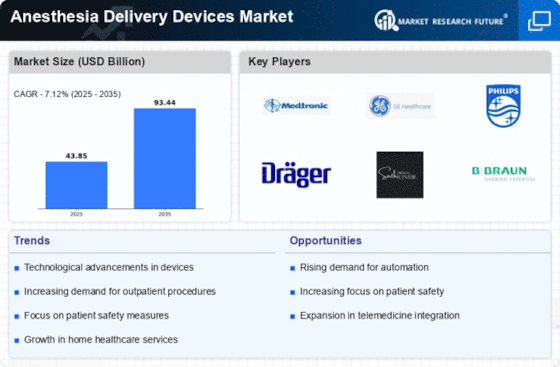
    As per MRFR analysis, the Anesthesia Delivery Devices Market was estimated at 43.85 USD Billion in 2024. The anesthesia delivery devices industry is projected to grow from 46.97 USD Billion in 2025 to 93.44 USD Billion by 2035, exhibiting a compound annual growth rate (CAGR) of 7.12 during the forecast period 2025 - 2035.

    Key Market Trends & Highlights

    The Anesthesia Delivery Devices Market is poised for growth driven by technological advancements and increasing surgical procedures.

    • Technological advancements in anesthesia delivery devices enhance patient safety and operational efficiency.
    • North America remains the largest market, while Asia-Pacific is recognized as the fastest-growing region in this sector.
    • Monitoring devices dominate the market, whereas disposable devices are experiencing the fastest growth due to rising demand.
    • The increasing number of surgical procedures and heightened awareness of patient safety are key drivers propelling market expansion.

    Market Size & Forecast

    2024 Market Size 43.85 (USD Billion)
    2035 Market Size 93.44 (USD Billion)
    CAGR (2025 - 2035) 7.12%
    Largest Regional Market Share in 2024 North America

    Major Players

    <p>Medtronic (US), GE Healthcare (US), Philips (NL), Dräger (DE), Smiths Medical (US), B. Braun (DE), Fresenius Kabi (DE), Masimo (US), Nihon Kohden (JP)</p>

    Market Trends

    The Anesthesia Delivery Devices Market is currently experiencing a transformative phase, driven by advancements in technology and an increasing emphasis on patient safety. Innovations in device design and functionality are enhancing the precision of anesthesia administration, thereby improving overall surgical outcomes. Furthermore, the growing prevalence of chronic diseases necessitates more frequent surgical interventions, which in turn fuels demand for sophisticated anesthesia delivery systems. As healthcare providers seek to optimize operational efficiency, the integration of smart technologies into these devices appears to be a pivotal trend, potentially reshaping the landscape of anesthesia practices. In addition, regulatory bodies are intensifying their focus on the safety and efficacy of anesthesia delivery devices, which may lead to stricter compliance requirements. This regulatory scrutiny could drive manufacturers to invest in research and development, fostering a culture of innovation within the industry. Moreover, the rising awareness of the importance of training and education for healthcare professionals in the use of these devices suggests a shift towards more comprehensive training programs. Overall, the Anesthesia Delivery Devices Market is poised for growth, characterized by a blend of technological advancements and evolving regulatory frameworks that may redefine standards of care in anesthesia administration.

    Technological Advancements

    The Anesthesia Delivery Devices Market is witnessing a surge in technological innovations, particularly in the realm of smart devices. These advancements facilitate enhanced monitoring and control of anesthesia delivery, potentially leading to improved patient outcomes. Manufacturers are increasingly focusing on integrating features such as real-time data analytics and automated dosing systems, which may streamline the anesthesia process.

    Regulatory Changes

    Regulatory bodies are becoming more vigilant regarding the safety and efficacy of anesthesia delivery devices. This heightened scrutiny could result in more stringent compliance requirements for manufacturers, compelling them to prioritize quality assurance and risk management. Such changes may foster a culture of continuous improvement within the industry.

    Focus on Training and Education

    There is a growing recognition of the necessity for comprehensive training programs for healthcare professionals in the use of anesthesia delivery devices. This trend suggests that as technology evolves, so too must the education of practitioners, ensuring they are well-equipped to utilize advanced devices effectively and safely.

    <p>The evolution of anesthesia delivery devices appears to be driven by advancements in technology, enhancing patient safety and procedural efficiency in surgical environments.</p>

    U.S. Food and Drug Administration (FDA)

    Anesthesia Delivery Devices Market Market Drivers

    Technological Innovations

    Technological advancements play a crucial role in shaping the Anesthesia Delivery Devices Market. Innovations such as automated anesthesia delivery systems, real-time monitoring technologies, and enhanced drug delivery mechanisms are transforming the landscape. These advancements not only improve the efficiency of anesthesia administration but also enhance patient safety. For instance, the integration of artificial intelligence in anesthesia devices allows for more precise dosage calculations and monitoring of patient vitals. Market data indicates that the adoption of such technologies is increasing, with a notable rise in the use of smart anesthesia machines. This trend is likely to continue, as healthcare providers seek to leverage technology to improve outcomes and streamline operations.

    Rising Surgical Procedures

    The increasing number of surgical procedures worldwide is a primary driver for the Anesthesia Delivery Devices Market. As healthcare systems evolve, the demand for surgical interventions rises, leading to a corresponding need for effective anesthesia delivery. According to recent data, the number of surgeries performed annually has been on an upward trajectory, with estimates suggesting that millions of procedures are conducted each year. This surge necessitates advanced anesthesia delivery devices to ensure patient safety and comfort during operations. Furthermore, the growing prevalence of chronic diseases requiring surgical treatment further fuels this demand. Consequently, manufacturers are focusing on developing innovative anesthesia delivery systems to cater to the expanding market, thereby enhancing their market presence and competitiveness.

    Growing Geriatric Population

    The increasing geriatric population is a significant driver for the Anesthesia Delivery Devices Market. As individuals age, they often require more medical interventions, including surgeries that necessitate anesthesia. The demographic shift towards an older population is prompting healthcare systems to adapt and expand their anesthesia services. Data indicates that the proportion of elderly individuals is rising, leading to a higher demand for specialized anesthesia delivery devices tailored to the needs of older patients. These devices must account for the unique physiological considerations of geriatric patients, thereby driving innovation in the market. Consequently, manufacturers are focusing on developing devices that enhance safety and efficacy for this demographic, further propelling market growth.

    Regulatory Support and Standards

    Regulatory frameworks and standards are pivotal in shaping the Anesthesia Delivery Devices Market. Governments and health organizations are establishing stringent guidelines to ensure the safety and efficacy of anesthesia devices. This regulatory support fosters innovation and encourages manufacturers to develop high-quality products that meet safety standards. Compliance with these regulations not only enhances product credibility but also boosts consumer confidence in anesthesia delivery systems. Market data suggests that regions with robust regulatory frameworks experience higher adoption rates of advanced anesthesia technologies. As regulatory bodies continue to evolve their standards, the market is likely to witness an influx of innovative devices designed to meet these requirements.

    Increasing Awareness of Patient Safety

    The growing emphasis on patient safety is significantly influencing the Anesthesia Delivery Devices Market. Healthcare providers are increasingly prioritizing the implementation of safety protocols and advanced technologies to minimize risks associated with anesthesia administration. This heightened awareness has led to the adoption of sophisticated anesthesia delivery systems that incorporate safety features such as alarms, automated drug delivery, and comprehensive monitoring capabilities. Market Research Future indicates that hospitals and surgical centers are investing in these advanced devices to enhance patient care and reduce the incidence of anesthesia-related complications. As a result, the demand for reliable and safe anesthesia delivery devices is expected to rise, driving market growth.

    Market Segment Insights

    By Type: Monitoring Devices (Largest) vs. Disposable Devices (Fastest-Growing)

    <p>In the Anesthesia Delivery Devices Market, the distribution of market share reveals that Monitoring Devices dominate, providing essential real-time data on patient vitals during procedures. These devices are critical in ensuring patient safety and optimizing anesthesia management, leading to strong demand across various healthcare settings. On the other hand, Disposable Devices are rapidly gaining traction within the market due to their convenience and growing preference for single-use components, aligning with infection control standards.</p>

    <p>Monitoring Devices (Dominant) vs. Disposable Devices (Emerging)</p>

    <p>Monitoring Devices represent a core component of the Anesthesia Delivery Devices Market, characterized by advanced technology that enhances patient safety and procedural efficiency. The dominant position is attributed to their extensive use in operating rooms and intensive care units, where real-time monitoring of parameters such as heart rate, blood pressure, and oxygen saturation is crucial. In contrast, Disposable Devices are emerging rapidly due to the heightened emphasis on hygiene and infection prevention in medical environments. They offer a practical solution by minimizing cross-contamination risks, and their growing adoption reflects a shift towards maintaining patient safety through single-use products.</p>

    By End-User: Medical Centers (Largest) vs. Clinics (Fastest-Growing)

    <p>The Anesthesia Delivery Devices Market is predominantly driven by medical centers, which account for a significant share due to their extensive operations and high demand for advanced medical technology. These centers utilize anesthesia delivery devices more frequently as they handle complex surgeries requiring specialized anesthesia techniques. In contrast, clinics are emerging as a vital segment, contributing to market expansion with an increased focus on outpatient services and minor surgical procedures that necessitate reliable anesthesia solutions.</p>

    <p>Medical Centers: Dominant vs. Clinics: Emerging</p>

    <p>Medical centers remain the dominant segment in the anesthesia delivery devices market, owing to their vast infrastructure and capability to perform various surgical procedures. They typically invest in state-of-the-art anesthetic equipment to ensure patient safety and improve surgical outcomes. On the other hand, clinics represent an emerging segment that is witnessing rapid growth. With the rising trend of outpatient surgeries and a greater emphasis on offering convenience to patients, clinics are increasingly adopting innovative anesthesia delivery systems. These establishments often focus on cost-effective solutions, making them attractive for patients seeking minor procedural care without compromising on quality.</p>

    By Application: Cardiology (Largest) vs. Orthopedics (Fastest-Growing)

    <p>In the Anesthesia Delivery Devices Market, the application segment exhibits a diverse distribution of market share across various fields. Cardiology holds a significant share, driven largely by the widespread use of anesthesia delivery devices in cardiac surgeries and related procedures. In contrast, ophthalmology and dental applications also command notable shares, though at lower levels compared to cardiology. Orthopedics, while currently smaller in market share, is gaining ground rapidly as surgical innovations evolve and the demand for joint replacement surgeries increases.</p>

    <p>Ophthalmology (Dominant) vs. Dental (Emerging)</p>

    <p>Ophthalmology remains a dominant application in the Anesthesia Delivery Devices Market, primarily due to the high frequency of surgeries requiring anesthetic interventions, such as cataract surgery. The specialized nature of ophthalmic procedures, combined with improvements in anesthetic techniques, has bolstered the market's growth in this segment. On the other hand, the dental application is emerging, driven by an increasing number of dental surgeries and a growing focus on pain management. With advances in dental anesthesia technologies and the rising public awareness of dental health, the dental application is expected to see substantial growth, complementing its established counterparts in anesthesia delivery.</p>

    Get more detailed insights about Anesthesia Delivery Devices Market Research Report - Global Forecast to 2035

    Regional Insights

    Key Companies in the Anesthesia Delivery Devices Market market include

    Industry Developments

    November 2023:

    Getinge, a leading provider of medical technology solutions, announces the launch of its new Maquet VARIUS 3 anaesthesia machine. The VARIUS 3 is designed to provide clinicians with a more flexible and efficient way to deliver anaesthesia.

    October 2023:

    GE Healthcare announces the launch of its new Aespire 7900 anaesthesia machine. The Aespire 7900 is designed to help clinicians improve patient safety and outcomes.

    September 2023:

    Philips Healthcare announces the launch of its new IntelliVue X3 anaesthesia monitor. The IntelliVue X3 is designed to provide clinicians with a comprehensive view of patient vital signs and anaesthesia levels.August 2023: Draeger announces the launch of its new Perseus A500 anaesthesia machine. The Perseus A500 is designed to provide clinicians with a more user-friendly and intuitive anaesthesia delivery experience.

    July 2023:

    Mindray announces the launch of its new BeneVision N17 anaesthesia monitor. The BeneVision N17 is designed to provide clinicians with a wide range of monitoring capabilities, including advanced ventilation parameters and brain function monitoring.


    Future Outlook

    Anesthesia Delivery Devices Market Future Outlook

    <p>The Anesthesia Delivery Devices Market is projected to grow at a 7.12% CAGR from 2024 to 2035, driven by technological advancements, increasing surgical procedures, and rising demand for patient safety.</p>

    New opportunities lie in:

    • <p>Integration of AI for predictive analytics in anesthesia management.</p>
    • <p>Development of portable anesthesia delivery systems for outpatient settings.</p>
    • <p>Expansion into emerging markets with tailored product offerings.</p>

    <p>By 2035, the market is expected to achieve substantial growth, reflecting evolving healthcare needs and technological innovations.</p>

    Market Segmentation

    Anesthesia Delivery Devices Market Type Outlook

    • Monitoring Devices
    • Disposable Devices
    • Anesthesia Delivery Devices

    Anesthesia Delivery Devices Market End-User Outlook

    • Medical Centers
    • Clinics
    • Research Facilities

    Anesthesia Delivery Devices Market Application Outlook

    • Cardiology
    • Ophthalmology
    • Dental
    • Orthopedics

    Report Scope

    MARKET SIZE 202443.85(USD Billion)
    MARKET SIZE 202546.97(USD Billion)
    MARKET SIZE 203593.44(USD Billion)
    COMPOUND ANNUAL GROWTH RATE (CAGR)7.12% (2024 - 2035)
    REPORT COVERAGERevenue Forecast, Competitive Landscape, Growth Factors, and Trends
    BASE YEAR2024
    Market Forecast Period2025 - 2035
    Historical Data2019 - 2024
    Market Forecast UnitsUSD Billion
    Key Companies ProfiledMarket analysis in progress
    Segments CoveredMarket segmentation analysis in progress
    Key Market OpportunitiesIntegration of advanced monitoring technologies enhances safety and efficiency in the Anesthesia Delivery Devices Market.
    Key Market DynamicsTechnological advancements and regulatory changes drive innovation and competition in the anesthesia delivery devices market.
    Countries CoveredNorth America, Europe, APAC, South America, MEA

    FAQs

    What is the expected growth rate of the Global Anesthesia Delivery Devices Market?

    Anesthesia Delivery Devices Market is expected to expand at 6.42% CAGR from 2024 to 2032.

    Who are the prominent players of the Global Anesthesia Delivery Devices Market?

    Fisher and Paykel, Philips Healthcare, OSI Systems, MEDTRONIC, Sedana Medical, MAQUET Holding B.V. &amp; Co. KG., Getinge Group, Smiths Medical, Covidien plc, Teleflex, Intersurgical Ltd, Drägerwerk AG &amp; Co., ResMed, and GE Healthcare are prominent players of the global anesthesia delivery devices market.

    What is the trend engulfing the Global Anesthesia Delivery Devices Market?

    The integration of artificial intelligence to ensure the right dosage of anesthesia to patients is the trend to watch out for in the Global Anesthesia Delivery Devices Market.

    Which region can showcase the highest growth rate in the Global Anesthesia Delivery Devices Market?

    The APAC region can showcase the highest growth rate in the Global Anesthesia Delivery Devices Market due to constant development of economies and an uptick in surgeries.

    What are the major drivers of the Global Anesthesia Delivery Devices Market?

    Continuous development of anesthesia delivery devices and increasing volume of surgeries are major drivers of the Global Anesthesia Delivery Devices Market.

    1. SECTION I: EXECUTIVE SUMMARY AND KEY HIGHLIGHTS
      1. | 1.1 EXECUTIVE SUMMARY
      2. | | 1.1.1 Market Overview
      3. | | 1.1.2 Key Findings
      4. | | 1.1.3 Market Segmentation
      5. | | 1.1.4 Competitive Landscape
      6. | | 1.1.5 Challenges and Opportunities
      7. | | 1.1.6 Future Outlook
    2. SECTION II: SCOPING, METHODOLOGY AND MARKET STRUCTURE
      1. | 2.1 MARKET INTRODUCTION
      2. | | 2.1.1 Definition
      3. | | 2.1.2 Scope of the study
      4. | | | 2.1.2.1 Research Objective
      5. | | | 2.1.2.2 Assumption
      6. | | | 2.1.2.3 Limitations
      7. | 2.2 RESEARCH METHODOLOGY
      8. | | 2.2.1 Overview
      9. | | 2.2.2 Data Mining
      10. | | 2.2.3 Secondary Research
      11. | | 2.2.4 Primary Research
      12. | | | 2.2.4.1 Primary Interviews and Information Gathering Process
      13. | | | 2.2.4.2 Breakdown of Primary Respondents
      14. | | 2.2.5 Forecasting Model
      15. | | 2.2.6 Market Size Estimation
      16. | | | 2.2.6.1 Bottom-Up Approach
      17. | | | 2.2.6.2 Top-Down Approach
      18. | | 2.2.7 Data Triangulation
      19. | | 2.2.8 Validation
    3. SECTION III: QUALITATIVE ANALYSIS
      1. | 3.1 MARKET DYNAMICS
      2. | | 3.1.1 Overview
      3. | | 3.1.2 Drivers
      4. | | 3.1.3 Restraints
      5. | | 3.1.4 Opportunities
      6. | 3.2 MARKET FACTOR ANALYSIS
      7. | | 3.2.1 Value chain Analysis
      8. | | 3.2.2 Porter's Five Forces Analysis
      9. | | | 3.2.2.1 Bargaining Power of Suppliers
      10. | | | 3.2.2.2 Bargaining Power of Buyers
      11. | | | 3.2.2.3 Threat of New Entrants
      12. | | | 3.2.2.4 Threat of Substitutes
      13. | | | 3.2.2.5 Intensity of Rivalry
      14. | | 3.2.3 COVID-19 Impact Analysis
      15. | | | 3.2.3.1 Market Impact Analysis
      16. | | | 3.2.3.2 Regional Impact
      17. | | | 3.2.3.3 Opportunity and Threat Analysis
    4. SECTION IV: QUANTITATIVE ANALYSIS
      1. | 4.1 Healthcare, BY Type (USD Billion)
      2. | | 4.1.1 Monitoring Devices
      3. | | 4.1.2 Disposable Devices
      4. | | 4.1.3 Anesthesia Delivery Devices
      5. | 4.2 Healthcare, BY End-User (USD Billion)
      6. | | 4.2.1 Medical Centers
      7. | | 4.2.2 Clinics
      8. | | 4.2.3 Research Facilities
      9. | 4.3 Healthcare, BY Application (USD Billion)
      10. | | 4.3.1 Cardiology
      11. | | 4.3.2 Ophthalmology
      12. | | 4.3.3 Dental
      13. | | 4.3.4 Orthopedics
      14. | 4.4 Healthcare, BY Region (USD Billion)
      15. | | 4.4.1 North America
      16. | | | 4.4.1.1 US
      17. | | | 4.4.1.2 Canada
      18. | | 4.4.2 Europe
      19. | | | 4.4.2.1 Germany
      20. | | | 4.4.2.2 UK
      21. | | | 4.4.2.3 France
      22. | | | 4.4.2.4 Russia
      23. | | | 4.4.2.5 Italy
      24. | | | 4.4.2.6 Spain
      25. | | | 4.4.2.7 Rest of Europe
      26. | | 4.4.3 APAC
      27. | | | 4.4.3.1 China
      28. | | | 4.4.3.2 India
      29. | | | 4.4.3.3 Japan
      30. | | | 4.4.3.4 South Korea
      31. | | | 4.4.3.5 Malaysia
      32. | | | 4.4.3.6 Thailand
      33. | | | 4.4.3.7 Indonesia
      34. | | | 4.4.3.8 Rest of APAC
      35. | | 4.4.4 South America
      36. | | | 4.4.4.1 Brazil
      37. | | | 4.4.4.2 Mexico
      38. | | | 4.4.4.3 Argentina
      39. | | | 4.4.4.4 Rest of South America
      40. | | 4.4.5 MEA
      41. | | | 4.4.5.1 GCC Countries
      42. | | | 4.4.5.2 South Africa
      43. | | | 4.4.5.3 Rest of MEA
    5. SECTION V: COMPETITIVE ANALYSIS
      1. | 5.1 Competitive Landscape
      2. | | 5.1.1 Overview
      3. | | 5.1.2 Competitive Analysis
      4. | | 5.1.3 Market share Analysis
      5. | | 5.1.4 Major Growth Strategy in the Healthcare
      6. | | 5.1.5 Competitive Benchmarking
      7. | | 5.1.6 Leading Players in Terms of Number of Developments in the Healthcare
      8. | | 5.1.7 Key developments and growth strategies
      9. | | | 5.1.7.1 New Product Launch/Service Deployment
      10. | | | 5.1.7.2 Merger & Acquisitions
      11. | | | 5.1.7.3 Joint Ventures
      12. | | 5.1.8 Major Players Financial Matrix
      13. | | | 5.1.8.1 Sales and Operating Income
      14. | | | 5.1.8.2 Major Players R&D Expenditure. 2023
      15. | 5.2 Company Profiles
      16. | | 5.2.1 Medtronic (US)
      17. | | | 5.2.1.1 Financial Overview
      18. | | | 5.2.1.2 Products Offered
      19. | | | 5.2.1.3 Key Developments
      20. | | | 5.2.1.4 SWOT Analysis
      21. | | | 5.2.1.5 Key Strategies
      22. | | 5.2.2 GE Healthcare (US)
      23. | | | 5.2.2.1 Financial Overview
      24. | | | 5.2.2.2 Products Offered
      25. | | | 5.2.2.3 Key Developments
      26. | | | 5.2.2.4 SWOT Analysis
      27. | | | 5.2.2.5 Key Strategies
      28. | | 5.2.3 Philips (NL)
      29. | | | 5.2.3.1 Financial Overview
      30. | | | 5.2.3.2 Products Offered
      31. | | | 5.2.3.3 Key Developments
      32. | | | 5.2.3.4 SWOT Analysis
      33. | | | 5.2.3.5 Key Strategies
      34. | | 5.2.4 Dräger (DE)
      35. | | | 5.2.4.1 Financial Overview
      36. | | | 5.2.4.2 Products Offered
      37. | | | 5.2.4.3 Key Developments
      38. | | | 5.2.4.4 SWOT Analysis
      39. | | | 5.2.4.5 Key Strategies
      40. | | 5.2.5 Smiths Medical (US)
      41. | | | 5.2.5.1 Financial Overview
      42. | | | 5.2.5.2 Products Offered
      43. | | | 5.2.5.3 Key Developments
      44. | | | 5.2.5.4 SWOT Analysis
      45. | | | 5.2.5.5 Key Strategies
      46. | | 5.2.6 B. Braun (DE)
      47. | | | 5.2.6.1 Financial Overview
      48. | | | 5.2.6.2 Products Offered
      49. | | | 5.2.6.3 Key Developments
      50. | | | 5.2.6.4 SWOT Analysis
      51. | | | 5.2.6.5 Key Strategies
      52. | | 5.2.7 Fresenius Kabi (DE)
      53. | | | 5.2.7.1 Financial Overview
      54. | | | 5.2.7.2 Products Offered
      55. | | | 5.2.7.3 Key Developments
      56. | | | 5.2.7.4 SWOT Analysis
      57. | | | 5.2.7.5 Key Strategies
      58. | | 5.2.8 Masimo (US)
      59. | | | 5.2.8.1 Financial Overview
      60. | | | 5.2.8.2 Products Offered
      61. | | | 5.2.8.3 Key Developments
      62. | | | 5.2.8.4 SWOT Analysis
      63. | | | 5.2.8.5 Key Strategies
      64. | | 5.2.9 Nihon Kohden (JP)
      65. | | | 5.2.9.1 Financial Overview
      66. | | | 5.2.9.2 Products Offered
      67. | | | 5.2.9.3 Key Developments
      68. | | | 5.2.9.4 SWOT Analysis
      69. | | | 5.2.9.5 Key Strategies
      70. | 5.3 Appendix
      71. | | 5.3.1 References
      72. | | 5.3.2 Related Reports
    6. LIST OF FIGURES
      1. | 6.1 MARKET SYNOPSIS
      2. | 6.2 NORTH AMERICA MARKET ANALYSIS
      3. | 6.3 US MARKET ANALYSIS BY TYPE
      4. | 6.4 US MARKET ANALYSIS BY END-USER
      5. | 6.5 US MARKET ANALYSIS BY APPLICATION
      6. | 6.6 CANADA MARKET ANALYSIS BY TYPE
      7. | 6.7 CANADA MARKET ANALYSIS BY END-USER
      8. | 6.8 CANADA MARKET ANALYSIS BY APPLICATION
      9. | 6.9 EUROPE MARKET ANALYSIS
      10. | 6.10 GERMANY MARKET ANALYSIS BY TYPE
      11. | 6.11 GERMANY MARKET ANALYSIS BY END-USER
      12. | 6.12 GERMANY MARKET ANALYSIS BY APPLICATION
      13. | 6.13 UK MARKET ANALYSIS BY TYPE
      14. | 6.14 UK MARKET ANALYSIS BY END-USER
      15. | 6.15 UK MARKET ANALYSIS BY APPLICATION
      16. | 6.16 FRANCE MARKET ANALYSIS BY TYPE
      17. | 6.17 FRANCE MARKET ANALYSIS BY END-USER
      18. | 6.18 FRANCE MARKET ANALYSIS BY APPLICATION
      19. | 6.19 RUSSIA MARKET ANALYSIS BY TYPE
      20. | 6.20 RUSSIA MARKET ANALYSIS BY END-USER
      21. | 6.21 RUSSIA MARKET ANALYSIS BY APPLICATION
      22. | 6.22 ITALY MARKET ANALYSIS BY TYPE
      23. | 6.23 ITALY MARKET ANALYSIS BY END-USER
      24. | 6.24 ITALY MARKET ANALYSIS BY APPLICATION
      25. | 6.25 SPAIN MARKET ANALYSIS BY TYPE
      26. | 6.26 SPAIN MARKET ANALYSIS BY END-USER
      27. | 6.27 SPAIN MARKET ANALYSIS BY APPLICATION
      28. | 6.28 REST OF EUROPE MARKET ANALYSIS BY TYPE
      29. | 6.29 REST OF EUROPE MARKET ANALYSIS BY END-USER
      30. | 6.30 REST OF EUROPE MARKET ANALYSIS BY APPLICATION
      31. | 6.31 APAC MARKET ANALYSIS
      32. | 6.32 CHINA MARKET ANALYSIS BY TYPE
      33. | 6.33 CHINA MARKET ANALYSIS BY END-USER
      34. | 6.34 CHINA MARKET ANALYSIS BY APPLICATION
      35. | 6.35 INDIA MARKET ANALYSIS BY TYPE
      36. | 6.36 INDIA MARKET ANALYSIS BY END-USER
      37. | 6.37 INDIA MARKET ANALYSIS BY APPLICATION
      38. | 6.38 JAPAN MARKET ANALYSIS BY TYPE
      39. | 6.39 JAPAN MARKET ANALYSIS BY END-USER
      40. | 6.40 JAPAN MARKET ANALYSIS BY APPLICATION
      41. | 6.41 SOUTH KOREA MARKET ANALYSIS BY TYPE
      42. | 6.42 SOUTH KOREA MARKET ANALYSIS BY END-USER
      43. | 6.43 SOUTH KOREA MARKET ANALYSIS BY APPLICATION
      44. | 6.44 MALAYSIA MARKET ANALYSIS BY TYPE
      45. | 6.45 MALAYSIA MARKET ANALYSIS BY END-USER
      46. | 6.46 MALAYSIA MARKET ANALYSIS BY APPLICATION
      47. | 6.47 THAILAND MARKET ANALYSIS BY TYPE
      48. | 6.48 THAILAND MARKET ANALYSIS BY END-USER
      49. | 6.49 THAILAND MARKET ANALYSIS BY APPLICATION
      50. | 6.50 INDONESIA MARKET ANALYSIS BY TYPE
      51. | 6.51 INDONESIA MARKET ANALYSIS BY END-USER
      52. | 6.52 INDONESIA MARKET ANALYSIS BY APPLICATION
      53. | 6.53 REST OF APAC MARKET ANALYSIS BY TYPE
      54. | 6.54 REST OF APAC MARKET ANALYSIS BY END-USER
      55. | 6.55 REST OF APAC MARKET ANALYSIS BY APPLICATION
      56. | 6.56 SOUTH AMERICA MARKET ANALYSIS
      57. | 6.57 BRAZIL MARKET ANALYSIS BY TYPE
      58. | 6.58 BRAZIL MARKET ANALYSIS BY END-USER
      59. | 6.59 BRAZIL MARKET ANALYSIS BY APPLICATION
      60. | 6.60 MEXICO MARKET ANALYSIS BY TYPE
      61. | 6.61 MEXICO MARKET ANALYSIS BY END-USER
      62. | 6.62 MEXICO MARKET ANALYSIS BY APPLICATION
      63. | 6.63 ARGENTINA MARKET ANALYSIS BY TYPE
      64. | 6.64 ARGENTINA MARKET ANALYSIS BY END-USER
      65. | 6.65 ARGENTINA MARKET ANALYSIS BY APPLICATION
      66. | 6.66 REST OF SOUTH AMERICA MARKET ANALYSIS BY TYPE
      67. | 6.67 REST OF SOUTH AMERICA MARKET ANALYSIS BY END-USER
      68. | 6.68 REST OF SOUTH AMERICA MARKET ANALYSIS BY APPLICATION
      69. | 6.69 MEA MARKET ANALYSIS
      70. | 6.70 GCC COUNTRIES MARKET ANALYSIS BY TYPE
      71. | 6.71 GCC COUNTRIES MARKET ANALYSIS BY END-USER
      72. | 6.72 GCC COUNTRIES MARKET ANALYSIS BY APPLICATION
      73. | 6.73 SOUTH AFRICA MARKET ANALYSIS BY TYPE
      74. | 6.74 SOUTH AFRICA MARKET ANALYSIS BY END-USER
      75. | 6.75 SOUTH AFRICA MARKET ANALYSIS BY APPLICATION
      76. | 6.76 REST OF MEA MARKET ANALYSIS BY TYPE
      77. | 6.77 REST OF MEA MARKET ANALYSIS BY END-USER
      78. | 6.78 REST OF MEA MARKET ANALYSIS BY APPLICATION
      79. | 6.79 KEY BUYING CRITERIA OF HEALTHCARE
      80. | 6.80 RESEARCH PROCESS OF MRFR
      81. | 6.81 DRO ANALYSIS OF HEALTHCARE
      82. | 6.82 DRIVERS IMPACT ANALYSIS: HEALTHCARE
      83. | 6.83 RESTRAINTS IMPACT ANALYSIS: HEALTHCARE
      84. | 6.84 SUPPLY / VALUE CHAIN: HEALTHCARE
      85. | 6.85 HEALTHCARE, BY TYPE, 2024 (% SHARE)
      86. | 6.86 HEALTHCARE, BY TYPE, 2024 TO 2035 (USD Billion)
      87. | 6.87 HEALTHCARE, BY END-USER, 2024 (% SHARE)
      88. | 6.88 HEALTHCARE, BY END-USER, 2024 TO 2035 (USD Billion)
      89. | 6.89 HEALTHCARE, BY APPLICATION, 2024 (% SHARE)
      90. | 6.90 HEALTHCARE, BY APPLICATION, 2024 TO 2035 (USD Billion)
      91. | 6.91 BENCHMARKING OF MAJOR COMPETITORS
    7. LIST OF TABLES
      1. | 7.1 LIST OF ASSUMPTIONS
      2. | | 7.1.1
      3. | 7.2 North America MARKET SIZE ESTIMATES; FORECAST
      4. | | 7.2.1 BY TYPE, 2025-2035 (USD Billion)
      5. | | 7.2.2 BY END-USER, 2025-2035 (USD Billion)
      6. | | 7.2.3 BY APPLICATION, 2025-2035 (USD Billion)
      7. | 7.3 US MARKET SIZE ESTIMATES; FORECAST
      8. | | 7.3.1 BY TYPE, 2025-2035 (USD Billion)
      9. | | 7.3.2 BY END-USER, 2025-2035 (USD Billion)
      10. | | 7.3.3 BY APPLICATION, 2025-2035 (USD Billion)
      11. | 7.4 Canada MARKET SIZE ESTIMATES; FORECAST
      12. | | 7.4.1 BY TYPE, 2025-2035 (USD Billion)
      13. | | 7.4.2 BY END-USER, 2025-2035 (USD Billion)
      14. | | 7.4.3 BY APPLICATION, 2025-2035 (USD Billion)
      15. | 7.5 Europe MARKET SIZE ESTIMATES; FORECAST
      16. | | 7.5.1 BY TYPE, 2025-2035 (USD Billion)
      17. | | 7.5.2 BY END-USER, 2025-2035 (USD Billion)
      18. | | 7.5.3 BY APPLICATION, 2025-2035 (USD Billion)
      19. | 7.6 Germany MARKET SIZE ESTIMATES; FORECAST
      20. | | 7.6.1 BY TYPE, 2025-2035 (USD Billion)
      21. | | 7.6.2 BY END-USER, 2025-2035 (USD Billion)
      22. | | 7.6.3 BY APPLICATION, 2025-2035 (USD Billion)
      23. | 7.7 UK MARKET SIZE ESTIMATES; FORECAST
      24. | | 7.7.1 BY TYPE, 2025-2035 (USD Billion)
      25. | | 7.7.2 BY END-USER, 2025-2035 (USD Billion)
      26. | | 7.7.3 BY APPLICATION, 2025-2035 (USD Billion)
      27. | 7.8 France MARKET SIZE ESTIMATES; FORECAST
      28. | | 7.8.1 BY TYPE, 2025-2035 (USD Billion)
      29. | | 7.8.2 BY END-USER, 2025-2035 (USD Billion)
      30. | | 7.8.3 BY APPLICATION, 2025-2035 (USD Billion)
      31. | 7.9 Russia MARKET SIZE ESTIMATES; FORECAST
      32. | | 7.9.1 BY TYPE, 2025-2035 (USD Billion)
      33. | | 7.9.2 BY END-USER, 2025-2035 (USD Billion)
      34. | | 7.9.3 BY APPLICATION, 2025-2035 (USD Billion)
      35. | 7.10 Italy MARKET SIZE ESTIMATES; FORECAST
      36. | | 7.10.1 BY TYPE, 2025-2035 (USD Billion)
      37. | | 7.10.2 BY END-USER, 2025-2035 (USD Billion)
      38. | | 7.10.3 BY APPLICATION, 2025-2035 (USD Billion)
      39. | 7.11 Spain MARKET SIZE ESTIMATES; FORECAST
      40. | | 7.11.1 BY TYPE, 2025-2035 (USD Billion)
      41. | | 7.11.2 BY END-USER, 2025-2035 (USD Billion)
      42. | | 7.11.3 BY APPLICATION, 2025-2035 (USD Billion)
      43. | 7.12 Rest of Europe MARKET SIZE ESTIMATES; FORECAST
      44. | | 7.12.1 BY TYPE, 2025-2035 (USD Billion)
      45. | | 7.12.2 BY END-USER, 2025-2035 (USD Billion)
      46. | | 7.12.3 BY APPLICATION, 2025-2035 (USD Billion)
      47. | 7.13 APAC MARKET SIZE ESTIMATES; FORECAST
      48. | | 7.13.1 BY TYPE, 2025-2035 (USD Billion)
      49. | | 7.13.2 BY END-USER, 2025-2035 (USD Billion)
      50. | | 7.13.3 BY APPLICATION, 2025-2035 (USD Billion)
      51. | 7.14 China MARKET SIZE ESTIMATES; FORECAST
      52. | | 7.14.1 BY TYPE, 2025-2035 (USD Billion)
      53. | | 7.14.2 BY END-USER, 2025-2035 (USD Billion)
      54. | | 7.14.3 BY APPLICATION, 2025-2035 (USD Billion)
      55. | 7.15 India MARKET SIZE ESTIMATES; FORECAST
      56. | | 7.15.1 BY TYPE, 2025-2035 (USD Billion)
      57. | | 7.15.2 BY END-USER, 2025-2035 (USD Billion)
      58. | | 7.15.3 BY APPLICATION, 2025-2035 (USD Billion)
      59. | 7.16 Japan MARKET SIZE ESTIMATES; FORECAST
      60. | | 7.16.1 BY TYPE, 2025-2035 (USD Billion)
      61. | | 7.16.2 BY END-USER, 2025-2035 (USD Billion)
      62. | | 7.16.3 BY APPLICATION, 2025-2035 (USD Billion)
      63. | 7.17 South Korea MARKET SIZE ESTIMATES; FORECAST
      64. | | 7.17.1 BY TYPE, 2025-2035 (USD Billion)
      65. | | 7.17.2 BY END-USER, 2025-2035 (USD Billion)
      66. | | 7.17.3 BY APPLICATION, 2025-2035 (USD Billion)
      67. | 7.18 Malaysia MARKET SIZE ESTIMATES; FORECAST
      68. | | 7.18.1 BY TYPE, 2025-2035 (USD Billion)
      69. | | 7.18.2 BY END-USER, 2025-2035 (USD Billion)
      70. | | 7.18.3 BY APPLICATION, 2025-2035 (USD Billion)
      71. | 7.19 Thailand MARKET SIZE ESTIMATES; FORECAST
      72. | | 7.19.1 BY TYPE, 2025-2035 (USD Billion)
      73. | | 7.19.2 BY END-USER, 2025-2035 (USD Billion)
      74. | | 7.19.3 BY APPLICATION, 2025-2035 (USD Billion)
      75. | 7.20 Indonesia MARKET SIZE ESTIMATES; FORECAST
      76. | | 7.20.1 BY TYPE, 2025-2035 (USD Billion)
      77. | | 7.20.2 BY END-USER, 2025-2035 (USD Billion)
      78. | | 7.20.3 BY APPLICATION, 2025-2035 (USD Billion)
      79. | 7.21 Rest of APAC MARKET SIZE ESTIMATES; FORECAST
      80. | | 7.21.1 BY TYPE, 2025-2035 (USD Billion)
      81. | | 7.21.2 BY END-USER, 2025-2035 (USD Billion)
      82. | | 7.21.3 BY APPLICATION, 2025-2035 (USD Billion)
      83. | 7.22 South America MARKET SIZE ESTIMATES; FORECAST
      84. | | 7.22.1 BY TYPE, 2025-2035 (USD Billion)
      85. | | 7.22.2 BY END-USER, 2025-2035 (USD Billion)
      86. | | 7.22.3 BY APPLICATION, 2025-2035 (USD Billion)
      87. | 7.23 Brazil MARKET SIZE ESTIMATES; FORECAST
      88. | | 7.23.1 BY TYPE, 2025-2035 (USD Billion)
      89. | | 7.23.2 BY END-USER, 2025-2035 (USD Billion)
      90. | | 7.23.3 BY APPLICATION, 2025-2035 (USD Billion)
      91. | 7.24 Mexico MARKET SIZE ESTIMATES; FORECAST
      92. | | 7.24.1 BY TYPE, 2025-2035 (USD Billion)
      93. | | 7.24.2 BY END-USER, 2025-2035 (USD Billion)
      94. | | 7.24.3 BY APPLICATION, 2025-2035 (USD Billion)
      95. | 7.25 Argentina MARKET SIZE ESTIMATES; FORECAST
      96. | | 7.25.1 BY TYPE, 2025-2035 (USD Billion)
      97. | | 7.25.2 BY END-USER, 2025-2035 (USD Billion)
      98. | | 7.25.3 BY APPLICATION, 2025-2035 (USD Billion)
      99. | 7.26 Rest of South America MARKET SIZE ESTIMATES; FORECAST
      100. | | 7.26.1 BY TYPE, 2025-2035 (USD Billion)
      101. | | 7.26.2 BY END-USER, 2025-2035 (USD Billion)
      102. | | 7.26.3 BY APPLICATION, 2025-2035 (USD Billion)
      103. | 7.27 MEA MARKET SIZE ESTIMATES; FORECAST
      104. | | 7.27.1 BY TYPE, 2025-2035 (USD Billion)
      105. | | 7.27.2 BY END-USER, 2025-2035 (USD Billion)
      106. | | 7.27.3 BY APPLICATION, 2025-2035 (USD Billion)
      107. | 7.28 GCC Countries MARKET SIZE ESTIMATES; FORECAST
      108. | | 7.28.1 BY TYPE, 2025-2035 (USD Billion)
      109. | | 7.28.2 BY END-USER, 2025-2035 (USD Billion)
      110. | | 7.28.3 BY APPLICATION, 2025-2035 (USD Billion)
      111. | 7.29 South Africa MARKET SIZE ESTIMATES; FORECAST
      112. | | 7.29.1 BY TYPE, 2025-2035 (USD Billion)
      113. | | 7.29.2 BY END-USER, 2025-2035 (USD Billion)
      114. | | 7.29.3 BY APPLICATION, 2025-2035 (USD Billion)
      115. | 7.30 Rest of MEA MARKET SIZE ESTIMATES; FORECAST
      116. | | 7.30.1 BY TYPE, 2025-2035 (USD Billion)
      117. | | 7.30.2 BY END-USER, 2025-2035 (USD Billion)
      118. | | 7.30.3 BY APPLICATION, 2025-2035 (USD Billion)
      119. | 7.31 PRODUCT LAUNCH/PRODUCT DEVELOPMENT/APPROVAL
      120. | | 7.31.1
      121. | 7.32 ACQUISITION/PARTNERSHIP
      122. | | 7.32.1

    Anesthesia Delivery Devices Market Segmentation

    Market Segmentation Overview

    • Detailed segmentation data will be available in the full report
    • Comprehensive analysis by multiple parameters
    • Regional and country-level breakdowns
    • Market size forecasts by segment
    Infographic

    Free Sample Request

    Kindly complete the form below to receive a free sample of this Report

    Get Free Sample

    Customer Strories

    “I am very pleased with how market segments have been defined in a relevant way for my purposes (such as "Portable Freezers & refrigerators" and "last-mile"). In general the report is well structured. Thanks very much for your efforts.”

    Victoria Milne

    Founder
    Case Study
    Chemicals and Materials

    Compare Licence

    ×
    Features License Type
    Single User Multiuser License Enterprise User
    Price $4,950 $5,950 $7,250
    Maximum User Access Limit 1 User Upto 10 Users Unrestricted Access Throughout the Organization
    Free Customization
    Direct Access to Analyst
    Deliverable Format
    Platform Access
    Discount on Next Purchase 10% 15% 15%
    Printable Versions