• Cat-intel
  • MedIntelliX
  • Resources
  • About Us
  • Request Free Sample ×

    Kindly complete the form below to receive a free sample of this Report

    Leading companies partner with us for data-driven Insights

    clients tt-cursor

    Ancillary Services Power Market

    ID: MRFR/E&P/10593-HCR
    128 Pages
    Garvit Vyas
    September 2025

    Ancillary Services Power Market Research Report By Service Type (Frequency Regulation, Voltage Support, Reactive Power Supply, Black Start Services), By Technology (Energy Storage Systems, Demand Response, Smart Grids, Distributed Generation), By Market Application (Utilities, Independent System Operators, Electricity Retailers), By End Use Sector (Residential, Commercial, Industrial) and By Regional (North America, Europe, South America, Asia Pacific, Middle East and Africa) - Forecast to 2035

    Share:
    Download PDF ×

    We do not share your information with anyone. However, we may send you emails based on your report interest from time to time. You may contact us at any time to opt-out.

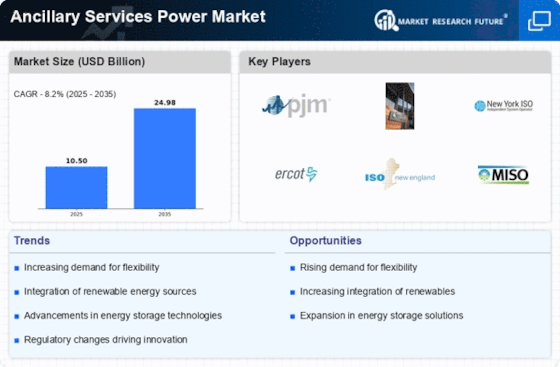
    Ancillary Services Power Market Research Report – Forecast till 2035 Infographic
    Purchase Options
    $ 4,950.0
    $ 5,950.0
    $ 7,250.0
    Table of Contents

    Ancillary Services Power Market Summary

    As per Market Research Future Analysis, the Ancillary Services Power Market was valued at 32.53 USD Billion in 2023 and is projected to grow to 55 USD Billion by 2035, reflecting a CAGR of 4.48% from 2025 to 2035. The market is driven by the increasing integration of renewable energy sources, the demand for grid stability, and supportive regulatory frameworks.

    Key Market Trends & Highlights

    The Ancillary Services Power Market is witnessing transformative trends driven by technology and regulatory changes.

    • Frequency Regulation is expected to grow from 10.5 USD Billion in 2024 to 17.2 USD Billion by 2035.
    • Voltage Support is projected to increase from 8.6 USD Billion in 2024 to 14.0 USD Billion by 2035.
    • Energy Storage Systems are critical for balancing supply and demand, enhancing grid reliability.
    • North America leads the market with a valuation of 12.0 USD Billion in 2024, expected to reach 18.8 USD Billion by 2035.

    Market Size & Forecast

    2023 Market Size USD 32.53 Billion
    2024 Market Size USD 33.99 Billion
    2035 Market Size USD 55 Billion
    CAGR (2025-2035) 4.48%

    Major Players

    Key companies include NextEra Energy, Xcel Energy, Pacific Gas and Electric, FirstEnergy, AES Corporation, Entergy, Enel, National Grid, Southern Company, Exelon, NRG Energy, Edison International, PSEG, Engie, and Duke Energy.

    Ancillary Services Power Market Trends

    As utilities upgrade their infrastructure, there is substantial potential for service providers to offer innovative solutions and products. The ongoing evolution of regulatory standards can also introduce new service requirements, creating niches for specialized ancillary service providers. Recent trends indicate a shift toward a more collaborative approach among market participants, including utilities, energy producers, and technology firms, all aimed at enhancing the efficiency and effectiveness of ancillary services in global markets.

    The need for enhanced services due to the attractions of microgrids and energy management systems underscores the dynamic nature of the ancillary services landscape and offers multiple pathways for growth.

    The evolution of the ancillary services power market is driven by the increasing integration of renewable energy sources, which necessitates enhanced grid reliability and flexibility to accommodate variable generation.

    U.S. Department of Energy

    Ancillary Services Power Market Drivers

    Market Charts and Trends

    Growing Demand for Renewable Energy

    The Global Ancillary Services Power Market Industry is experiencing a notable surge in demand for renewable energy sources. As countries strive to meet their climate goals, the integration of renewable energy into the grid becomes increasingly essential. This shift necessitates ancillary services to maintain grid stability and reliability. For instance, the global renewable energy capacity is projected to reach unprecedented levels, driving the need for ancillary services to support this transition. The market is expected to reach 34.0 USD Billion in 2024, reflecting the growing importance of these services in facilitating the integration of renewables into the energy mix.

    Regulatory Support and Policy Frameworks

    Regulatory support and robust policy frameworks play a pivotal role in shaping the Global Ancillary Services Power Market Industry. Governments worldwide are implementing policies that encourage the development and deployment of ancillary services, recognizing their importance in ensuring grid reliability and resilience. Incentives for energy efficiency and renewable integration are becoming more common, fostering an environment conducive to market growth. For instance, various countries are establishing regulatory standards that mandate the provision of ancillary services by utilities. This supportive landscape is expected to drive the market's expansion, with a projected CAGR of 4.47% from 2025 to 2035.

    Technological Advancements in Energy Storage

    Technological advancements in energy storage solutions are significantly influencing the Global Ancillary Services Power Market Industry. Innovations in battery technology and energy management systems enhance the ability to store and dispatch energy efficiently. This capability is crucial for balancing supply and demand, particularly with the increasing penetration of intermittent renewable sources. For example, the deployment of advanced lithium-ion batteries is becoming more prevalent, enabling utilities to provide ancillary services more effectively. As these technologies continue to evolve, they are likely to contribute to the market's growth, with projections indicating a market size of 55 USD Billion by 2035.

    Increasing Grid Complexity and Interconnectivity

    The increasing complexity and interconnectivity of power grids are driving the demand for ancillary services within the Global Ancillary Services Power Market Industry. As grids evolve to accommodate diverse energy sources and decentralized generation, the need for ancillary services to manage these complexities becomes paramount. Enhanced interconnectivity allows for greater energy exchange between regions, necessitating robust ancillary services to ensure stability and reliability. This trend is particularly evident in regions with high renewable penetration, where ancillary services are critical for balancing fluctuations in generation and demand. The market is poised for growth as utilities adapt to these challenges.

    Market Segment Insights

    Ancillary Services Power Market Service Type Insights 

    The Ancillary Services Power Market has seen substantial growth, particularly within the Service Type segment, which includes crucial aspects such as Frequency Regulation, Voltage Support, Reactive Power Supply, and Black Start Services. By 2024, the total market valuation is set at 33.99 USD Billion and is projected to rise to 55.0 USD Billion by 2035. Among the various components, Frequency Regulation stands out, holding a valuation of 10.0 USD Billion in 2024 and is expected to reach 16.0 USD Billion by 2035.

    This service type plays a vital role in maintaining the balance between electricity supply and demand, ensuring grid stability and reliability, which is essential for modern power systems with a growing incorporation of renewable energy sources.

    Voltage Support is also significant, with a market valuation anticipated at 9.0 USD Billion in 2024, increasing to 14.0 USD Billion in 2035. This service helps mitigate voltage fluctuations, thus maintaining operational safety and the quality of power distribution, which is particularly important in densely populated regions. Reactive Power Supply, valued at 7.0 USD Billion in 2024 and projected to grow to 12.0 USD Billion in 2035, supports voltage levels necessary for efficient electricity transmission. This service aids in reducing losses and enhancing the overall efficiency of power systems.

    Black Start Services, valued at 7.99 USD Billion in 2024 and expected to reach 13.0 USD Billion by 2035, are geared towards the recovery of the electrical grid following a complete shutdown. This sub-segment holds increasing importance as global energy infrastructure becomes more susceptible to outages caused by natural disasters or cyber-attacks. The growth dynamics of the Ancillary Services Power Market statistics reveal a consistent dependency on efficient ancillary services to enhance overall system reliability, presenting significant opportunities for stakeholders navigating the evolving energy landscape.

    These services not only facilitate the integration of renewable energy but also improve grid resilience, thereby asserting their importance in the ongoing energy transition. The market's growth is driven by regulatory mandates for grid reliability, the integration of intermittent renewable energy sources, and increasing investments in smart grid technologies. Challenges include potential limitations in resources and the need for innovation in ancillary services, highlighting opportunities for advancements in technology and service delivery models within the industry.

    Ancillary Services Power Market Technology Insights  

    The Ancillary Services Power Market is experiencing notable advancements, particularly in the Technology segment, which encompasses vital innovations such as Energy Storage Systems, Demand Response, Smart Grids, and Distributed Generation. With a market value reaching 33.99 USD Billion in 2024 and projected to grow, this segment plays a crucial role in optimizing grid stability and efficiency. Energy Storage Systems are becoming essential for balancing supply and demand, especially with the increasing integration of renewable energy sources.

    Demand Response strategies aid in adjusting consumer electricity usage during peak periods, thereby reducing strain on the grid. Smart Grids facilitate real-time communication between utilities and customers, enhancing overall service reliability and efficiency. Lastly, Distributed Generation allows for localized energy production, reducing transmission losses and fostering energy independence.

    The combination of these technologies is driving the evolution of the Ancillary Services Power Market, creating opportunities for enhanced sustainability, reduced operational costs, and improved energy management practices across the globe.The continuous development within this Technology segment underlines its pivotal role in shaping future energy landscapes, responding to the growing needs for resilience and adaptability in electricity systems globally.

    Ancillary Services Power Market Market Application Insights  

    The Ancillary Services Power Market is poised for substantial growth, with a valuation reaching 33.99 USD Billion by 2024 and expected to grow significantly by 2035. This market consists of various applications, notably dominated by Utilities, Independent System Operators, and Electricity Retailers. Utilities play a critical role in offering reliable services and ensuring grid stability, while Independent System Operators are essential for regulating market operations and facilitating fair competition. Electricity Retailers are increasingly significant as they connect consumers with energy suppliers, promoting efficiency and customer engagement.

    As the global push for renewable energy and smart grid technologies accelerates, opportunities arise for these segments to innovate and enhance service delivery. However, challenges such as regulatory policies and market volatility persist. The Ancillary Services Power Market revenue demonstrates a growing trend, supported by increasing demand for reliable energy services amidst transformation in the energy landscape. The segmentation within this market illustrates the dynamic interplay between various stakeholders striving to optimize operations and contribute to overall energy resilience and sustainability.

    Ancillary Services Power Market End Use Sector Insights  

    The Ancillary Services Power Market, valued at approximately 33.99 USD Billion in 2024, is segmented into various end use sectors, mainly encompassing Residential, Commercial, and Industrial categories. The significance of these segments is driven by the increasing demand for a consistent power supply and stability in the electrical grid. Residential usage focuses on maintaining a reliable energy source for households, promoting energy efficiency technologies and smart grid developments. The Commercial segment plays a crucial role in managing operational costs through energy-saving practices and optimizing energy consumption, being vital for businesses to maintain competitiveness.

    Lastly, the Industrial sector significantly influences the majority of the market due to its heavy reliance on a continuous and dependable power supply for manufacturing and processes. With evolving technological advancements and supportive government policies globally, these segments are expected to witness substantial growth. The market growth in these areas is influenced by ongoing trends like renewable energy integration, increased automation, and regulatory frameworks aimed at energy conservation and sustainability, ensuring the ancillary services market adapts to changing needs and demands globally.

    Get more detailed insights about Ancillary Services Power Market Research Report – Forecast till 2035

    Regional Insights

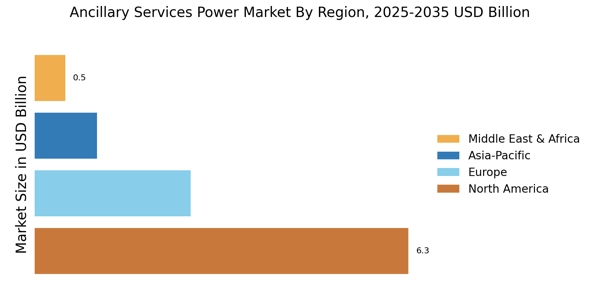
    The Ancillary Services Power Market showcases considerable regional diversification with significant valuations projected for 2024 and 2035. In 2024, North America leads with a considerable valuation of 12.5 USD Billion, expected to rise to 20.0 USD Billion by 2035, primarily due to its robust energy infrastructure and integration of renewable energy sources. Europe follows closely with a market value of 10.0 USD Billion in 2024, anticipated to reach 16.0 USD Billion by 2035, driven by stringent regulations aimed at enhancing energy efficiency and sustainability.

    Asia Pacific is evolving rapidly, with a valuation of 6.0 USD Billion in 2024 and a growth to 10.5 USD Billion by 2035, propelled by urbanization and increasing demand for energy services. In South America, the market is valued at 3.0 USD Billion in 2024 and is expected to increase to 5.0 USD Billion by 2035, reflecting opportunities in energy development.

    Lastly, the Middle East and Africa present a growing market with a valuation of 2.49 USD Billion in 2024 and projected growth to 3.5 USD Billion by 2035, emphasizing the region's potential as energy demand continues to rise in emerging economies.

    The Ancillary Services Power Market segmentation highlights North America's majority holding and Europe’s significant regulatory environment, underscoring their relevance in shaping the ancillary services landscape globally.

    Ancillary Services Power Market Regional Insights

    Source: Primary Research, Secondary Research, MRFR Database and Analyst Review

    Key Players and Competitive Insights

    The Ancillary Services Power Market has been experiencing transformative changes, driven by the growing need for grid stability and reliability in the face of increasing renewable energy generation. This market encompasses a variety of services that support the transmission of electric power from producers to consumers while maintaining the reliability of the grid. In light of the global push towards decarbonization and renewable energy integration, ancillary services have emerged as critical components that facilitate the efficient operation of power systems.

    Competitive insights within this domain reveal a landscape where companies seek to enhance their technological capabilities, optimize operational efficiencies, and establish strategic partnerships. Furthermore, innovation in energy storage, demand response, and advanced grid management solutions is pivotal for stakeholders aiming to gain a competitive edge in the market.

    NextEra Energy has established a formidable presence in the Ancillary Services Power Market through its substantial investments in renewable energy and advanced grid technologies. The company leverages its extensive portfolio of wind and solar projects to provide ancillary services, thus ensuring the stability of power grids while meeting the rising demand for clean energy solutions. NextEra Energy’s strategic focus on innovation positions it as a leader, evidenced by its significant capabilities in energy storage and demand response mechanisms. By optimizing asset management and integrating advanced forecasting tools, the company enhances the reliability of ancillary services, thereby strengthening its market position.

    As it continues to expand its operations, NextEra Energy remains committed to maintaining a competitive advantage through a robust emphasis on sustainability and technological advancement.

    Enel SpA plays a crucial role in the Ancillary Services Power Market, characterized by its diversified energy portfolio and commitment to sustainable development. The company is renowned for integrating cutting-edge technologies into its operations, such as smart grids and advanced energy management systems, which optimize the delivery of ancillary services. Enel SpA’s strategic initiatives include mergers and acquisitions that enhance its market presence and capacity for innovation in the provision of ancillary services. Offering a comprehensive range of services, including frequency regulation, voltage control, and reserve power, the company adeptly positions itself to meet various grid needs across global markets.

    Its proactive approach to digital transformation ensures efficient service delivery and enhances reliability, further solidifying its competitive standing in the ancillary services sector.

    Key Companies in the Ancillary Services Power Market market include

    Industry Developments

    Recent developments in the Ancillary Services Power Market have been marked by significant activities from key players like NextEra Energy, Enel SpA, and General Electric. In October 2023, Enel SpA announced its plans to expand its renewable energy offerings, which are expected to enhance its ancillary services capabilities. Meanwhile, Siemens AG has been investing heavily in digital solutions that complement its ancillary services, aiming to drive market growth. The valuation in the ancillary services sector has increased notably, with Brookfield Renewable Partners and RWE AG seeing strong growth due to their strategic initiatives in energy transition.

    Additionally, a merger between Exelon Corporation and Southern Company is expected to bolster operational synergies in ancillary services, as announced in August 2023. In recent years, major happenings, such as Schneider Electric's partnership with Duke Energy in June 2022 to enhance grid reliability, have also impacted the market by promoting innovative solutions in ancillary services. These developments indicate a robust evolution within the Ancillary Services Power Market, demonstrating a focus on sustainability and technological advancement as key drivers of progress.

    Future Outlook

    Ancillary Services Power Market Future Outlook

    The Ancillary Services Power Market is projected to grow at a 4.47% CAGR from 2024 to 2035, driven by increasing renewable energy integration, regulatory support, and technological advancements.

    New opportunities lie in:

    • Develop innovative demand response solutions to optimize energy consumption.
    • Invest in energy storage technologies to enhance grid reliability.
    • Leverage AI for predictive analytics in ancillary service management.

    By 2035, the Ancillary Services Power Market is expected to be robust, reflecting substantial growth and innovation.

    Market Segmentation

    Ancillary Services Power Market Regional Outlook

    • North America
    • Europe
    • South America
    • Asia Pacific
    • Middle East and Africa

    Ancillary Services Power Market Technology Outlook

    • Energy Storage Systems
    • Demand Response
    • Smart Grids
    • Distributed Generation

    Ancillary Services Power Market Service Type Outlook

    • Frequency Regulation
    • Voltage Support
    • Reactive Power Supply
    • Black Start Services

    Ancillary Services Power Market End Use Sector Outlook

    • Residential
    • Commercial
    • Industrial

    Ancillary Services Power Market Market Application Outlook

    • Utilities
    • Independent System Operators
    • Electricity Retailers

    Report Scope

    Report Attribute/Metric Details
    Market Size 2023 32.53(USD Billion)
    Market Size 2024 33.99(USD Billion)
    Market Size 2035 55.0(USD Billion)
    Compound Annual Growth Rate (CAGR) 4.47% (2025 - 2035)
    Report Coverage Revenue Forecast, Competitive Landscape, Growth Factors, and Trends
    Base Year 2024
    Market Forecast Period 2025 - 2035
    Historical Data 2019 - 2024
    Market Forecast Units USD Billion
    Key Companies Profiled NextEra Energy, Enel SpA, Brookfield Renewable Partners, General Electric, RWE AG, ABB Ltd, Exelon Corporation, Schneider Electric, Siemens AG, Iberdrola, FirstEnergy Corporation, Vestas Wind Systems, Southern Company, Duke Energy, Eaton Corporation
    Segments Covered Service Type, Technology, Market Application, End Use Sector, Regional
    Key Market Opportunities Renewable energy integration support, Smart grid technology adoption, Regulatory framework enhancements, Energy storage solutions development, Demand response management expansion
    Key Market Dynamics Regulatory frameworks, Renewable energy integration, Technological advancements, Market competition, Consumer demand fluctuations
    Countries Covered North America, Europe, APAC, South America, MEA

    Market Highlights

    Author
    Garvit Vyas
    Analyst

    Explore the profile of Garvit Vyas, one of our esteemed authors at Market Research Future, and access their expert research contributions in the field of market research and industry analysis

    Leave a Comment

    FAQs

    What is the expected market size of the Global Ancillary Services Power Market by 2035?

    The Global Ancillary Services Power Market is expected to reach a value of 55.0 USD Billion by 2035.

    What is the projected compound annual growth rate (CAGR) for the Global Ancillary Services Power Market from 2025 to 2035?

    The market is anticipated to grow at a CAGR of 4.47% from 2025 to 2035.

    Which region is expected to dominate the Global Ancillary Services Power Market by 2035?

    North America is expected to hold the largest market share, valued at 20.0 USD Billion by 2035.

    What was the market value of Frequency Regulation in the year 2024, and what is it projected to be in 2035?

    Frequency Regulation was valued at 10.0 USD Billion in 2024 and is expected to reach 16.0 USD Billion in 2035.

    Who are the major players operating in the Global Ancillary Services Power Market?

    Key players include NextEra Energy, Enel SpA, Brookfield Renewable Partners, and General Electric, among others.

    What is the expected market value for Voltage Support in 2035?

    The market value for Voltage Support is projected to be 14.0 USD Billion by 2035.

    How much is the South American market for Ancillary Services Power expected to grow by 2035?

    The South American market is expected to increase to 5.0 USD Billion by 2035.

    What are the projected market values for Reactive Power Supply and Black Start Services by 2035?

    Reactive Power Supply is expected to be valued at 12.0 USD Billion and Black Start Services at 13.0 USD Billion by 2035.

    Which region is forecasted to have the smallest market size for Ancillary Services Power by 2035?

    The Middle East and Africa are projected to have the smallest market size, valued at 3.5 USD Billion by 2035.

    What growth opportunities exist in the Global Ancillary Services Power Market?

    Emerging trends in renewable energy integration and technology advancements present growth opportunities in the market.

    1. EXECUTIVE SUMMARY
      1. Market Overview
      2. Key Findings
      3. Market Segmentation
      4. Competitive Landscape
      5. Challenges and Opportunities
      6. Future Outlook
    2. MARKET INTRODUCTION
      1. Definition
      2. Scope of the study
        1. Research Objective
        2. Assumption
        3. Limitations
    3. RESEARCH METHODOLOGY
      1. Overview
      2. Data Mining
    4. Secondary Research
      1. Primary Research
        1. Primary Interviews and
    5. Information Gathering Process
      1. Breakdown of Primary Respondents
      2. Forecasting Model
      3. Market Size Estimation
        1. Bottom-Up
    6. Approach
      1. Top-Down Approach
      2. Data Triangulation
    7. Validation
    8. MARKET DYNAMICS
      1. Overview
      2. Drivers
      3. Restraints
      4. Opportunities
    9. MARKET FACTOR ANALYSIS
      1. Value chain Analysis
      2. Porter's Five Forces Analysis
    10. Bargaining Power of Suppliers
      1. Bargaining Power of Buyers
    11. Threat of New Entrants
      1. Threat of Substitutes
        1. Intensity
    12. of Rivalry
      1. COVID-19 Impact Analysis
        1. Market Impact Analysis
        2. Regional Impact
        3. Opportunity and Threat Analysis
    13. ANCILLARY SERVICES POWER MARKET, BY SERVICE TYPE (USD BILLION)
    14. Frequency Regulation
      1. Voltage Support
      2. Reactive Power Supply
      3. Black Start Services
    15. ANCILLARY SERVICES POWER MARKET, BY TECHNOLOGY
    16. (USD BILLION)
      1. Energy Storage Systems
      2. Demand Response
    17. Smart Grids
      1. Distributed Generation
    18. ANCILLARY SERVICES POWER
    19. MARKET, BY MARKET APPLICATION (USD BILLION)
      1. Utilities
      2. Independent
    20. System Operators
      1. Electricity Retailers
    21. ANCILLARY SERVICES POWER
    22. MARKET, BY END USE SECTOR (USD BILLION)
      1. Residential
      2. Commercial
      3. Industrial
    23. ANCILLARY SERVICES POWER MARKET, BY REGIONAL (USD
    24. BILLION)
      1. North America
        1. US
        2. Canada
    25. Europe
      1. Germany
        1. UK
        2. France
    26. Russia
      1. Italy
        1. Spain
        2. Rest of Europe
      2. APAC
        1. China
        2. India
        3. Japan
    27. South Korea
      1. Malaysia
        1. Thailand
        2. Indonesia
        3. Rest of APAC
      2. South America
        1. Brazil
    28. Mexico
      1. Argentina
        1. Rest of South America
      2. MEA
        1. GCC Countries
        2. South Africa
        3. Rest of MEA
    29. COMPETITIVE LANDSCAPE
      1. Overview
      2. Competitive
    30. Analysis
      1. Market share Analysis
      2. Major Growth Strategy in
    31. the Ancillary Services Power Market
      1. Competitive Benchmarking
    32. Leading Players in Terms of Number of Developments in the Ancillary Services Power
    33. Market
      1. Key developments and growth strategies
        1. New Product
    34. Launch/Service Deployment
      1. Merger & Acquisitions
    35. Joint Ventures
      1. Major Players Financial Matrix
        1. Sales and
    36. Operating Income
      1. Major Players R&D Expenditure. 2023
    37. COMPANY PROFILES
      1. NextEra Energy
        1. Financial Overview
        2. Products Offered
        3. Key Developments
        4. SWOT Analysis
        5. Key Strategies
      2. Enel SpA
        1. Financial Overview
        2. Products Offered
        3. Key Developments
        4. SWOT
    38. Analysis
      1. Key Strategies
      2. Brookfield Renewable Partners
        1. Financial Overview
        2. Products Offered
        3. Key
    39. Developments
      1. SWOT Analysis
        1. Key Strategies
    40. General Electric
      1. Financial Overview
        1. Products Offered
        2. Key Developments
        3. SWOT Analysis
        4. Key Strategies
      2. RWE AG
        1. Financial Overview
        2. Products Offered
        3. Key Developments
        4. SWOT Analysis
        5. Key Strategies
      3. ABB Ltd
        1. Financial Overview
        2. Products Offered
        3. Key Developments
        4. SWOT Analysis
        5. Key Strategies
      4. Exelon Corporation
        1. Financial Overview
        2. Products
    41. Offered
      1. Key Developments
        1. SWOT Analysis
    42. Key Strategies
      1. Schneider Electric
        1. Financial Overview
        2. Products Offered
        3. Key Developments
        4. SWOT Analysis
        5. Key Strategies
      2. Siemens AG
        1. Financial Overview
        2. Products Offered
        3. Key Developments
        4. SWOT
    43. Analysis
      1. Key Strategies
      2. Iberdrola
        1. Financial
    44. Overview
      1. Products Offered
        1. Key Developments
    45. SWOT Analysis
      1. Key Strategies
      2. FirstEnergy Corporation
        1. Financial Overview
        2. Products Offered
    46. Key Developments
      1. SWOT Analysis
        1. Key Strategies
      2. Vestas Wind Systems
        1. Financial Overview
        2. Products
    47. Offered
      1. Key Developments
        1. SWOT Analysis
    48. Key Strategies
      1. Southern Company
        1. Financial Overview
        2. Products Offered
        3. Key Developments
        4. SWOT
    49. Analysis
      1. Key Strategies
      2. Duke Energy
        1. Financial
    50. Overview
      1. Products Offered
        1. Key Developments
    51. SWOT Analysis
      1. Key Strategies
      2. Eaton Corporation
    52. Financial Overview
      1. Products Offered
        1. Key Developments
        2. SWOT Analysis
        3. Key Strategies
    53. APPENDIX
      1. References
      2. Related Reports
    54. LIST OF ASSUMPTIONS
    55. SIZE ESTIMATES & FORECAST, BY SERVICE TYPE, 2019-2035 (USD BILLIONS)
    56. NORTH AMERICA ANCILLARY SERVICES POWER MARKET SIZE ESTIMATES & FORECAST,
    57. BY TECHNOLOGY, 2019-2035 (USD BILLIONS)
    58. POWER MARKET SIZE ESTIMATES & FORECAST, BY MARKET APPLICATION, 2019-2035 (USD
    59. BILLIONS)
    60. & FORECAST, BY END USE SECTOR, 2019-2035 (USD BILLIONS)
    61. AMERICA ANCILLARY SERVICES POWER MARKET SIZE ESTIMATES & FORECAST, BY REGIONAL,
    62. 2035 (USD BILLIONS)
    63. ESTIMATES & FORECAST, BY SERVICE TYPE, 2019-2035 (USD BILLIONS)
    64. US ANCILLARY SERVICES POWER MARKET SIZE ESTIMATES & FORECAST, BY TECHNOLOGY,
    65. 2035 (USD BILLIONS)
    66. ESTIMATES & FORECAST, BY MARKET APPLICATION, 2019-2035 (USD BILLIONS)
    67. US ANCILLARY SERVICES POWER MARKET SIZE ESTIMATES & FORECAST, BY END USE
    68. SECTOR, 2019-2035 (USD BILLIONS)
    69. SIZE ESTIMATES & FORECAST, BY REGIONAL, 2019-2035 (USD BILLIONS)
    70. CANADA ANCILLARY SERVICES POWER MARKET SIZE ESTIMATES & FORECAST, BY SERVICE
    71. TYPE, 2019-2035 (USD BILLIONS)
    72. SIZE ESTIMATES & FORECAST, BY TECHNOLOGY, 2019-2035 (USD BILLIONS)
    73. CANADA ANCILLARY SERVICES POWER MARKET SIZE ESTIMATES & FORECAST, BY MARKET
    74. APPLICATION, 2019-2035 (USD BILLIONS)
    75. POWER MARKET SIZE ESTIMATES & FORECAST, BY END USE SECTOR, 2019-2035 (USD BILLIONS)
    76. BY REGIONAL, 2019-2035 (USD BILLIONS)
    77. POWER MARKET SIZE ESTIMATES & FORECAST, BY SERVICE TYPE, 2019-2035 (USD BILLIONS)
    78. BY TECHNOLOGY, 2019-2035 (USD BILLIONS)
    79. POWER MARKET SIZE ESTIMATES & FORECAST, BY MARKET APPLICATION, 2019-2035 (USD
    80. BILLIONS)
    81. & FORECAST, BY END USE SECTOR, 2019-2035 (USD BILLIONS)
    82. ANCILLARY SERVICES POWER MARKET SIZE ESTIMATES & FORECAST, BY REGIONAL, 2019-2035
    83. (USD BILLIONS)
    84. & FORECAST, BY SERVICE TYPE, 2019-2035 (USD BILLIONS)
    85. ANCILLARY SERVICES POWER MARKET SIZE ESTIMATES & FORECAST, BY TECHNOLOGY, 2019-2035
    86. (USD BILLIONS)
    87. & FORECAST, BY MARKET APPLICATION, 2019-2035 (USD BILLIONS)
    88. GERMANY ANCILLARY SERVICES POWER MARKET SIZE ESTIMATES & FORECAST, BY END USE
    89. SECTOR, 2019-2035 (USD BILLIONS)
    90. MARKET SIZE ESTIMATES & FORECAST, BY REGIONAL, 2019-2035 (USD BILLIONS)
    91. SERVICE TYPE, 2019-2035 (USD BILLIONS)
    92. MARKET SIZE ESTIMATES & FORECAST, BY TECHNOLOGY, 2019-2035 (USD BILLIONS)
    93. MARKET APPLICATION, 2019-2035 (USD BILLIONS)
    94. POWER MARKET SIZE ESTIMATES & FORECAST, BY END USE SECTOR, 2019-2035 (USD BILLIONS)
    95. BY REGIONAL, 2019-2035 (USD BILLIONS)
    96. POWER MARKET SIZE ESTIMATES & FORECAST, BY SERVICE TYPE, 2019-2035 (USD BILLIONS)
    97. BY TECHNOLOGY, 2019-2035 (USD BILLIONS)
    98. POWER MARKET SIZE ESTIMATES & FORECAST, BY MARKET APPLICATION, 2019-2035 (USD
    99. BILLIONS)
    100. & FORECAST, BY END USE SECTOR, 2019-2035 (USD BILLIONS)
    101. ANCILLARY SERVICES POWER MARKET SIZE ESTIMATES & FORECAST, BY REGIONAL, 2019-2035
    102. (USD BILLIONS)
    103. & FORECAST, BY SERVICE TYPE, 2019-2035 (USD BILLIONS)
    104. ANCILLARY SERVICES POWER MARKET SIZE ESTIMATES & FORECAST, BY TECHNOLOGY, 2019-2035
    105. (USD BILLIONS)
    106. & FORECAST, BY MARKET APPLICATION, 2019-2035 (USD BILLIONS)
    107. RUSSIA ANCILLARY SERVICES POWER MARKET SIZE ESTIMATES & FORECAST, BY END USE
    108. SECTOR, 2019-2035 (USD BILLIONS)
    109. MARKET SIZE ESTIMATES & FORECAST, BY REGIONAL, 2019-2035 (USD BILLIONS)
    110. BY SERVICE TYPE, 2019-2035 (USD BILLIONS)
    111. POWER MARKET SIZE ESTIMATES & FORECAST, BY TECHNOLOGY, 2019-2035 (USD BILLIONS)
    112. BY MARKET APPLICATION, 2019-2035 (USD BILLIONS)
    113. SERVICES POWER MARKET SIZE ESTIMATES & FORECAST, BY END USE SECTOR, 2019-2035
    114. (USD BILLIONS)
    115. & FORECAST, BY REGIONAL, 2019-2035 (USD BILLIONS)
    116. SERVICES POWER MARKET SIZE ESTIMATES & FORECAST, BY SERVICE TYPE, 2019-2035
    117. (USD BILLIONS)
    118. & FORECAST, BY TECHNOLOGY, 2019-2035 (USD BILLIONS)
    119. SERVICES POWER MARKET SIZE ESTIMATES & FORECAST, BY MARKET APPLICATION, 2019-2035
    120. (USD BILLIONS)
    121. & FORECAST, BY END USE SECTOR, 2019-2035 (USD BILLIONS)
    122. ANCILLARY SERVICES POWER MARKET SIZE ESTIMATES & FORECAST, BY REGIONAL, 2019-2035
    123. (USD BILLIONS)
    124. ESTIMATES & FORECAST, BY SERVICE TYPE, 2019-2035 (USD BILLIONS)
    125. REST OF EUROPE ANCILLARY SERVICES POWER MARKET SIZE ESTIMATES & FORECAST,
    126. BY TECHNOLOGY, 2019-2035 (USD BILLIONS)
    127. SERVICES POWER MARKET SIZE ESTIMATES & FORECAST, BY MARKET APPLICATION, 2019-2035
    128. (USD BILLIONS)
    129. ESTIMATES & FORECAST, BY END USE SECTOR, 2019-2035 (USD BILLIONS)
    130. REST OF EUROPE ANCILLARY SERVICES POWER MARKET SIZE ESTIMATES & FORECAST,
    131. BY REGIONAL, 2019-2035 (USD BILLIONS)
    132. MARKET SIZE ESTIMATES & FORECAST, BY SERVICE TYPE, 2019-2035 (USD BILLIONS)
    133. BY TECHNOLOGY, 2019-2035 (USD BILLIONS)
    134. POWER MARKET SIZE ESTIMATES & FORECAST, BY MARKET APPLICATION, 2019-2035 (USD
    135. BILLIONS)
    136. FORECAST, BY END USE SECTOR, 2019-2035 (USD BILLIONS)
    137. SERVICES POWER MARKET SIZE ESTIMATES & FORECAST, BY REGIONAL, 2019-2035 (USD
    138. BILLIONS)
    139. FORECAST, BY SERVICE TYPE, 2019-2035 (USD BILLIONS)
    140. SERVICES POWER MARKET SIZE ESTIMATES & FORECAST, BY TECHNOLOGY, 2019-2035 (USD
    141. BILLIONS)
    142. FORECAST, BY MARKET APPLICATION, 2019-2035 (USD BILLIONS)
    143. ANCILLARY SERVICES POWER MARKET SIZE ESTIMATES & FORECAST, BY END USE SECTOR,
    144. 2035 (USD BILLIONS)
    145. ESTIMATES & FORECAST, BY REGIONAL, 2019-2035 (USD BILLIONS)
    146. INDIA ANCILLARY SERVICES POWER MARKET SIZE ESTIMATES & FORECAST, BY SERVICE
    147. TYPE, 2019-2035 (USD BILLIONS)
    148. SIZE ESTIMATES & FORECAST, BY TECHNOLOGY, 2019-2035 (USD BILLIONS)
    149. INDIA ANCILLARY SERVICES POWER MARKET SIZE ESTIMATES & FORECAST, BY MARKET
    150. APPLICATION, 2019-2035 (USD BILLIONS)
    151. MARKET SIZE ESTIMATES & FORECAST, BY END USE SECTOR, 2019-2035 (USD BILLIONS)
    152. BY REGIONAL, 2019-2035 (USD BILLIONS)
    153. MARKET SIZE ESTIMATES & FORECAST, BY SERVICE TYPE, 2019-2035 (USD BILLIONS)
    154. BY TECHNOLOGY, 2019-2035 (USD BILLIONS)
    155. POWER MARKET SIZE ESTIMATES & FORECAST, BY MARKET APPLICATION, 2019-2035 (USD
    156. BILLIONS)
    157. FORECAST, BY END USE SECTOR, 2019-2035 (USD BILLIONS)
    158. SERVICES POWER MARKET SIZE ESTIMATES & FORECAST, BY REGIONAL, 2019-2035 (USD
    159. BILLIONS)
    160. & FORECAST, BY SERVICE TYPE, 2019-2035 (USD BILLIONS)
    161. KOREA ANCILLARY SERVICES POWER MARKET SIZE ESTIMATES & FORECAST, BY TECHNOLOGY,
    162. 2035 (USD BILLIONS)
    163. SIZE ESTIMATES & FORECAST, BY MARKET APPLICATION, 2019-2035 (USD BILLIONS)
    164. BY END USE SECTOR, 2019-2035 (USD BILLIONS)
    165. SERVICES POWER MARKET SIZE ESTIMATES & FORECAST, BY REGIONAL, 2019-2035 (USD
    166. BILLIONS)
    167. & FORECAST, BY SERVICE TYPE, 2019-2035 (USD BILLIONS)
    168. ANCILLARY SERVICES POWER MARKET SIZE ESTIMATES & FORECAST, BY TECHNOLOGY, 2019-2035
    169. (USD BILLIONS)
    170. & FORECAST, BY MARKET APPLICATION, 2019-2035 (USD BILLIONS)
    171. MALAYSIA ANCILLARY SERVICES POWER MARKET SIZE ESTIMATES & FORECAST, BY END USE
    172. SECTOR, 2019-2035 (USD BILLIONS)
    173. MARKET SIZE ESTIMATES & FORECAST, BY REGIONAL, 2019-2035 (USD BILLIONS)
    174. BY SERVICE TYPE, 2019-2035 (USD BILLIONS)
    175. POWER MARKET SIZE ESTIMATES & FORECAST, BY TECHNOLOGY, 2019-2035 (USD BILLIONS)
    176. BY MARKET APPLICATION, 2019-2035 (USD BILLIONS)
    177. SERVICES POWER MARKET SIZE ESTIMATES & FORECAST, BY END USE SECTOR, 2019-2035
    178. (USD BILLIONS)
    179. & FORECAST, BY REGIONAL, 2019-2035 (USD BILLIONS)
    180. ANCILLARY SERVICES POWER MARKET SIZE ESTIMATES & FORECAST, BY SERVICE TYPE,
    181. 2035 (USD BILLIONS)
    182. SIZE ESTIMATES & FORECAST, BY TECHNOLOGY, 2019-2035 (USD BILLIONS)
    183. INDONESIA ANCILLARY SERVICES POWER MARKET SIZE ESTIMATES & FORECAST, BY
    184. MARKET APPLICATION, 2019-2035 (USD BILLIONS)
    185. SERVICES POWER MARKET SIZE ESTIMATES & FORECAST, BY END USE SECTOR, 2019-2035
    186. (USD BILLIONS)
    187. & FORECAST, BY REGIONAL, 2019-2035 (USD BILLIONS)
    188. ANCILLARY SERVICES POWER MARKET SIZE ESTIMATES & FORECAST, BY SERVICE TYPE,
    189. 2035 (USD BILLIONS)
    190. SIZE ESTIMATES & FORECAST, BY TECHNOLOGY, 2019-2035 (USD BILLIONS)
    191. REST OF APAC ANCILLARY SERVICES POWER MARKET SIZE ESTIMATES & FORECAST,
    192. BY MARKET APPLICATION, 2019-2035 (USD BILLIONS)
    193. SERVICES POWER MARKET SIZE ESTIMATES & FORECAST, BY END USE SECTOR, 2019-2035
    194. (USD BILLIONS)
    195. ESTIMATES & FORECAST, BY REGIONAL, 2019-2035 (USD BILLIONS)
    196. SOUTH AMERICA ANCILLARY SERVICES POWER MARKET SIZE ESTIMATES & FORECAST, BY
    197. SERVICE TYPE, 2019-2035 (USD BILLIONS)
    198. SERVICES POWER MARKET SIZE ESTIMATES & FORECAST, BY TECHNOLOGY, 2019-2035 (USD
    199. BILLIONS)
    200. & FORECAST, BY MARKET APPLICATION, 2019-2035 (USD BILLIONS)
    201. SOUTH AMERICA ANCILLARY SERVICES POWER MARKET SIZE ESTIMATES & FORECAST, BY
    202. END USE SECTOR, 2019-2035 (USD BILLIONS)
    203. SERVICES POWER MARKET SIZE ESTIMATES & FORECAST, BY REGIONAL, 2019-2035 (USD
    204. BILLIONS)
    205. & FORECAST, BY SERVICE TYPE, 2019-2035 (USD BILLIONS)
    206. ANCILLARY SERVICES POWER MARKET SIZE ESTIMATES & FORECAST, BY TECHNOLOGY, 2019-2035
    207. (USD BILLIONS)
    208. & FORECAST, BY MARKET APPLICATION, 2019-2035 (USD BILLIONS)
    209. BRAZIL ANCILLARY SERVICES POWER MARKET SIZE ESTIMATES & FORECAST, BY END USE
    210. SECTOR, 2019-2035 (USD BILLIONS)
    211. MARKET SIZE ESTIMATES & FORECAST, BY REGIONAL, 2019-2035 (USD BILLIONS)
    212. BY SERVICE TYPE, 2019-2035 (USD BILLIONS)
    213. POWER MARKET SIZE ESTIMATES & FORECAST, BY TECHNOLOGY, 2019-2035 (USD BILLIONS)
    214. BY MARKET APPLICATION, 2019-2035 (USD BILLIONS)
    215. SERVICES POWER MARKET SIZE ESTIMATES & FORECAST, BY END USE SECTOR, 2019-2035
    216. (USD BILLIONS)
    217. & FORECAST, BY REGIONAL, 2019-2035 (USD BILLIONS)
    218. ANCILLARY SERVICES POWER MARKET SIZE ESTIMATES & FORECAST, BY SERVICE TYPE,
    219. 2035 (USD BILLIONS)
    220. SIZE ESTIMATES & FORECAST, BY TECHNOLOGY, 2019-2035 (USD BILLIONS)
    221. ARGENTINA ANCILLARY SERVICES POWER MARKET SIZE ESTIMATES & FORECAST, BY
    222. MARKET APPLICATION, 2019-2035 (USD BILLIONS)
    223. SERVICES POWER MARKET SIZE ESTIMATES & FORECAST, BY END USE SECTOR, 2019-2035
    224. (USD BILLIONS)
    225. & FORECAST, BY REGIONAL, 2019-2035 (USD BILLIONS)
    226. AMERICA ANCILLARY SERVICES POWER MARKET SIZE ESTIMATES & FORECAST, BY SERVICE
    227. TYPE, 2019-2035 (USD BILLIONS)
    228. SERVICES POWER MARKET SIZE ESTIMATES & FORECAST, BY TECHNOLOGY, 2019-2035 (USD
    229. BILLIONS)
    230. SIZE ESTIMATES & FORECAST, BY MARKET APPLICATION, 2019-2035 (USD BILLIONS)
    231. & FORECAST, BY END USE SECTOR, 2019-2035 (USD BILLIONS)
    232. OF SOUTH AMERICA ANCILLARY SERVICES POWER MARKET SIZE ESTIMATES & FORECAST,
    233. BY REGIONAL, 2019-2035 (USD BILLIONS)
    234. MARKET SIZE ESTIMATES & FORECAST, BY SERVICE TYPE, 2019-2035 (USD BILLIONS)
    235. BY TECHNOLOGY, 2019-2035 (USD BILLIONS)
    236. POWER MARKET SIZE ESTIMATES & FORECAST, BY MARKET APPLICATION, 2019-2035 (USD
    237. BILLIONS)
    238. FORECAST, BY END USE SECTOR, 2019-2035 (USD BILLIONS)
    239. SERVICES POWER MARKET SIZE ESTIMATES & FORECAST, BY REGIONAL, 2019-2035 (USD
    240. BILLIONS)
    241. & FORECAST, BY SERVICE TYPE, 2019-2035 (USD BILLIONS)
    242. ANCILLARY SERVICES POWER MARKET SIZE ESTIMATES & FORECAST, BY TECHNOLOGY, 2019-2035
    243. (USD BILLIONS)
    244. ESTIMATES & FORECAST, BY MARKET APPLICATION, 2019-2035 (USD BILLIONS)
    245. GCC COUNTRIES ANCILLARY SERVICES POWER MARKET SIZE ESTIMATES & FORECAST,
    246. BY END USE SECTOR, 2019-2035 (USD BILLIONS)
    247. SERVICES POWER MARKET SIZE ESTIMATES & FORECAST, BY REGIONAL, 2019-2035 (USD
    248. BILLIONS)
    249. & FORECAST, BY SERVICE TYPE, 2019-2035 (USD BILLIONS)
    250. AFRICA ANCILLARY SERVICES POWER MARKET SIZE ESTIMATES & FORECAST, BY TECHNOLOGY,
    251. 2035 (USD BILLIONS)
    252. MARKET SIZE ESTIMATES & FORECAST, BY MARKET APPLICATION, 2019-2035 (USD BILLIONS)
    253. FORECAST, BY END USE SECTOR, 2019-2035 (USD BILLIONS)
    254. ANCILLARY SERVICES POWER MARKET SIZE ESTIMATES & FORECAST, BY REGIONAL, 2019-2035
    255. (USD BILLIONS)
    256. ESTIMATES & FORECAST, BY SERVICE TYPE, 2019-2035 (USD BILLIONS)
    257. REST OF MEA ANCILLARY SERVICES POWER MARKET SIZE ESTIMATES & FORECAST,
    258. BY TECHNOLOGY, 2019-2035 (USD BILLIONS)
    259. POWER MARKET SIZE ESTIMATES & FORECAST, BY MARKET APPLICATION, 2019-2035 (USD
    260. BILLIONS)
    261. & FORECAST, BY END USE SECTOR, 2019-2035 (USD BILLIONS)
    262. OF MEA ANCILLARY SERVICES POWER MARKET SIZE ESTIMATES & FORECAST, BY REGIONAL,
    263. 2035 (USD BILLIONS)
    264. MARKET SYNOPSIS
    265. ANALYSIS
    266. TYPE
    267. US ANCILLARY SERVICES POWER MARKET ANALYSIS BY REGIONAL
    268. ANCILLARY SERVICES POWER MARKET ANALYSIS BY SERVICE TYPE
    269. ANCILLARY SERVICES POWER MARKET ANALYSIS BY TECHNOLOGY
    270. SERVICES POWER MARKET ANALYSIS BY MARKET APPLICATION
    271. SERVICES POWER MARKET ANALYSIS BY END USE SECTOR
    272. SERVICES POWER MARKET ANALYSIS BY REGIONAL
    273. POWER MARKET ANALYSIS
    274. BY SERVICE TYPE
    275. BY TECHNOLOGY
    276. BY MARKET APPLICATION
    277. BY END USE SECTOR
    278. BY REGIONAL
    279. TYPE
    280. FRANCE ANCILLARY SERVICES POWER MARKET ANALYSIS BY SERVICE TYPE
    281. FRANCE ANCILLARY SERVICES POWER MARKET ANALYSIS BY TECHNOLOGY
    282. FRANCE ANCILLARY SERVICES POWER MARKET ANALYSIS BY MARKET APPLICATION
    283. FRANCE ANCILLARY SERVICES POWER MARKET ANALYSIS BY END USE SECTOR
    284. FRANCE ANCILLARY SERVICES POWER MARKET ANALYSIS BY REGIONAL
    285. RUSSIA ANCILLARY SERVICES POWER MARKET ANALYSIS BY SERVICE TYPE
    286. RUSSIA ANCILLARY SERVICES POWER MARKET ANALYSIS BY TECHNOLOGY
    287. ANCILLARY SERVICES POWER MARKET ANALYSIS BY MARKET APPLICATION
    288. RUSSIA ANCILLARY SERVICES POWER MARKET ANALYSIS BY END USE SECTOR
    289. RUSSIA ANCILLARY SERVICES POWER MARKET ANALYSIS BY REGIONAL
    290. ANCILLARY SERVICES POWER MARKET ANALYSIS BY SERVICE TYPE
    291. ANCILLARY SERVICES POWER MARKET ANALYSIS BY TECHNOLOGY
    292. SERVICES POWER MARKET ANALYSIS BY MARKET APPLICATION
    293. SERVICES POWER MARKET ANALYSIS BY END USE SECTOR
    294. SERVICES POWER MARKET ANALYSIS BY REGIONAL
    295. POWER MARKET ANALYSIS BY SERVICE TYPE
    296. POWER MARKET ANALYSIS BY TECHNOLOGY
    297. MARKET ANALYSIS BY MARKET APPLICATION
    298. POWER MARKET ANALYSIS BY END USE SECTOR
    299. POWER MARKET ANALYSIS BY REGIONAL
    300. POWER MARKET ANALYSIS BY SERVICE TYPE
    301. SERVICES POWER MARKET ANALYSIS BY TECHNOLOGY
    302. SERVICES POWER MARKET ANALYSIS BY MARKET APPLICATION
    303. ANCILLARY SERVICES POWER MARKET ANALYSIS BY END USE SECTOR
    304. OF EUROPE ANCILLARY SERVICES POWER MARKET ANALYSIS BY REGIONAL
    305. APAC ANCILLARY SERVICES POWER MARKET ANALYSIS
    306. POWER MARKET ANALYSIS BY SERVICE TYPE
    307. POWER MARKET ANALYSIS BY TECHNOLOGY
    308. MARKET ANALYSIS BY MARKET APPLICATION
    309. POWER MARKET ANALYSIS BY END USE SECTOR
    310. POWER MARKET ANALYSIS BY REGIONAL
    311. MARKET ANALYSIS BY SERVICE TYPE
    312. MARKET ANALYSIS BY TECHNOLOGY
    313. ANALYSIS BY MARKET APPLICATION
    314. ANALYSIS BY END USE SECTOR
    315. ANALYSIS BY REGIONAL
    316. BY SERVICE TYPE
    317. BY TECHNOLOGY
    318. MARKET APPLICATION
    319. BY END USE SECTOR
    320. BY REGIONAL
    321. BY SERVICE TYPE
    322. BY TECHNOLOGY
    323. BY MARKET APPLICATION
    324. ANALYSIS BY END USE SECTOR
    325. MARKET ANALYSIS BY REGIONAL
    326. ANALYSIS BY SERVICE TYPE
    327. ANALYSIS BY TECHNOLOGY
    328. ANALYSIS BY MARKET APPLICATION
    329. MARKET ANALYSIS BY END USE SECTOR
    330. MARKET ANALYSIS BY REGIONAL
    331. ANALYSIS BY SERVICE TYPE
    332. ANALYSIS BY TECHNOLOGY
    333. ANALYSIS BY MARKET APPLICATION
    334. MARKET ANALYSIS BY END USE SECTOR
    335. MARKET ANALYSIS BY REGIONAL
    336. MARKET ANALYSIS BY SERVICE TYPE
    337. MARKET ANALYSIS BY TECHNOLOGY
    338. MARKET ANALYSIS BY MARKET APPLICATION
    339. POWER MARKET ANALYSIS BY END USE SECTOR
    340. POWER MARKET ANALYSIS BY REGIONAL
    341. POWER MARKET ANALYSIS BY SERVICE TYPE
    342. POWER MARKET ANALYSIS BY TECHNOLOGY
    343. POWER MARKET ANALYSIS BY MARKET APPLICATION
    344. SERVICES POWER MARKET ANALYSIS BY END USE SECTOR
    345. SERVICES POWER MARKET ANALYSIS BY REGIONAL
    346. SERVICES POWER MARKET ANALYSIS
    347. MARKET ANALYSIS BY SERVICE TYPE
    348. MARKET ANALYSIS BY TECHNOLOGY
    349. ANALYSIS BY MARKET APPLICATION
    350. MARKET ANALYSIS BY END USE SECTOR
    351. MARKET ANALYSIS BY REGIONAL
    352. ANALYSIS BY SERVICE TYPE
    353. ANALYSIS BY TECHNOLOGY
    354. BY MARKET APPLICATION
    355. BY END USE SECTOR
    356. BY REGIONAL
    357. BY SERVICE TYPE
    358. BY TECHNOLOGY
    359. BY MARKET APPLICATION
    360. ANALYSIS BY END USE SECTOR
    361. MARKET ANALYSIS BY REGIONAL
    362. POWER MARKET ANALYSIS BY SERVICE TYPE
    363. SERVICES POWER MARKET ANALYSIS BY TECHNOLOGY
    364. ANCILLARY SERVICES POWER MARKET ANALYSIS BY MARKET APPLICATION
    365. REST OF SOUTH AMERICA ANCILLARY SERVICES POWER MARKET ANALYSIS BY END USE SECTOR
    366. BY REGIONAL
    367. GCC COUNTRIES ANCILLARY SERVICES POWER MARKET ANALYSIS BY SERVICE TYPE
    368. APPLICATION
    369. BY END USE SECTOR
    370. ANALYSIS BY REGIONAL
    371. ANALYSIS BY SERVICE TYPE
    372. MARKET ANALYSIS BY TECHNOLOGY
    373. POWER MARKET ANALYSIS BY MARKET APPLICATION
    374. SERVICES POWER MARKET ANALYSIS BY END USE SECTOR
    375. ANCILLARY SERVICES POWER MARKET ANALYSIS BY REGIONAL
    376. ANCILLARY SERVICES POWER MARKET ANALYSIS BY SERVICE TYPE
    377. OF MEA ANCILLARY SERVICES POWER MARKET ANALYSIS BY TECHNOLOGY
    378. REST OF MEA ANCILLARY SERVICES POWER MARKET ANALYSIS BY MARKET APPLICATION
    379. REST OF MEA ANCILLARY SERVICES POWER MARKET ANALYSIS BY END USE SECTOR
    380. RESEARCH PROCESS OF MRFR
    381. POWER MARKET
    382. MARKET
    383. ANCILLARY SERVICES POWER MARKET, BY SERVICE TYPE, 2025 (% SHARE)
    384. ANCILLARY SERVICES POWER MARKET, BY SERVICE TYPE, 2019 TO 2035 (USD Billions)
    385. Billions)
    386. (% SHARE)
    387. TO 2035 (USD Billions)
    388. END USE SECTOR, 2025 (% SHARE)
    389. BY END USE SECTOR, 2019 TO 2035 (USD Billions)
    390. POWER MARKET, BY REGIONAL, 2025 (% SHARE)
    391. MARKET, BY REGIONAL, 2019 TO 2035 (USD Billions)
    392. OF MAJOR COMPETITORS

    Ancillary Services Power Market Segmentation


    • Ancillary Services Power Market By Service Type (USD Billion, 2019-2035)

      • Frequency Regulation
      • Voltage Support
      • Reactive Power Supply
      • Black Start Services


    • Ancillary Services Power Market By Technology (USD Billion, 2019-2035)

      • Energy Storage Systems
      • Demand Response
      • Smart Grids
      • Distributed Generation


    • Ancillary Services Power Market By Market Application (USD Billion, 2019-2035)

      • Utilities
      • Independent System Operators
      • Electricity Retailers


    • Ancillary Services Power Market By End Use Sector (USD Billion, 2019-2035)

      • Residential
      • Commercial
      • Industrial


    • Ancillary Services Power Market By Regional (USD Billion, 2019-2035)

      • North America
      • Europe
      • South America
      • Asia Pacific
      • Middle East and Africa


    Ancillary Services Power Market Regional Outlook (USD Billion, 2019-2035)


    • North America Outlook (USD Billion, 2019-2035)

      • North America Ancillary Services Power Market by Service Type

        • Frequency Regulation
        • Voltage Support
        • Reactive Power Supply
        • Black Start Services
      • North America Ancillary Services Power Market by Technology Type

        • Energy Storage Systems
        • Demand Response
        • Smart Grids
        • Distributed Generation
      • North America Ancillary Services Power Market by Market Application Type

        • Utilities
        • Independent System Operators
        • Electricity Retailers
      • North America Ancillary Services Power Market by End Use Sector Type

        • Residential
        • Commercial
        • Industrial
      • North America Ancillary Services Power Market by Regional Type

        • US
        • Canada
      • US Outlook (USD Billion, 2019-2035)
      • US Ancillary Services Power Market by Service Type

        • Frequency Regulation
        • Voltage Support
        • Reactive Power Supply
        • Black Start Services
      • US Ancillary Services Power Market by Technology Type

        • Energy Storage Systems
        • Demand Response
        • Smart Grids
        • Distributed Generation
      • US Ancillary Services Power Market by Market Application Type

        • Utilities
        • Independent System Operators
        • Electricity Retailers
      • US Ancillary Services Power Market by End Use Sector Type

        • Residential
        • Commercial
        • Industrial
      • CANADA Outlook (USD Billion, 2019-2035)
      • CANADA Ancillary Services Power Market by Service Type

        • Frequency Regulation
        • Voltage Support
        • Reactive Power Supply
        • Black Start Services
      • CANADA Ancillary Services Power Market by Technology Type

        • Energy Storage Systems
        • Demand Response
        • Smart Grids
        • Distributed Generation
      • CANADA Ancillary Services Power Market by Market Application Type

        • Utilities
        • Independent System Operators
        • Electricity Retailers
      • CANADA Ancillary Services Power Market by End Use Sector Type

        • Residential
        • Commercial
        • Industrial
    • Europe Outlook (USD Billion, 2019-2035)

      • Europe Ancillary Services Power Market by Service Type

        • Frequency Regulation
        • Voltage Support
        • Reactive Power Supply
        • Black Start Services
      • Europe Ancillary Services Power Market by Technology Type

        • Energy Storage Systems
        • Demand Response
        • Smart Grids
        • Distributed Generation
      • Europe Ancillary Services Power Market by Market Application Type

        • Utilities
        • Independent System Operators
        • Electricity Retailers
      • Europe Ancillary Services Power Market by End Use Sector Type

        • Residential
        • Commercial
        • Industrial
      • Europe Ancillary Services Power Market by Regional Type

        • Germany
        • UK
        • France
        • Russia
        • Italy
        • Spain
        • Rest of Europe
      • GERMANY Outlook (USD Billion, 2019-2035)
      • GERMANY Ancillary Services Power Market by Service Type

        • Frequency Regulation
        • Voltage Support
        • Reactive Power Supply
        • Black Start Services
      • GERMANY Ancillary Services Power Market by Technology Type

        • Energy Storage Systems
        • Demand Response
        • Smart Grids
        • Distributed Generation
      • GERMANY Ancillary Services Power Market by Market Application Type

        • Utilities
        • Independent System Operators
        • Electricity Retailers
      • GERMANY Ancillary Services Power Market by End Use Sector Type

        • Residential
        • Commercial
        • Industrial
      • UK Outlook (USD Billion, 2019-2035)
      • UK Ancillary Services Power Market by Service Type

        • Frequency Regulation
        • Voltage Support
        • Reactive Power Supply
        • Black Start Services
      • UK Ancillary Services Power Market by Technology Type

        • Energy Storage Systems
        • Demand Response
        • Smart Grids
        • Distributed Generation
      • UK Ancillary Services Power Market by Market Application Type

        • Utilities
        • Independent System Operators
        • Electricity Retailers
      • UK Ancillary Services Power Market by End Use Sector Type

        • Residential
        • Commercial
        • Industrial
      • FRANCE Outlook (USD Billion, 2019-2035)
      • FRANCE Ancillary Services Power Market by Service Type

        • Frequency Regulation
        • Voltage Support
        • Reactive Power Supply
        • Black Start Services
      • FRANCE Ancillary Services Power Market by Technology Type

        • Energy Storage Systems
        • Demand Response
        • Smart Grids
        • Distributed Generation
      • FRANCE Ancillary Services Power Market by Market Application Type

        • Utilities
        • Independent System Operators
        • Electricity Retailers
      • FRANCE Ancillary Services Power Market by End Use Sector Type

        • Residential
        • Commercial
        • Industrial
      • RUSSIA Outlook (USD Billion, 2019-2035)
      • RUSSIA Ancillary Services Power Market by Service Type

        • Frequency Regulation
        • Voltage Support
        • Reactive Power Supply
        • Black Start Services
      • RUSSIA Ancillary Services Power Market by Technology Type

        • Energy Storage Systems
        • Demand Response
        • Smart Grids
        • Distributed Generation
      • RUSSIA Ancillary Services Power Market by Market Application Type

        • Utilities
        • Independent System Operators
        • Electricity Retailers
      • RUSSIA Ancillary Services Power Market by End Use Sector Type

        • Residential
        • Commercial
        • Industrial
      • ITALY Outlook (USD Billion, 2019-2035)
      • ITALY Ancillary Services Power Market by Service Type

        • Frequency Regulation
        • Voltage Support
        • Reactive Power Supply
        • Black Start Services
      • ITALY Ancillary Services Power Market by Technology Type

        • Energy Storage Systems
        • Demand Response
        • Smart Grids
        • Distributed Generation
      • ITALY Ancillary Services Power Market by Market Application Type

        • Utilities
        • Independent System Operators
        • Electricity Retailers
      • ITALY Ancillary Services Power Market by End Use Sector Type

        • Residential
        • Commercial
        • Industrial
      • SPAIN Outlook (USD Billion, 2019-2035)
      • SPAIN Ancillary Services Power Market by Service Type

        • Frequency Regulation
        • Voltage Support
        • Reactive Power Supply
        • Black Start Services
      • SPAIN Ancillary Services Power Market by Technology Type

        • Energy Storage Systems
        • Demand Response
        • Smart Grids
        • Distributed Generation
      • SPAIN Ancillary Services Power Market by Market Application Type

        • Utilities
        • Independent System Operators
        • Electricity Retailers
      • SPAIN Ancillary Services Power Market by End Use Sector Type

        • Residential
        • Commercial
        • Industrial
      • REST OF EUROPE Outlook (USD Billion, 2019-2035)
      • REST OF EUROPE Ancillary Services Power Market by Service Type

        • Frequency Regulation
        • Voltage Support
        • Reactive Power Supply
        • Black Start Services
      • REST OF EUROPE Ancillary Services Power Market by Technology Type

        • Energy Storage Systems
        • Demand Response
        • Smart Grids
        • Distributed Generation
      • REST OF EUROPE Ancillary Services Power Market by Market Application Type

        • Utilities
        • Independent System Operators
        • Electricity Retailers
      • REST OF EUROPE Ancillary Services Power Market by End Use Sector Type

        • Residential
        • Commercial
        • Industrial
    • APAC Outlook (USD Billion, 2019-2035)

      • APAC Ancillary Services Power Market by Service Type

        • Frequency Regulation
        • Voltage Support
        • Reactive Power Supply
        • Black Start Services
      • APAC Ancillary Services Power Market by Technology Type

        • Energy Storage Systems
        • Demand Response
        • Smart Grids
        • Distributed Generation
      • APAC Ancillary Services Power Market by Market Application Type

        • Utilities
        • Independent System Operators
        • Electricity Retailers
      • APAC Ancillary Services Power Market by End Use Sector Type

        • Residential
        • Commercial
        • Industrial
      • APAC Ancillary Services Power Market by Regional Type

        • China
        • India
        • Japan
        • South Korea
        • Malaysia
        • Thailand
        • Indonesia
        • Rest of APAC
      • CHINA Outlook (USD Billion, 2019-2035)
      • CHINA Ancillary Services Power Market by Service Type

        • Frequency Regulation
        • Voltage Support
        • Reactive Power Supply
        • Black Start Services
      • CHINA Ancillary Services Power Market by Technology Type

        • Energy Storage Systems
        • Demand Response
        • Smart Grids
        • Distributed Generation
      • CHINA Ancillary Services Power Market by Market Application Type

        • Utilities
        • Independent System Operators
        • Electricity Retailers
      • CHINA Ancillary Services Power Market by End Use Sector Type

        • Residential
        • Commercial
        • Industrial
      • INDIA Outlook (USD Billion, 2019-2035)
      • INDIA Ancillary Services Power Market by Service Type

        • Frequency Regulation
        • Voltage Support
        • Reactive Power Supply
        • Black Start Services
      • INDIA Ancillary Services Power Market by Technology Type

        • Energy Storage Systems
        • Demand Response
        • Smart Grids
        • Distributed Generation
      • INDIA Ancillary Services Power Market by Market Application Type

        • Utilities
        • Independent System Operators
        • Electricity Retailers
      • INDIA Ancillary Services Power Market by End Use Sector Type

        • Residential
        • Commercial
        • Industrial
      • JAPAN Outlook (USD Billion, 2019-2035)
      • JAPAN Ancillary Services Power Market by Service Type

        • Frequency Regulation
        • Voltage Support
        • Reactive Power Supply
        • Black Start Services
      • JAPAN Ancillary Services Power Market by Technology Type

        • Energy Storage Systems
        • Demand Response
        • Smart Grids
        • Distributed Generation
      • JAPAN Ancillary Services Power Market by Market Application Type

        • Utilities
        • Independent System Operators
        • Electricity Retailers
      • JAPAN Ancillary Services Power Market by End Use Sector Type

        • Residential
        • Commercial
        • Industrial
      • SOUTH KOREA Outlook (USD Billion, 2019-2035)
      • SOUTH KOREA Ancillary Services Power Market by Service Type

        • Frequency Regulation
        • Voltage Support
        • Reactive Power Supply
        • Black Start Services
      • SOUTH KOREA Ancillary Services Power Market by Technology Type

        • Energy Storage Systems
        • Demand Response
        • Smart Grids
        • Distributed Generation
      • SOUTH KOREA Ancillary Services Power Market by Market Application Type

        • Utilities
        • Independent System Operators
        • Electricity Retailers
      • SOUTH KOREA Ancillary Services Power Market by End Use Sector Type

        • Residential
        • Commercial
        • Industrial
      • MALAYSIA Outlook (USD Billion, 2019-2035)
      • MALAYSIA Ancillary Services Power Market by Service Type

        • Frequency Regulation
        • Voltage Support
        • Reactive Power Supply
        • Black Start Services
      • MALAYSIA Ancillary Services Power Market by Technology Type

        • Energy Storage Systems
        • Demand Response
        • Smart Grids
        • Distributed Generation
      • MALAYSIA Ancillary Services Power Market by Market Application Type

        • Utilities
        • Independent System Operators
        • Electricity Retailers
      • MALAYSIA Ancillary Services Power Market by End Use Sector Type

        • Residential
        • Commercial
        • Industrial
      • THAILAND Outlook (USD Billion, 2019-2035)
      • THAILAND Ancillary Services Power Market by Service Type

        • Frequency Regulation
        • Voltage Support
        • Reactive Power Supply
        • Black Start Services
      • THAILAND Ancillary Services Power Market by Technology Type

        • Energy Storage Systems
        • Demand Response
        • Smart Grids
        • Distributed Generation
      • THAILAND Ancillary Services Power Market by Market Application Type

        • Utilities
        • Independent System Operators
        • Electricity Retailers
      • THAILAND Ancillary Services Power Market by End Use Sector Type

        • Residential
        • Commercial
        • Industrial
      • INDONESIA Outlook (USD Billion, 2019-2035)
      • INDONESIA Ancillary Services Power Market by Service Type

        • Frequency Regulation
        • Voltage Support
        • Reactive Power Supply
        • Black Start Services
      • INDONESIA Ancillary Services Power Market by Technology Type

        • Energy Storage Systems
        • Demand Response
        • Smart Grids
        • Distributed Generation
      • INDONESIA Ancillary Services Power Market by Market Application Type

        • Utilities
        • Independent System Operators
        • Electricity Retailers
      • INDONESIA Ancillary Services Power Market by End Use Sector Type

        • Residential
        • Commercial
        • Industrial
      • REST OF APAC Outlook (USD Billion, 2019-2035)
      • REST OF APAC Ancillary Services Power Market by Service Type

        • Frequency Regulation
        • Voltage Support
        • Reactive Power Supply
        • Black Start Services
      • REST OF APAC Ancillary Services Power Market by Technology Type

        • Energy Storage Systems
        • Demand Response
        • Smart Grids
        • Distributed Generation
      • REST OF APAC Ancillary Services Power Market by Market Application Type

        • Utilities
        • Independent System Operators
        • Electricity Retailers
      • REST OF APAC Ancillary Services Power Market by End Use Sector Type

        • Residential
        • Commercial
        • Industrial
    • South America Outlook (USD Billion, 2019-2035)

      • South America Ancillary Services Power Market by Service Type

        • Frequency Regulation
        • Voltage Support
        • Reactive Power Supply
        • Black Start Services
      • South America Ancillary Services Power Market by Technology Type

        • Energy Storage Systems
        • Demand Response
        • Smart Grids
        • Distributed Generation
      • South America Ancillary Services Power Market by Market Application Type

        • Utilities
        • Independent System Operators
        • Electricity Retailers
      • South America Ancillary Services Power Market by End Use Sector Type

        • Residential
        • Commercial
        • Industrial
      • South America Ancillary Services Power Market by Regional Type

        • Brazil
        • Mexico
        • Argentina
        • Rest of South America
      • BRAZIL Outlook (USD Billion, 2019-2035)
      • BRAZIL Ancillary Services Power Market by Service Type

        • Frequency Regulation
        • Voltage Support
        • Reactive Power Supply
        • Black Start Services
      • BRAZIL Ancillary Services Power Market by Technology Type

        • Energy Storage Systems
        • Demand Response
        • Smart Grids
        • Distributed Generation
      • BRAZIL Ancillary Services Power Market by Market Application Type

        • Utilities
        • Independent System Operators
        • Electricity Retailers
      • BRAZIL Ancillary Services Power Market by End Use Sector Type

        • Residential
        • Commercial
        • Industrial
      • MEXICO Outlook (USD Billion, 2019-2035)
      • MEXICO Ancillary Services Power Market by Service Type

        • Frequency Regulation
        • Voltage Support
        • Reactive Power Supply
        • Black Start Services
      • MEXICO Ancillary Services Power Market by Technology Type

        • Energy Storage Systems
        • Demand Response
        • Smart Grids
        • Distributed Generation
      • MEXICO Ancillary Services Power Market by Market Application Type

        • Utilities
        • Independent System Operators
        • Electricity Retailers
      • MEXICO Ancillary Services Power Market by End Use Sector Type

        • Residential
        • Commercial
        • Industrial
      • ARGENTINA Outlook (USD Billion, 2019-2035)
      • ARGENTINA Ancillary Services Power Market by Service Type

        • Frequency Regulation
        • Voltage Support
        • Reactive Power Supply
        • Black Start Services
      • ARGENTINA Ancillary Services Power Market by Technology Type

        • Energy Storage Systems
        • Demand Response
        • Smart Grids
        • Distributed Generation
      • ARGENTINA Ancillary Services Power Market by Market Application Type

        • Utilities
        • Independent System Operators
        • Electricity Retailers
      • ARGENTINA Ancillary Services Power Market by End Use Sector Type

        • Residential
        • Commercial
        • Industrial
      • REST OF SOUTH AMERICA Outlook (USD Billion, 2019-2035)
      • REST OF SOUTH AMERICA Ancillary Services Power Market by Service Type

        • Frequency Regulation
        • Voltage Support
        • Reactive Power Supply
        • Black Start Services
      • REST OF SOUTH AMERICA Ancillary Services Power Market by Technology Type

        • Energy Storage Systems
        • Demand Response
        • Smart Grids
        • Distributed Generation
      • REST OF SOUTH AMERICA Ancillary Services Power Market by Market Application Type

        • Utilities
        • Independent System Operators
        • Electricity Retailers
      • REST OF SOUTH AMERICA Ancillary Services Power Market by End Use Sector Type

        • Residential
        • Commercial
        • Industrial
    • MEA Outlook (USD Billion, 2019-2035)

      • MEA Ancillary Services Power Market by Service Type

        • Frequency Regulation
        • Voltage Support
        • Reactive Power Supply
        • Black Start Services
      • MEA Ancillary Services Power Market by Technology Type

        • Energy Storage Systems
        • Demand Response
        • Smart Grids
        • Distributed Generation
      • MEA Ancillary Services Power Market by Market Application Type

        • Utilities
        • Independent System Operators
        • Electricity Retailers
      • MEA Ancillary Services Power Market by End Use Sector Type

        • Residential
        • Commercial
        • Industrial
      • MEA Ancillary Services Power Market by Regional Type

        • GCC Countries
        • South Africa
        • Rest of MEA
      • GCC COUNTRIES Outlook (USD Billion, 2019-2035)
      • GCC COUNTRIES Ancillary Services Power Market by Service Type

        • Frequency Regulation
        • Voltage Support
        • Reactive Power Supply
        • Black Start Services
      • GCC COUNTRIES Ancillary Services Power Market by Technology Type

        • Energy Storage Systems
        • Demand Response
        • Smart Grids
        • Distributed Generation
      • GCC COUNTRIES Ancillary Services Power Market by Market Application Type

        • Utilities
        • Independent System Operators
        • Electricity Retailers
      • GCC COUNTRIES Ancillary Services Power Market by End Use Sector Type

        • Residential
        • Commercial
        • Industrial
      • SOUTH AFRICA Outlook (USD Billion, 2019-2035)
      • SOUTH AFRICA Ancillary Services Power Market by Service Type

        • Frequency Regulation
        • Voltage Support
        • Reactive Power Supply
        • Black Start Services
      • SOUTH AFRICA Ancillary Services Power Market by Technology Type

        • Energy Storage Systems
        • Demand Response
        • Smart Grids
        • Distributed Generation
      • SOUTH AFRICA Ancillary Services Power Market by Market Application Type

        • Utilities
        • Independent System Operators
        • Electricity Retailers
      • SOUTH AFRICA Ancillary Services Power Market by End Use Sector Type

        • Residential
        • Commercial
        • Industrial
      • REST OF MEA Outlook (USD Billion, 2019-2035)
      • REST OF MEA Ancillary Services Power Market by Service Type

        • Frequency Regulation
        • Voltage Support
        • Reactive Power Supply
        • Black Start Services
      • REST OF MEA Ancillary Services Power Market by Technology Type

        • Energy Storage Systems
        • Demand Response
        • Smart Grids
        • Distributed Generation
      • REST OF MEA Ancillary Services Power Market by Market Application Type

        • Utilities
        • Independent System Operators
        • Electricity Retailers
      • REST OF MEA Ancillary Services Power Market by End Use Sector Type

        • Residential
        • Commercial
        • Industrial


    Report Infographic
    Free Sample Request

    Kindly complete the form below to receive a free sample of this Report

    Customer Strories

    “I am very pleased with how market segments have been defined in a relevant way for my purposes (such as "Portable Freezers & refrigerators" and "last-mile"). In general the report is well structured. Thanks very much for your efforts.”

    Victoria Milne Founder
    Case Study

    Chemicals and Materials