• Cat-intel
  • MedIntelliX
  • Resources
  • About Us
  • Request Free Sample ×

    Kindly complete the form below to receive a free sample of this Report

    Leading companies partner with us for data-driven Insights

    clients tt-cursor

    Activated Carbon Market

    ID: MRFR/CnM/1212-CR
    200 Pages
    Chitranshi Jaiswal
    May 2024

    Activated Carbon Market Research Report By Application (Water Treatment, Air Purification, Food and Beverage Processing, Pharmaceuticals, Gold Recovery), By Type (Granular Activated Carbon, Powdered Activated Carbon, Extruded Activated Carbon), By End-use (Industrial, Residential, Commercial), By Production Method (Physical Activation, Chemical Activation) and By Regional (North America, Europe, South America, Asia Pacific, Middle East and Africa) - Forecast to 2035

    Share:
    Download PDF ×

    We do not share your information with anyone. However, we may send you emails based on your report interest from time to time. You may contact us at any time to opt-out.

    Activated Carbon Market Research Report - Global Forecast till 2035 Infographic
    Purchase Options
    $ 4,950.0
    $ 5,950
    $ 7,250.0
    Table of Contents

    Activated Carbon Market Summary

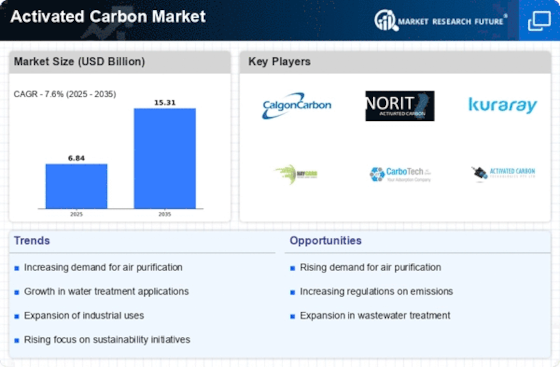
    As per Market Research Future Analysis, the Global Activated Carbon Market was valued at 3.58 USD Billion in 2023 and is projected to reach 7.5 USD Billion by 2035, growing at a CAGR of 6.35% from 2025 to 2035. The market is driven by increasing environmental regulations, rising health concerns related to air quality, and growing demand in industrial applications, particularly in water treatment and air purification.

    Key Market Trends & Highlights

    The Activated Carbon Market is witnessing significant trends driven by environmental and industrial needs.

    • Water Treatment segment projected to grow from 1.25 USD Billion in 2024 to 2.45 USD Billion by 2035.
    • Air Purification expected to increase from 1.0 USD Billion in 2024 to 2.0 USD Billion by 2035.
    • Food and Beverage Processing sector anticipated to expand from 0.8 USD Billion in 2024 to 1.6 USD Billion by 2035.
    • Granular Activated Carbon remains preferred for industrial applications due to its efficiency.

    Market Size & Forecast

    2023 Market Size USD 3.58 Billion
    2024 Market Size USD 3.81 Billion
    2035 Market Size USD 7.5 Billion
    CAGR (2025-2035) 6.35%

    Major Players

    Key players include Kuraray Co. Ltd, Carbon Resources LLC, Ingevity Corporation, Calgon Carbon Corporation, and 3M Company.

    Activated Carbon Market Trends

    Numerous factors are driving numerous significant market trends in the  activated carbon market. The growing need for activated carbon in water treatment applications is a major motivator. Around the world, governments are investing in wastewater treatment facilities, implementing tougher water quality rules, and actively supporting clean water projects.

    As a result, activated carbon is now widely used to remove pollutants, especially in underdeveloped countries where it might be difficult to obtain clean water. Furthermore, the necessity for activated carbon in air filtration systems has increased due to growing awareness of air pollution and international pledges to raise air quality standards.

    As new production techniques are developed, the  activated carbon market is experiencing an increase in opportunities. Manufacturers may reduce costs and provide sustainable products by developing efficient and cost-effective production procedures.

    Additionally, recycled activated carbon is becoming more and more popular, which is consistent with the worldwide movement towards sustainability and the ideas of the circular economy. There are many chances to seize market potential due to the growing use of activated carbon in a variety of industries, such as electronics, food and beverage, and medicines.

    Trends over the past several years show a move toward activated carbon solutions that are specifically suited to the demands of particular industries. Companies are spending money on research and development to create specific grades of activated carbon that improve performance in certain applications as a result of technical developments.

    Additionally, producers are being encouraged to investigate environmentally acceptable alternatives by the growing trend of employing activated carbon in green chemistry processes, which is further broadening the market.

    The worldwide activated carbon market is expected to increase significantly in the next years due to these trends and factors, which show a strong adaptation to consumer preferences and environmental issues throughout the world.

    The global activated carbon market is poised for growth, driven by increasing environmental regulations and a rising demand for air and water purification technologies.

    U.S. Environmental Protection Agency (EPA)

    Activated Carbon Market Drivers

    Market Growth Projections

    Industrial Growth and Urbanization

    The Global Activated Carbon Market Industry is significantly influenced by industrial growth and urbanization trends. As developing nations continue to industrialize, the demand for activated carbon in various applications such as chemical processing, food and beverage, and pharmaceuticals is likely to increase. Urbanization leads to higher waste generation and pollution levels, necessitating effective filtration and purification solutions. This industrial expansion is expected to drive the market forward, with a projected compound annual growth rate of 6.35% from 2025 to 2035. Consequently, the activated carbon market is poised for substantial growth in the coming years.

    Increasing Environmental Regulations

    The Global Activated Carbon Market Industry is shaped by the increasing environmental regulations aimed at reducing pollution levels. Governments worldwide are implementing stricter guidelines for air and water quality, necessitating the adoption of advanced filtration technologies. Activated carbon plays a crucial role in meeting these regulatory requirements by effectively removing harmful substances from emissions and effluents. As industries strive to comply with these regulations, the demand for activated carbon is expected to rise. This trend not only supports environmental sustainability but also enhances the market's growth potential in the coming years.

    Technological Advancements in Production

    The Global Activated Carbon Market Industry benefits from ongoing technological advancements in the production of activated carbon. Innovations in manufacturing processes, such as the development of more efficient activation methods and the use of sustainable raw materials, are enhancing the quality and performance of activated carbon products. These advancements are likely to lower production costs and improve product availability, thereby stimulating market growth. As the industry adapts to these technological changes, the activated carbon market is expected to witness increased competitiveness and a broader range of applications across various sectors.

    Expansion of Air Purification Applications

    The Global Activated Carbon Market Industry is witnessing significant growth due to the expansion of air purification applications. Activated carbon is employed in various air filtration systems to capture volatile organic compounds and other pollutants, thus improving indoor air quality. With rising awareness regarding air pollution and its health implications, both residential and commercial sectors are increasingly investing in air purification technologies. This trend is expected to contribute to the market's growth, as the demand for activated carbon in air treatment applications continues to rise. The market is projected to reach 7.5 USD Billion by 2035, indicating a robust growth outlook.

    Rising Demand for Water Treatment Solutions

    The Global Activated Carbon Market Industry experiences a notable surge in demand for water treatment solutions. Activated carbon is extensively utilized in municipal and industrial water treatment processes to remove contaminants and improve water quality. As global water scarcity issues intensify, the need for effective purification methods becomes paramount. In 2024, the market is valued at approximately 3.81 USD Billion, reflecting the growing emphasis on clean water access. Furthermore, the increasing regulatory standards for water quality are likely to propel the adoption of activated carbon technologies, thereby enhancing the market's growth trajectory.

    Market Segment Insights

    Activated Carbon Market Segment Insights

    Activated Carbon Market Segment Insights

    Activated Carbon Market Application Insights

    Activated Carbon Market Application Insights

    The  Activated Carbon Market witnessed considerable growth within its Application segment, which encompasses various sectors, including Water Treatment, Air Purification, Food and Beverage Processing, Pharmaceuticals, and Gold Recovery.

    Water Treatment was a critical segment, projected to reach 1.25 USD Billion in 2024 and escalate to 2.45 USD Billion in 2035, highlighting its essential role in providing clean and safe drinking water amidst growing environmental concerns.

    Meanwhile, Air Purification was another significant area, expected to grow from 1.0 USD Billion in 2024 to 2.0 USD Billion by 2035, driven by increased awareness of air quality issues and regulatory measures aimed at reducing pollutants.

    The Food and Beverage Processing sector, valued at 0.8 USD Billion in 2024, is anticipated to expand to 1.6 USD Billion in 2035, reflecting the rising demand for safe food products and adherence to food safety standards, thereby emphasizing quality assurance throughout the food supply chain.

    Activated Carbon Market Type Insights

    Activated Carbon Market Type Insights

    The  Activated Carbon Market, focusing specifically on the Type segment, is experiencing substantial growth driven by increasing demand across various industries such as water treatment, air purification, and food and beverage processing. Within this segment, Granular Activated Carbon, Powdered Activated Carbon, and Extruded Activated Carbon each hold significant importance.

    Granular Activated Carbon remains a preferred choice for industrial applications due to its efficiency in adsorption processes. Powdered Activated Carbon is frequently utilized for applications requiring rapid adsorption, proving vital in wastewater treatment scenarios. Extruded Activated Carbon, known for its high mechanical strength, finds favor in specialized applications.

    Collectively, these product types showcase a well-rounded portfolio that supports a diverse range of functionalities, making them essential in the ongoing efforts to advance environmental sustainability and pollution control measures in the  Activated Carbon Market.

    As regulations tighten ly, the market's growth is supported by innovations that enhance the performance and applications of each product type.

    Activated Carbon Market End-use Insights

    Activated Carbon Market End-use Insights

    The  Activated Carbon Market revenue is primarily driven by its diverse end-use applications, which include industrial, residential, and commercial segments. The industrial segment plays a critical role in environmental management, focusing on water treatment, air purification, and food processing, where the need for stringent quality standards is paramount.

    The residential segment benefits from growing awareness regarding indoor air quality and pollutants, leading to the rising adoption of activated carbon filters in homes. Meanwhile, the commercial sector utilizes activated carbon for applications like water filtration in restaurants and hotels, ensuring safety and compliance with health regulations.

    As consumer awareness about environmental issues increases, this segment is becoming more significant. Overall, the  Activated Carbon Market continues to expand with robust growth driven by these critical applications, while industry challenges, such as sourcing raw materials, remain pertinent.

    The market growth is also supported by advancements in production technology and the ongoing need for effective filtration solutions across various sectors, making it a vital component in achieving sustainability goals ly.

    Activated Carbon Market Production Method Insights

    Activated Carbon Market Production Method Insights

    The  Activated Carbon Market is shaped significantly by its Production Method, with notable methods including Physical Activation and Chemical Activation. Physical Activation is recognized for its efficiency and sustainability, utilizing high temperatures and steam to develop activated carbon, attracting environmentally conscious industries.

    Conversely, Chemical Activation employs chemical agents for a more controlled process, yielding high surface area products preferred in many applications. This segment's dynamics showcase a trend towards increased regulatory support for environmental protection, pushing for cleaner and more effective production methods.

    Growth in water treatment processes and air quality improvements are leading to substantial market growth. As consumers and industries demand better solutions for filtration and adsorption, the relevance of each production method will become critical in fulfilling these requirements, thus continuing the evolution and expansion of the  Activated Carbon Market revenue.

    Get more detailed insights about Activated Carbon Market Research Report - Global Forecast till 2035

    Regional Insights

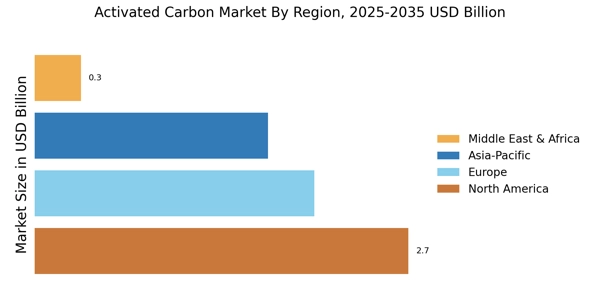
    The Regional aspect of the  Activated Carbon Market highlighted significant variances in market valuation and growth potential across different regions. In 2024, North America was valued at 0.871 USD Billion, tending towards a projected 1.776 USD Billion by 2035, playing a vital role due to strong industrial applications and environmental regulations demanding clean air and water.

    Meanwhile, Europe held a market valuation of 0.752 USD Billion in 2024, growing to 1.5 USD Billion in 2035, underscored by stringent environmental policies and increased demand for water treatment solutions.

    Asia Pacific, dominating with 1.188 USD Billion in 2024 and expected to reach 2.329 USD Billion by 2035, stands out as a major contributor owing to rapid industrialization and a focus on air quality improvement.

    South America accounted for 0.277 USD Billion in 2024, rising to 0.671 USD Billion by 2035, where increasing industrial activities drive the market. Lastly, the Middle East and Africa showed a market valuation of 0.721 USD Billion in 2024, anticipated to grow to 1.224 USD Billion by 2035, driven by growing water treatment concerns and industrial applications.

    Collectively, these dynamics reflected the significant growth drivers and opportunities within the  Activated Carbon Market segmentation, shaping its landscape until 2035.

    Activated Carbon Market Regional Insights

    Source: Primary Research, Secondary Research, Market Research Future Database and Analyst Review

    Key Players and Competitive Insights

    The  Activated Carbon Market is characterized by a dynamic competitive landscape that is shaped by the increasing demand for purified air and water, as well as stringent environmental regulations. Companies operating in this market are continually striving to enhance their product offerings and expand their geographic reach in response to varying consumer requirements and competitive pressures.

    The presence of numerous players ranging from large, established companies to emerging startups emphasizes the diversity within the market. These entities adopt various strategies, including technological innovation, strategic partnerships, and mergers and acquisitions, to maintain a competitive edge.

    The ongoing research into the development of new activated carbon products tailored for specific applications further intensifies competition among market participants, driving advancements that are crucial for meeting the evolving needs of end-users across industries such as water treatment, air purification, and food processing.

    Kuraray Co. Ltd stands out in the  Activated Carbon Market due to its strong commitment to innovation and quality. The company leverages its advanced manufacturing capabilities to produce high-performance activated carbon products that cater to various applications, including air and water treatment.

    With a robust research and development framework, Kuraray Co Ltd has established a solid reputation for delivering state-of-the-art solutions, which is a fundamental strength that sets it apart from competitors.

    Additionally, its extensive distribution network facilitates a strong market presence, allowing the company to respond promptly to customer needs and tap into emerging markets effectively. This strategic focus on quality and service excellence reinforces Kuraray Co Ltd's position as a leading player in the activated carbon segment.

    Carbon Resources LLC further enhances the competitive dynamics of the  Activated Carbon Market with its comprehensive portfolio of products and services. The company specializes in providing activated carbon solutions tailored to various industrial applications, including air and water purification, which broadens its market appeal.

    Carbon Resources LLC enjoys a significant presence in multiple regions, making it a key participant in  initiatives aimed at environmental sustainability. One of its notable strengths lies in its commitment to sustainability and quality, offering products that are both effective and environmentally friendly.

    The company's strategic initiatives, including recent mergers and acquisitions, have strengthened its market position and expanded its capabilities, enabling it to deliver a wider range of customized solutions to meet the diverse needs of its customers. The focus on innovation and sustainable practices positions Carbon Resources LLC as an influential player in the activated carbon sector ly.

    Key Companies in the Activated Carbon Market market include

    Industry Developments

    • Q2 2024: Osaka Gas Chemicals Expands Activated Carbon Production Capacity in Japan Osaka Gas Chemicals announced the completion of a new production line for activated carbon at its Takasago Plant, increasing its annual capacity to meet rising demand in water purification and air filtration sectors.
    • Q2 2024: Cabot Corporation Launches New Activated Carbon Product for PFAS Removal Cabot Corporation introduced a new line of activated carbon products specifically designed to remove per- and polyfluoroalkyl substances (PFAS) from drinking water, targeting utilities and industrial customers.
    • Q3 2024: Donau Carbon Opens New Activated Carbon Regeneration Facility in Germany Donau Carbon inaugurated a state-of-the-art regeneration facility for spent activated carbon in Frankfurt, aiming to provide sustainable recycling solutions for industrial clients across Europe.
    • Q2 2024: Cabot Corporation Signs Multi-Year Supply Agreement with Major Water Utility Cabot Corporation secured a multi-year contract to supply activated carbon to a leading European water utility, supporting large-scale municipal water purification projects.
    • Q1 2025: Osaka Gas Chemicals Acquires Stake in Southeast Asian Activated Carbon Producer Osaka Gas Chemicals acquired a minority stake in a Southeast Asian activated carbon manufacturer to strengthen its supply chain and expand its presence in the Asia-Pacific region.
    • Q2 2025: Cabot Corporation Appoints New Vice President for Activated Carbon Division Cabot Corporation announced the appointment of a new Vice President to lead its Activated Carbon Division, focusing on global expansion and innovation in environmental applications.
    • Q2 2024: PURAGEN ACTIVATED CARBONS Launches Coconut-Shell Based Activated Carbon for Air Purification PURAGEN ACTIVATED CARBONS introduced a new coconut-shell based activated carbon product line aimed at improving indoor air quality in commercial and residential buildings.
    • Q3 2024: CARBOTECH AC GMBH Partners with European Automotive Supplier for Emissions Control CARBOTECH AC GMBH entered into a partnership with a major European automotive supplier to provide activated carbon solutions for vehicle emissions control systems.
    • Q1 2025: Donau Carbon Wins Contract for Industrial Wastewater Treatment Project in Poland Donau Carbon secured a contract to supply activated carbon for a large-scale industrial wastewater treatment facility in Poland, supporting stricter EU environmental regulations.
    • Q2 2025: Osaka Gas Chemicals Announces Joint Venture with Indian Partner for Activated Carbon Production Osaka Gas Chemicals formed a joint venture with an Indian chemical company to establish a new activated carbon manufacturing plant in India, targeting the growing demand in South Asia.
    • Q2 2024: Cabot Corporation Receives Regulatory Approval for New Activated Carbon Plant in the U.S. Cabot Corporation received final regulatory approval to construct a new activated carbon production facility in the United States, aimed at serving the North American water treatment market.
    • Q3 2024: PURAGEN ACTIVATED CARBONS Signs Distribution Agreement with Major U.S. Chemical Distributor PURAGEN ACTIVATED CARBONS signed a distribution agreement with a leading U.S. chemical distributor to expand the reach of its activated carbon products across North America.

    Future Outlook

    Activated Carbon Market Future Outlook

    The Activated Carbon Market is projected to grow at a 6.35% CAGR from 2024 to 2035, driven by increasing environmental regulations, demand for air and water purification, and advancements in manufacturing technologies.

    New opportunities lie in:

    • Develop innovative activated carbon products for emerging applications in energy storage.
    • Expand into developing markets with tailored solutions for local water treatment needs.
    • Leverage digital technologies for enhanced supply chain efficiency and customer engagement.

    By 2035, the Activated Carbon Market is expected to achieve robust growth, solidifying its role in environmental sustainability.

    Market Segmentation

    Activated Carbon Market Type Outlook

    • Granular Activated Carbon
    • Powdered Activated Carbon
    • Extruded Activated Carbon

    Activated Carbon Market End-use Outlook

    • Industrial
    • Residential
    • Commercial

    Activated Carbon Market Regional Outlook

    • North America
    • Europe
    • South America
    • Asia Pacific
    • Middle East and Africa

    Activated Carbon Market Application Outlook

    • Water Treatment
    • Air Purification
    • Food and Beverage Processing
    • Pharmaceuticals
    • Gold Recovery

    Activated Carbon Market Production Method Outlook

    • Physical Activation
    • Chemical Activation

    Report Scope

    Report Attribute/Metric Details
    Market Size 2023 3.58(USD Billion)
    Market Size 2024 3.81(USD Billion)
    Market Size 2035 7.5(USD Billion)
    Compound Annual Growth Rate (CAGR) 6.35% (2025 - 2035)
    Report Coverage Revenue Forecast, Competitive Landscape, Growth Factors, and Trends
    Base Year 2024
    Market Forecast Period 2025 - 2035
    Historical Data 2019 - 2024
    Market Forecast Units USD Billion
    Key Companies Profiled Kuraray Co Ltd, Carbon Resources LLC, Carbotech AC GmbH, Ingevity Corporation, SABIC, Chongqing Yuanlian, Haycarb PLC, Silcarbon Aktivkohle GmbH, Calgon Carbon Corporation, Cabot Corporation, 3M Company, Advent Environmental, Activated Carbon Technologies, Osaka Gas Co Ltd
    Segments Covered Application, Type, End-use, Production Method, Regional
    Key Market Opportunities Increasing demand in air purification, Growth in water treatment applications, Expansion of industrial processes, Rising regulatory standards, Emerging technologies in carbon production
    Key Market Dynamics Increasing demand for water treatment, Growing industrial applications, Strict environmental regulations, Rising air pollution concerns, Technological advancements in production
    Countries Covered North America, Europe, APAC, South America, MEA

    Market Highlights

    Author
    Chitranshi Jaiswal
    Research Analyst Level I

    In her 3 years of experience in the market research field, she has handled critical cross-domain projects. She has an in-depth knowledge of market estimation & analysis, problem-solving, primary as well as secondary research, and team management.She holds an engineering degree and is an MBA professional from a well-known university, capable of evaluating the market and competitive conditions. An exceptional strategist with excellent communication skills and a passion for delivering cutting-edge & practical insights for the market. Proficient in multi-tasking, and can successfully deal with competing demands, while maintaining complete confidentiality. Generated business through active client and project development, networking, and high-quality responses. Her knowledge and skills have helped in making solid business decisions, securing funding from investors, and avoiding business failures.

    Leave a Comment

    FAQs

    What was the market size of the Activated Carbon Market expected to be in 2024?

    The Activated Carbon Market was valued at 3.81 USD Billion in 2024.

    What is the projected market size of the Activated Carbon Market by 2035?

    By 2035, the Activated Carbon Market is projected to reach a value of 7.5 USD Billion.

    What is the expected CAGR for the Activated Carbon Market from 2025 to 2035?

    The expected CAGR for the Activated Carbon Market from 2025 to 2035 is 6.35%.

    Which application held the largest market share in the Activated Carbon Market in 2024?

    In 2024, the Water Treatment application held the largest market share, valued at 1.25 USD Billion.

    What is the market valuation for the Air Purification application in 2035?

    The market valuation for the Air Purification application is expected to reach 2.0 USD Billion by 2035.

    Who are the major players in the Activated Carbon Market?

    Key players in the market include Kuraray Co Ltd, Carbon Resources LLC, and Ingevity Corporation, among others.

    What is the market size of the Activated Carbon Market in the Asia Pacific region by 2035?

    The Asia Pacific region is projected to have a market size of 2.329 USD Billion by 2035.

    How much was the North American segment of the Activated Carbon Market expected to be valued in 2024?

    The North American segment was valued at 0.871 USD Billion in 2024.

    What is the expected growth rate for the Food and Beverage Processing application from 2024 to 2035?

    The Food and Beverage Processing application is expected to grow from 0.8 USD Billion in 2024 to 1.6 USD Billion by 2035.

    What is the market size for the Pharmaceuticals application by 2035?

    The Pharmaceuticals application is projected to reach a market size of 1.2 USD Billion by 2035.

    1. EXECUTIVE
    2. SUMMARY
    3. Market Overview
    4. Key Findings
    5. Market Segmentation
    6. Competitive Landscape
    7. Challenges and Opportunities
    8. Future Outlook
    9. MARKET INTRODUCTION
    10. Definition
    11. Scope of the study
    12. Research Objective
    13. Assumption
    14. Limitations
    15. RESEARCH
    16. METHODOLOGY
    17. Overview
    18. Data
    19. Mining
    20. Secondary Research
    21. Primary
    22. Research
    23. Primary Interviews and Information Gathering
    24. Process
    25. Breakdown of Primary Respondents
    26. Forecasting
    27. Model
    28. Market Size Estimation
    29. Bottom-Up
    30. Approach
    31. Top-Down Approach
    32. Data
    33. Triangulation
    34. Validation
    35. MARKET
    36. DYNAMICS
    37. Overview
    38. Drivers
    39. Restraints
    40. Opportunities
    41. MARKET FACTOR ANALYSIS
    42. Value chain Analysis
    43. Porter's
    44. Five Forces Analysis
    45. Bargaining Power of Suppliers
    46. Bargaining
    47. Power of Buyers
    48. Threat of New Entrants
    49. Threat
    50. of Substitutes
    51. Intensity of Rivalry
    52. COVID-19
    53. Impact Analysis
    54. Market Impact Analysis
    55. Regional
    56. Impact
    57. Opportunity and Threat Analysis
    58. Activated
    59. Carbon Market, BY Application (USD Billion)
    60. Water
    61. Treatment
    62. Air Purification
    63. Food
    64. and Beverage Processing
    65. Pharmaceuticals
    66. Gold
    67. Recovery
    68. Activated Carbon Market,
    69. BY Type (USD Billion)
    70. Granular Activated Carbon
    71. Powdered
    72. Activated Carbon
    73. Extruded Activated Carbon
    74. Activated
    75. Carbon Market, BY End Use (USD Billion)
    76. Industrial
    77. Residential
    78. Commercial
    79. Activated
    80. Carbon Market, BY Production Method (USD Billion)
    81. Physical
    82. Activation
    83. Chemical Activation
    84. Activated
    85. Carbon Market, BY Regional (USD Billion)
    86. North
    87. America
    88. US
    89. Canada
    90. Europe
    91. Germany
    92. UK
    93. France
    94. Russia
    95. Italy
    96. Spain
    97. Rest
    98. of Europe
    99. APAC
    100. China
    101. India
    102. Japan
    103. South
    104. Korea
    105. Malaysia
    106. Thailand
    107. Indonesia
    108. Rest
    109. of APAC
    110. South America
    111. Brazil
    112. Mexico
    113. Argentina
    114. Rest
    115. of South America
    116. MEA
    117. GCC
    118. Countries
    119. South Africa
    120. Rest
    121. of MEA
    122. Competitive Landscape
    123. Overview
    124. Competitive
    125. Analysis
    126. Market share Analysis
    127. Major
    128. Growth Strategy in the Activated Carbon Market
    129. Competitive
    130. Benchmarking
    131. Leading Players in Terms of Number of Developments
    132. in the Activated Carbon Market
    133. Key developments and growth
    134. strategies
    135. New Product Launch/Service Deployment
    136. Merger
    137. & Acquisitions
    138. Joint Ventures
    139. Major
    140. Players Financial Matrix
    141. Sales and Operating Income
    142. Major
    143. Players R&D Expenditure. 2023
    144. Company
    145. Profiles
    146. Norit Netherlands BV
    147. Financial
    148. Overview
    149. Products Offered
    150. Key
    151. Developments
    152. SWOT Analysis
    153. Key
    154. Strategies
    155. Evoqua Water Technologies
    156. Financial
    157. Overview
    158. Products Offered
    159. Key
    160. Developments
    161. SWOT Analysis
    162. Key
    163. Strategies
    164. Activated Carbon Technologies
    165. Financial
    166. Overview
    167. Products Offered
    168. Key
    169. Developments
    170. SWOT Analysis
    171. Key
    172. Strategies
    173. Ingevity Corporation
    174. Financial
    175. Overview
    176. Products Offered
    177. Key
    178. Developments
    179. SWOT Analysis
    180. Key
    181. Strategies
    182. Kurary Co Ltd
    183. Financial
    184. Overview
    185. Products Offered
    186. Key
    187. Developments
    188. SWOT Analysis
    189. Key
    190. Strategies
    191. Carbon Company
    192. Financial
    193. Overview
    194. Products Offered
    195. Key
    196. Developments
    197. SWOT Analysis
    198. Key
    199. Strategies
    200. CarbPure LLC
    201. Financial
    202. Overview
    203. Products Offered
    204. Key
    205. Developments
    206. SWOT Analysis
    207. Key
    208. Strategies
    209. Desotec
    210. Financial
    211. Overview
    212. Products Offered
    213. Key
    214. Developments
    215. SWOT Analysis
    216. Key
    217. Strategies
    218. Silcarbon Aktivkohle GmbH
    219. Financial
    220. Overview
    221. Products Offered
    222. Key
    223. Developments
    224. SWOT Analysis
    225. Key
    226. Strategies
    227. KURARY CO LTD
    228. Financial
    229. Overview
    230. Products Offered
    231. Key
    232. Developments
    233. SWOT Analysis
    234. Key
    235. Strategies
    236. Haycarb PLC
    237. Financial
    238. Overview
    239. Products Offered
    240. Key
    241. Developments
    242. SWOT Analysis
    243. Key
    244. Strategies
    245. Calgon Carbon Corporation
    246. Financial
    247. Overview
    248. Products Offered
    249. Key
    250. Developments
    251. SWOT Analysis
    252. Key
    253. Strategies
    254. Cabot Corporation
    255. Financial
    256. Overview
    257. Products Offered
    258. Key
    259. Developments
    260. SWOT Analysis
    261. Key
    262. Strategies
    263. OSAKA GAS Co Ltd
    264. Financial
    265. Overview
    266. Products Offered
    267. Key
    268. Developments
    269. SWOT Analysis
    270. Key
    271. Strategies
    272. References
    273. Related
    274. Reports
    275. LIST
    276. OF ASSUMPTIONS
    277. North America Activated Carbon Market
    278. SIZE ESTIMATES & FORECAST, BY APPLICATION, 2019-2035 (USD Billions)
    279. North
    280. America Activated Carbon Market SIZE ESTIMATES & FORECAST, BY TYPE, 2019-2035
    281. (USD Billions)
    282. North America Activated Carbon Market
    283. SIZE ESTIMATES & FORECAST, BY END USE, 2019-2035 (USD Billions)
    284. North
    285. America Activated Carbon Market SIZE ESTIMATES & FORECAST, BY PRODUCTION METHOD,
    286. 2035 (USD Billions)
    287. North America Activated Carbon
    288. Market SIZE ESTIMATES & FORECAST, BY REGIONAL, 2019-2035 (USD Billions)
    289. US
    290. Activated Carbon Market SIZE ESTIMATES & FORECAST, BY APPLICATION, 2019-2035
    291. (USD Billions)
    292. US Activated Carbon Market SIZE ESTIMATES
    293. & FORECAST, BY TYPE, 2019-2035 (USD Billions)
    294. US
    295. Activated Carbon Market SIZE ESTIMATES & FORECAST, BY END USE, 2019-2035 (USD
    296. Billions)
    297. US Activated Carbon Market SIZE ESTIMATES &
    298. FORECAST, BY PRODUCTION METHOD, 2019-2035 (USD Billions)
    299. US
    300. Activated Carbon Market SIZE ESTIMATES & FORECAST, BY REGIONAL, 2019-2035 (USD
    301. Billions)
    302. Canada Activated Carbon Market SIZE ESTIMATES
    303. & FORECAST, BY APPLICATION, 2019-2035 (USD Billions)
    304. Canada
    305. Activated Carbon Market SIZE ESTIMATES & FORECAST, BY TYPE, 2019-2035 (USD Billions)
    306. Canada
    307. Activated Carbon Market SIZE ESTIMATES & FORECAST, BY END USE, 2019-2035 (USD
    308. Billions)
    309. Canada Activated Carbon Market SIZE ESTIMATES
    310. & FORECAST, BY PRODUCTION METHOD, 2019-2035 (USD Billions)
    311. Canada
    312. Activated Carbon Market SIZE ESTIMATES & FORECAST, BY REGIONAL, 2019-2035 (USD
    313. Billions)
    314. Europe Activated Carbon Market SIZE ESTIMATES
    315. & FORECAST, BY APPLICATION, 2019-2035 (USD Billions)
    316. Europe
    317. Activated Carbon Market SIZE ESTIMATES & FORECAST, BY TYPE, 2019-2035 (USD Billions)
    318. Europe
    319. Activated Carbon Market SIZE ESTIMATES & FORECAST, BY END USE, 2019-2035 (USD
    320. Billions)
    321. Europe Activated Carbon Market SIZE ESTIMATES
    322. & FORECAST, BY PRODUCTION METHOD, 2019-2035 (USD Billions)
    323. Europe
    324. Activated Carbon Market SIZE ESTIMATES & FORECAST, BY REGIONAL, 2019-2035 (USD
    325. Billions)
    326. Germany Activated Carbon Market SIZE ESTIMATES
    327. & FORECAST, BY APPLICATION, 2019-2035 (USD Billions)
    328. Germany
    329. Activated Carbon Market SIZE ESTIMATES & FORECAST, BY TYPE, 2019-2035 (USD Billions)
    330. Germany
    331. Activated Carbon Market SIZE ESTIMATES & FORECAST, BY END USE, 2019-2035 (USD
    332. Billions)
    333. Germany Activated Carbon Market SIZE ESTIMATES
    334. & FORECAST, BY PRODUCTION METHOD, 2019-2035 (USD Billions)
    335. Germany
    336. Activated Carbon Market SIZE ESTIMATES & FORECAST, BY REGIONAL, 2019-2035 (USD
    337. Billions)
    338. UK Activated Carbon Market SIZE ESTIMATES &
    339. FORECAST, BY APPLICATION, 2019-2035 (USD Billions)
    340. UK
    341. Activated Carbon Market SIZE ESTIMATES & FORECAST, BY TYPE, 2019-2035 (USD Billions)
    342. UK
    343. Activated Carbon Market SIZE ESTIMATES & FORECAST, BY END USE, 2019-2035 (USD
    344. Billions)
    345. UK Activated Carbon Market SIZE ESTIMATES &
    346. FORECAST, BY PRODUCTION METHOD, 2019-2035 (USD Billions)
    347. UK
    348. Activated Carbon Market SIZE ESTIMATES & FORECAST, BY REGIONAL, 2019-2035 (USD
    349. Billions)
    350. France Activated Carbon Market SIZE ESTIMATES
    351. & FORECAST, BY APPLICATION, 2019-2035 (USD Billions)
    352. France
    353. Activated Carbon Market SIZE ESTIMATES & FORECAST, BY TYPE, 2019-2035 (USD Billions)
    354. France
    355. Activated Carbon Market SIZE ESTIMATES & FORECAST, BY END USE, 2019-2035 (USD
    356. Billions)
    357. France Activated Carbon Market SIZE ESTIMATES
    358. & FORECAST, BY PRODUCTION METHOD, 2019-2035 (USD Billions)
    359. France
    360. Activated Carbon Market SIZE ESTIMATES & FORECAST, BY REGIONAL, 2019-2035 (USD
    361. Billions)
    362. Russia Activated Carbon Market SIZE ESTIMATES
    363. & FORECAST, BY APPLICATION, 2019-2035 (USD Billions)
    364. Russia
    365. Activated Carbon Market SIZE ESTIMATES & FORECAST, BY TYPE, 2019-2035 (USD Billions)
    366. Russia
    367. Activated Carbon Market SIZE ESTIMATES & FORECAST, BY END USE, 2019-2035 (USD
    368. Billions)
    369. Russia Activated Carbon Market SIZE ESTIMATES
    370. & FORECAST, BY PRODUCTION METHOD, 2019-2035 (USD Billions)
    371. Russia
    372. Activated Carbon Market SIZE ESTIMATES & FORECAST, BY REGIONAL, 2019-2035 (USD
    373. Billions)
    374. Italy Activated Carbon Market SIZE ESTIMATES
    375. & FORECAST, BY APPLICATION, 2019-2035 (USD Billions)
    376. Italy
    377. Activated Carbon Market SIZE ESTIMATES & FORECAST, BY TYPE, 2019-2035 (USD Billions)
    378. Italy
    379. Activated Carbon Market SIZE ESTIMATES & FORECAST, BY END USE, 2019-2035 (USD
    380. Billions)
    381. Italy Activated Carbon Market SIZE ESTIMATES
    382. & FORECAST, BY PRODUCTION METHOD, 2019-2035 (USD Billions)
    383. Italy
    384. Activated Carbon Market SIZE ESTIMATES & FORECAST, BY REGIONAL, 2019-2035 (USD
    385. Billions)
    386. Spain Activated Carbon Market SIZE ESTIMATES
    387. & FORECAST, BY APPLICATION, 2019-2035 (USD Billions)
    388. Spain
    389. Activated Carbon Market SIZE ESTIMATES & FORECAST, BY TYPE, 2019-2035 (USD Billions)
    390. Spain
    391. Activated Carbon Market SIZE ESTIMATES & FORECAST, BY END USE, 2019-2035 (USD
    392. Billions)
    393. Spain Activated Carbon Market SIZE ESTIMATES
    394. & FORECAST, BY PRODUCTION METHOD, 2019-2035 (USD Billions)
    395. Spain
    396. Activated Carbon Market SIZE ESTIMATES & FORECAST, BY REGIONAL, 2019-2035 (USD
    397. Billions)
    398. Rest of Europe Activated Carbon Market SIZE
    399. ESTIMATES & FORECAST, BY APPLICATION, 2019-2035 (USD Billions)
    400. Rest
    401. of Europe Activated Carbon Market SIZE ESTIMATES & FORECAST, BY TYPE, 2019-2035
    402. (USD Billions)
    403. Rest of Europe Activated Carbon Market
    404. SIZE ESTIMATES & FORECAST, BY END USE, 2019-2035 (USD Billions)
    405. Rest
    406. of Europe Activated Carbon Market SIZE ESTIMATES & FORECAST, BY PRODUCTION METHOD,
    407. 2035 (USD Billions)
    408. Rest of Europe Activated Carbon
    409. Market SIZE ESTIMATES & FORECAST, BY REGIONAL, 2019-2035 (USD Billions)
    410. APAC
    411. Activated Carbon Market SIZE ESTIMATES & FORECAST, BY APPLICATION, 2019-2035
    412. (USD Billions)
    413. APAC Activated Carbon Market SIZE ESTIMATES
    414. & FORECAST, BY TYPE, 2019-2035 (USD Billions)
    415. APAC
    416. Activated Carbon Market SIZE ESTIMATES & FORECAST, BY END USE, 2019-2035 (USD
    417. Billions)
    418. APAC Activated Carbon Market SIZE ESTIMATES
    419. & FORECAST, BY PRODUCTION METHOD, 2019-2035 (USD Billions)
    420. APAC
    421. Activated Carbon Market SIZE ESTIMATES & FORECAST, BY REGIONAL, 2019-2035 (USD
    422. Billions)
    423. China Activated Carbon Market SIZE ESTIMATES
    424. & FORECAST, BY APPLICATION, 2019-2035 (USD Billions)
    425. China
    426. Activated Carbon Market SIZE ESTIMATES & FORECAST, BY TYPE, 2019-2035 (USD Billions)
    427. China
    428. Activated Carbon Market SIZE ESTIMATES & FORECAST, BY END USE, 2019-2035 (USD
    429. Billions)
    430. China Activated Carbon Market SIZE ESTIMATES
    431. & FORECAST, BY PRODUCTION METHOD, 2019-2035 (USD Billions)
    432. China
    433. Activated Carbon Market SIZE ESTIMATES & FORECAST, BY REGIONAL, 2019-2035 (USD
    434. Billions)
    435. India Activated Carbon Market SIZE ESTIMATES
    436. & FORECAST, BY APPLICATION, 2019-2035 (USD Billions)
    437. India
    438. Activated Carbon Market SIZE ESTIMATES & FORECAST, BY TYPE, 2019-2035 (USD Billions)
    439. India
    440. Activated Carbon Market SIZE ESTIMATES & FORECAST, BY END USE, 2019-2035 (USD
    441. Billions)
    442. India Activated Carbon Market SIZE ESTIMATES
    443. & FORECAST, BY PRODUCTION METHOD, 2019-2035 (USD Billions)
    444. India
    445. Activated Carbon Market SIZE ESTIMATES & FORECAST, BY REGIONAL, 2019-2035 (USD
    446. Billions)
    447. Japan Activated Carbon Market SIZE ESTIMATES
    448. & FORECAST, BY APPLICATION, 2019-2035 (USD Billions)
    449. Japan
    450. Activated Carbon Market SIZE ESTIMATES & FORECAST, BY TYPE, 2019-2035 (USD Billions)
    451. Japan
    452. Activated Carbon Market SIZE ESTIMATES & FORECAST, BY END USE, 2019-2035 (USD
    453. Billions)
    454. Japan Activated Carbon Market SIZE ESTIMATES
    455. & FORECAST, BY PRODUCTION METHOD, 2019-2035 (USD Billions)
    456. Japan
    457. Activated Carbon Market SIZE ESTIMATES & FORECAST, BY REGIONAL, 2019-2035 (USD
    458. Billions)
    459. South Korea Activated Carbon Market SIZE ESTIMATES
    460. & FORECAST, BY APPLICATION, 2019-2035 (USD Billions)
    461. South
    462. Korea Activated Carbon Market SIZE ESTIMATES & FORECAST, BY TYPE, 2019-2035
    463. (USD Billions)
    464. South Korea Activated Carbon Market SIZE
    465. ESTIMATES & FORECAST, BY END USE, 2019-2035 (USD Billions)
    466. South
    467. Korea Activated Carbon Market SIZE ESTIMATES & FORECAST, BY PRODUCTION METHOD,
    468. 2035 (USD Billions)
    469. South Korea Activated Carbon
    470. Market SIZE ESTIMATES & FORECAST, BY REGIONAL, 2019-2035 (USD Billions)
    471. Malaysia
    472. Activated Carbon Market SIZE ESTIMATES & FORECAST, BY APPLICATION, 2019-2035
    473. (USD Billions)
    474. Malaysia Activated Carbon Market SIZE
    475. ESTIMATES & FORECAST, BY TYPE, 2019-2035 (USD Billions)
    476. Malaysia
    477. Activated Carbon Market SIZE ESTIMATES & FORECAST, BY END USE, 2019-2035 (USD
    478. Billions)
    479. Malaysia Activated Carbon Market SIZE ESTIMATES
    480. & FORECAST, BY PRODUCTION METHOD, 2019-2035 (USD Billions)
    481. Malaysia
    482. Activated Carbon Market SIZE ESTIMATES & FORECAST, BY REGIONAL, 2019-2035 (USD
    483. Billions)
    484. Thailand Activated Carbon Market SIZE ESTIMATES
    485. & FORECAST, BY APPLICATION, 2019-2035 (USD Billions)
    486. Thailand
    487. Activated Carbon Market SIZE ESTIMATES & FORECAST, BY TYPE, 2019-2035 (USD Billions)
    488. Thailand
    489. Activated Carbon Market SIZE ESTIMATES & FORECAST, BY END USE, 2019-2035 (USD
    490. Billions)
    491. Thailand Activated Carbon Market SIZE ESTIMATES
    492. & FORECAST, BY PRODUCTION METHOD, 2019-2035 (USD Billions)
    493. Thailand
    494. Activated Carbon Market SIZE ESTIMATES & FORECAST, BY REGIONAL, 2019-2035 (USD
    495. Billions)
    496. Indonesia Activated Carbon Market SIZE ESTIMATES
    497. & FORECAST, BY APPLICATION, 2019-2035 (USD Billions)
    498. Indonesia
    499. Activated Carbon Market SIZE ESTIMATES & FORECAST, BY TYPE, 2019-2035 (USD Billions)
    500. Indonesia
    501. Activated Carbon Market SIZE ESTIMATES & FORECAST, BY END USE, 2019-2035 (USD
    502. Billions)
    503. Indonesia Activated Carbon Market SIZE ESTIMATES
    504. & FORECAST, BY PRODUCTION METHOD, 2019-2035 (USD Billions)
    505. Indonesia
    506. Activated Carbon Market SIZE ESTIMATES & FORECAST, BY REGIONAL, 2019-2035 (USD
    507. Billions)
    508. Rest of APAC Activated Carbon Market SIZE ESTIMATES
    509. & FORECAST, BY APPLICATION, 2019-2035 (USD Billions)
    510. Rest
    511. of APAC Activated Carbon Market SIZE ESTIMATES & FORECAST, BY TYPE, 2019-2035
    512. (USD Billions)
    513. Rest of APAC Activated Carbon Market SIZE
    514. ESTIMATES & FORECAST, BY END USE, 2019-2035 (USD Billions)
    515. Rest
    516. of APAC Activated Carbon Market SIZE ESTIMATES & FORECAST, BY PRODUCTION METHOD,
    517. 2035 (USD Billions)
    518. Rest of APAC Activated Carbon
    519. Market SIZE ESTIMATES & FORECAST, BY REGIONAL, 2019-2035 (USD Billions)
    520. South
    521. America Activated Carbon Market SIZE ESTIMATES & FORECAST, BY APPLICATION, 2019-2035
    522. (USD Billions)
    523. South America Activated Carbon Market
    524. SIZE ESTIMATES & FORECAST, BY TYPE, 2019-2035 (USD Billions)
    525. South
    526. America Activated Carbon Market SIZE ESTIMATES & FORECAST, BY END USE, 2019-2035
    527. (USD Billions)
    528. South America Activated Carbon Market
    529. SIZE ESTIMATES & FORECAST, BY PRODUCTION METHOD, 2019-2035 (USD Billions)
    530. South
    531. America Activated Carbon Market SIZE ESTIMATES & FORECAST, BY REGIONAL, 2019-2035
    532. (USD Billions)
    533. Brazil Activated Carbon Market SIZE ESTIMATES
    534. & FORECAST, BY APPLICATION, 2019-2035 (USD Billions)
    535. Brazil
    536. Activated Carbon Market SIZE ESTIMATES & FORECAST, BY TYPE, 2019-2035 (USD Billions)
    537. Brazil
    538. Activated Carbon Market SIZE ESTIMATES & FORECAST, BY END USE, 2019-2035 (USD
    539. Billions)
    540. Brazil Activated Carbon Market SIZE ESTIMATES
    541. & FORECAST, BY PRODUCTION METHOD, 2019-2035 (USD Billions)
    542. Brazil
    543. Activated Carbon Market SIZE ESTIMATES & FORECAST, BY REGIONAL, 2019-2035 (USD
    544. Billions)
    545. Mexico Activated Carbon Market SIZE ESTIMATES
    546. & FORECAST, BY APPLICATION, 2019-2035 (USD Billions)
    547. Mexico
    548. Activated Carbon Market SIZE ESTIMATES & FORECAST, BY TYPE, 2019-2035 (USD Billions)
    549. Mexico
    550. Activated Carbon Market SIZE ESTIMATES & FORECAST, BY END USE, 2019-2035 (USD
    551. Billions)
    552. Mexico Activated Carbon Market SIZE ESTIMATES
    553. & FORECAST, BY PRODUCTION METHOD, 2019-2035 (USD Billions)
    554. Mexico
    555. Activated Carbon Market SIZE ESTIMATES & FORECAST, BY REGIONAL, 2019-2035 (USD
    556. Billions)
    557. Argentina Activated Carbon Market SIZE ESTIMATES
    558. & FORECAST, BY APPLICATION, 2019-2035 (USD Billions)
    559. Argentina
    560. Activated Carbon Market SIZE ESTIMATES & FORECAST, BY TYPE, 2019-2035 (USD Billions)
    561. Argentina
    562. Activated Carbon Market SIZE ESTIMATES & FORECAST, BY END USE, 2019-2035 (USD
    563. Billions)
    564. Argentina Activated Carbon Market SIZE ESTIMATES
    565. & FORECAST, BY PRODUCTION METHOD, 2019-2035 (USD Billions)
    566. Argentina
    567. Activated Carbon Market SIZE ESTIMATES & FORECAST, BY REGIONAL, 2019-2035 (USD
    568. Billions)
    569. Rest of South America Activated Carbon Market
    570. SIZE ESTIMATES & FORECAST, BY APPLICATION, 2019-2035 (USD Billions)
    571. Rest
    572. of South America Activated Carbon Market SIZE ESTIMATES & FORECAST, BY TYPE,
    573. 2035 (USD Billions)
    574. Rest of South America Activated
    575. Carbon Market SIZE ESTIMATES & FORECAST, BY END USE, 2019-2035 (USD Billions)
    576. Rest
    577. of South America Activated Carbon Market SIZE ESTIMATES & FORECAST, BY PRODUCTION
    578. METHOD, 2019-2035 (USD Billions)
    579. Rest of South America
    580. Activated Carbon Market SIZE ESTIMATES & FORECAST, BY REGIONAL, 2019-2035 (USD
    581. Billions)
    582. MEA Activated Carbon Market SIZE ESTIMATES
    583. & FORECAST, BY APPLICATION, 2019-2035 (USD Billions)
    584. MEA
    585. Activated Carbon Market SIZE ESTIMATES & FORECAST, BY TYPE, 2019-2035 (USD Billions)
    586. MEA
    587. Activated Carbon Market SIZE ESTIMATES & FORECAST, BY END USE, 2019-2035 (USD
    588. Billions)
    589. MEA Activated Carbon Market SIZE ESTIMATES
    590. & FORECAST, BY PRODUCTION METHOD, 2019-2035 (USD Billions)
    591. MEA
    592. Activated Carbon Market SIZE ESTIMATES & FORECAST, BY REGIONAL, 2019-2035 (USD
    593. Billions)
    594. GCC Countries Activated Carbon Market SIZE
    595. ESTIMATES & FORECAST, BY APPLICATION, 2019-2035 (USD Billions)
    596. GCC
    597. Countries Activated Carbon Market SIZE ESTIMATES & FORECAST, BY TYPE, 2019-2035
    598. (USD Billions)
    599. GCC Countries Activated Carbon Market
    600. SIZE ESTIMATES & FORECAST, BY END USE, 2019-2035 (USD Billions)
    601. GCC
    602. Countries Activated Carbon Market SIZE ESTIMATES & FORECAST, BY PRODUCTION METHOD,
    603. 2035 (USD Billions)
    604. GCC Countries Activated Carbon
    605. Market SIZE ESTIMATES & FORECAST, BY REGIONAL, 2019-2035 (USD Billions)
    606. South
    607. Africa Activated Carbon Market SIZE ESTIMATES & FORECAST, BY APPLICATION, 2019-2035
    608. (USD Billions)
    609. South Africa Activated Carbon Market SIZE
    610. ESTIMATES & FORECAST, BY TYPE, 2019-2035 (USD Billions)
    611. South
    612. Africa Activated Carbon Market SIZE ESTIMATES & FORECAST, BY END USE, 2019-2035
    613. (USD Billions)
    614. South Africa Activated Carbon Market SIZE
    615. ESTIMATES & FORECAST, BY PRODUCTION METHOD, 2019-2035 (USD Billions)
    616. South
    617. Africa Activated Carbon Market SIZE ESTIMATES & FORECAST, BY REGIONAL, 2019-2035
    618. (USD Billions)
    619. Rest of MEA Activated Carbon Market SIZE
    620. ESTIMATES & FORECAST, BY APPLICATION, 2019-2035 (USD Billions)
    621. Rest
    622. of MEA Activated Carbon Market SIZE ESTIMATES & FORECAST, BY TYPE, 2019-2035
    623. (USD Billions)
    624. Rest of MEA Activated Carbon Market SIZE
    625. ESTIMATES & FORECAST, BY END USE, 2019-2035 (USD Billions)
    626. Rest
    627. of MEA Activated Carbon Market SIZE ESTIMATES & FORECAST, BY PRODUCTION METHOD,
    628. 2035 (USD Billions)
    629. Rest of MEA Activated Carbon
    630. Market SIZE ESTIMATES & FORECAST, BY REGIONAL, 2019-2035 (USD Billions)
    631. PRODUCT
    632. LAUNCH/PRODUCT DEVELOPMENT/APPROVAL
    633. ACQUISITION/PARTNERSHIP
    634. LIST
    635. Of figures
    636. MARKET SYNOPSIS
    637. NORTH
    638. AMERICA ACTIVATED CARBON MARKET ANALYSIS
    639. US ACTIVATED
    640. CARBON MARKET ANALYSIS BY APPLICATION
    641. US ACTIVATED CARBON
    642. MARKET ANALYSIS BY TYPE
    643. US ACTIVATED CARBON MARKET ANALYSIS
    644. BY END USE
    645. US ACTIVATED CARBON MARKET ANALYSIS BY PRODUCTION
    646. METHOD
    647. US ACTIVATED CARBON MARKET ANALYSIS BY REGIONAL
    648. CANADA
    649. ACTIVATED CARBON MARKET ANALYSIS BY APPLICATION
    650. CANADA
    651. ACTIVATED CARBON MARKET ANALYSIS BY TYPE
    652. CANADA ACTIVATED
    653. CARBON MARKET ANALYSIS BY END USE
    654. CANADA ACTIVATED CARBON
    655. MARKET ANALYSIS BY PRODUCTION METHOD
    656. CANADA ACTIVATED
    657. CARBON MARKET ANALYSIS BY REGIONAL
    658. EUROPE ACTIVATED CARBON
    659. MARKET ANALYSIS
    660. GERMANY ACTIVATED CARBON MARKET ANALYSIS
    661. BY APPLICATION
    662. GERMANY ACTIVATED CARBON MARKET ANALYSIS
    663. BY TYPE
    664. GERMANY ACTIVATED CARBON MARKET ANALYSIS BY END
    665. USE
    666. GERMANY ACTIVATED CARBON MARKET ANALYSIS BY PRODUCTION
    667. METHOD
    668. GERMANY ACTIVATED CARBON MARKET ANALYSIS BY REGIONAL
    669. UK
    670. ACTIVATED CARBON MARKET ANALYSIS BY APPLICATION
    671. UK ACTIVATED
    672. CARBON MARKET ANALYSIS BY TYPE
    673. UK ACTIVATED CARBON MARKET
    674. ANALYSIS BY END USE
    675. UK ACTIVATED CARBON MARKET ANALYSIS
    676. BY PRODUCTION METHOD
    677. UK ACTIVATED CARBON MARKET ANALYSIS
    678. BY REGIONAL
    679. FRANCE ACTIVATED CARBON MARKET ANALYSIS BY
    680. APPLICATION
    681. FRANCE ACTIVATED CARBON MARKET ANALYSIS BY
    682. TYPE
    683. FRANCE ACTIVATED CARBON MARKET ANALYSIS BY END USE
    684. FRANCE
    685. ACTIVATED CARBON MARKET ANALYSIS BY PRODUCTION METHOD
    686. FRANCE
    687. ACTIVATED CARBON MARKET ANALYSIS BY REGIONAL
    688. RUSSIA ACTIVATED
    689. CARBON MARKET ANALYSIS BY APPLICATION
    690. RUSSIA ACTIVATED
    691. CARBON MARKET ANALYSIS BY TYPE
    692. RUSSIA ACTIVATED CARBON
    693. MARKET ANALYSIS BY END USE
    694. RUSSIA ACTIVATED CARBON MARKET
    695. ANALYSIS BY PRODUCTION METHOD
    696. RUSSIA ACTIVATED CARBON
    697. MARKET ANALYSIS BY REGIONAL
    698. ITALY ACTIVATED CARBON MARKET
    699. ANALYSIS BY APPLICATION
    700. ITALY ACTIVATED CARBON MARKET
    701. ANALYSIS BY TYPE
    702. ITALY ACTIVATED CARBON MARKET ANALYSIS
    703. BY END USE
    704. ITALY ACTIVATED CARBON MARKET ANALYSIS BY
    705. PRODUCTION METHOD
    706. ITALY ACTIVATED CARBON MARKET ANALYSIS
    707. BY REGIONAL
    708. SPAIN ACTIVATED CARBON MARKET ANALYSIS BY
    709. APPLICATION
    710. SPAIN ACTIVATED CARBON MARKET ANALYSIS BY
    711. TYPE
    712. SPAIN ACTIVATED CARBON MARKET ANALYSIS BY END USE
    713. SPAIN
    714. ACTIVATED CARBON MARKET ANALYSIS BY PRODUCTION METHOD
    715. SPAIN
    716. ACTIVATED CARBON MARKET ANALYSIS BY REGIONAL
    717. REST OF
    718. EUROPE ACTIVATED CARBON MARKET ANALYSIS BY APPLICATION
    719. REST
    720. OF EUROPE ACTIVATED CARBON MARKET ANALYSIS BY TYPE
    721. REST
    722. OF EUROPE ACTIVATED CARBON MARKET ANALYSIS BY END USE
    723. REST
    724. OF EUROPE ACTIVATED CARBON MARKET ANALYSIS BY PRODUCTION METHOD
    725. REST
    726. OF EUROPE ACTIVATED CARBON MARKET ANALYSIS BY REGIONAL
    727. APAC
    728. ACTIVATED CARBON MARKET ANALYSIS
    729. CHINA ACTIVATED CARBON
    730. MARKET ANALYSIS BY APPLICATION
    731. CHINA ACTIVATED CARBON
    732. MARKET ANALYSIS BY TYPE
    733. CHINA ACTIVATED CARBON MARKET
    734. ANALYSIS BY END USE
    735. CHINA ACTIVATED CARBON MARKET ANALYSIS
    736. BY PRODUCTION METHOD
    737. CHINA ACTIVATED CARBON MARKET ANALYSIS
    738. BY REGIONAL
    739. INDIA ACTIVATED CARBON MARKET ANALYSIS BY
    740. APPLICATION
    741. INDIA ACTIVATED CARBON MARKET ANALYSIS BY
    742. TYPE
    743. INDIA ACTIVATED CARBON MARKET ANALYSIS BY END USE
    744. INDIA
    745. ACTIVATED CARBON MARKET ANALYSIS BY PRODUCTION METHOD
    746. INDIA
    747. ACTIVATED CARBON MARKET ANALYSIS BY REGIONAL
    748. JAPAN ACTIVATED
    749. CARBON MARKET ANALYSIS BY APPLICATION
    750. JAPAN ACTIVATED
    751. CARBON MARKET ANALYSIS BY TYPE
    752. JAPAN ACTIVATED CARBON
    753. MARKET ANALYSIS BY END USE
    754. JAPAN ACTIVATED CARBON MARKET
    755. ANALYSIS BY PRODUCTION METHOD
    756. JAPAN ACTIVATED CARBON
    757. MARKET ANALYSIS BY REGIONAL
    758. SOUTH KOREA ACTIVATED CARBON
    759. MARKET ANALYSIS BY APPLICATION
    760. SOUTH KOREA ACTIVATED
    761. CARBON MARKET ANALYSIS BY TYPE
    762. SOUTH KOREA ACTIVATED
    763. CARBON MARKET ANALYSIS BY END USE
    764. SOUTH KOREA ACTIVATED
    765. CARBON MARKET ANALYSIS BY PRODUCTION METHOD
    766. SOUTH KOREA
    767. ACTIVATED CARBON MARKET ANALYSIS BY REGIONAL
    768. MALAYSIA
    769. ACTIVATED CARBON MARKET ANALYSIS BY APPLICATION
    770. MALAYSIA
    771. ACTIVATED CARBON MARKET ANALYSIS BY TYPE
    772. MALAYSIA ACTIVATED
    773. CARBON MARKET ANALYSIS BY END USE
    774. MALAYSIA ACTIVATED
    775. CARBON MARKET ANALYSIS BY PRODUCTION METHOD
    776. MALAYSIA
    777. ACTIVATED CARBON MARKET ANALYSIS BY REGIONAL
    778. THAILAND
    779. ACTIVATED CARBON MARKET ANALYSIS BY APPLICATION
    780. THAILAND
    781. ACTIVATED CARBON MARKET ANALYSIS BY TYPE
    782. THAILAND ACTIVATED
    783. CARBON MARKET ANALYSIS BY END USE
    784. THAILAND ACTIVATED
    785. CARBON MARKET ANALYSIS BY PRODUCTION METHOD
    786. THAILAND
    787. ACTIVATED CARBON MARKET ANALYSIS BY REGIONAL
    788. INDONESIA
    789. ACTIVATED CARBON MARKET ANALYSIS BY APPLICATION
    790. INDONESIA
    791. ACTIVATED CARBON MARKET ANALYSIS BY TYPE
    792. INDONESIA ACTIVATED
    793. CARBON MARKET ANALYSIS BY END USE
    794. INDONESIA ACTIVATED
    795. CARBON MARKET ANALYSIS BY PRODUCTION METHOD
    796. INDONESIA
    797. ACTIVATED CARBON MARKET ANALYSIS BY REGIONAL
    798. REST OF
    799. APAC ACTIVATED CARBON MARKET ANALYSIS BY APPLICATION
    800. REST
    801. OF APAC ACTIVATED CARBON MARKET ANALYSIS BY TYPE
    802. REST
    803. OF APAC ACTIVATED CARBON MARKET ANALYSIS BY END USE
    804. REST
    805. OF APAC ACTIVATED CARBON MARKET ANALYSIS BY PRODUCTION METHOD
    806. REST
    807. OF APAC ACTIVATED CARBON MARKET ANALYSIS BY REGIONAL
    808. SOUTH
    809. AMERICA ACTIVATED CARBON MARKET ANALYSIS
    810. BRAZIL ACTIVATED
    811. CARBON MARKET ANALYSIS BY APPLICATION
    812. BRAZIL ACTIVATED
    813. CARBON MARKET ANALYSIS BY TYPE
    814. BRAZIL ACTIVATED CARBON
    815. MARKET ANALYSIS BY END USE
    816. BRAZIL ACTIVATED CARBON MARKET
    817. ANALYSIS BY PRODUCTION METHOD
    818. BRAZIL ACTIVATED CARBON
    819. MARKET ANALYSIS BY REGIONAL
    820. MEXICO ACTIVATED CARBON MARKET
    821. ANALYSIS BY APPLICATION
    822. MEXICO ACTIVATED CARBON MARKET
    823. ANALYSIS BY TYPE
    824. MEXICO ACTIVATED CARBON MARKET ANALYSIS
    825. BY END USE
    826. MEXICO ACTIVATED CARBON MARKET ANALYSIS BY
    827. PRODUCTION METHOD
    828. MEXICO ACTIVATED CARBON MARKET ANALYSIS
    829. BY REGIONAL
    830. ARGENTINA ACTIVATED CARBON MARKET ANALYSIS
    831. BY APPLICATION
    832. ARGENTINA ACTIVATED CARBON MARKET ANALYSIS
    833. BY TYPE
    834. ARGENTINA ACTIVATED CARBON MARKET ANALYSIS BY
    835. END USE
    836. ARGENTINA ACTIVATED CARBON MARKET ANALYSIS BY
    837. PRODUCTION METHOD
    838. ARGENTINA ACTIVATED CARBON MARKET ANALYSIS
    839. BY REGIONAL
    840. REST OF SOUTH AMERICA ACTIVATED CARBON MARKET
    841. ANALYSIS BY APPLICATION
    842. REST OF SOUTH AMERICA ACTIVATED
    843. CARBON MARKET ANALYSIS BY TYPE
    844. REST OF SOUTH AMERICA
    845. ACTIVATED CARBON MARKET ANALYSIS BY END USE
    846. REST OF SOUTH
    847. AMERICA ACTIVATED CARBON MARKET ANALYSIS BY PRODUCTION METHOD
    848. REST
    849. OF SOUTH AMERICA ACTIVATED CARBON MARKET ANALYSIS BY REGIONAL
    850. MEA
    851. ACTIVATED CARBON MARKET ANALYSIS
    852. GCC COUNTRIES ACTIVATED
    853. CARBON MARKET ANALYSIS BY APPLICATION
    854. GCC COUNTRIES ACTIVATED
    855. CARBON MARKET ANALYSIS BY TYPE
    856. GCC COUNTRIES ACTIVATED
    857. CARBON MARKET ANALYSIS BY END USE
    858. GCC COUNTRIES ACTIVATED
    859. CARBON MARKET ANALYSIS BY PRODUCTION METHOD
    860. GCC COUNTRIES
    861. ACTIVATED CARBON MARKET ANALYSIS BY REGIONAL
    862. SOUTH AFRICA
    863. ACTIVATED CARBON MARKET ANALYSIS BY APPLICATION
    864. SOUTH
    865. AFRICA ACTIVATED CARBON MARKET ANALYSIS BY TYPE
    866. SOUTH
    867. AFRICA ACTIVATED CARBON MARKET ANALYSIS BY END USE
    868. SOUTH
    869. AFRICA ACTIVATED CARBON MARKET ANALYSIS BY PRODUCTION METHOD
    870. SOUTH
    871. AFRICA ACTIVATED CARBON MARKET ANALYSIS BY REGIONAL
    872. REST
    873. OF MEA ACTIVATED CARBON MARKET ANALYSIS BY APPLICATION
    874. REST
    875. OF MEA ACTIVATED CARBON MARKET ANALYSIS BY TYPE
    876. REST
    877. OF MEA ACTIVATED CARBON MARKET ANALYSIS BY END USE
    878. REST
    879. OF MEA ACTIVATED CARBON MARKET ANALYSIS BY PRODUCTION METHOD
    880. REST
    881. OF MEA ACTIVATED CARBON MARKET ANALYSIS BY REGIONAL
    882. KEY
    883. BUYING CRITERIA OF ACTIVATED CARBON MARKET
    884. RESEARCH PROCESS
    885. OF MRFR
    886. DRO ANALYSIS OF ACTIVATED CARBON MARKET
    887. DRIVERS
    888. IMPACT ANALYSIS: ACTIVATED CARBON MARKET
    889. RESTRAINTS IMPACT
    890. ANALYSIS: ACTIVATED CARBON MARKET
    891. SUPPLY / VALUE CHAIN:
    892. ACTIVATED CARBON MARKET
    893. ACTIVATED CARBON MARKET, BY APPLICATION,
    894. (% SHARE)
    895. ACTIVATED CARBON MARKET, BY APPLICATION,
    896. TO 2035 (USD Billions)
    897. ACTIVATED CARBON MARKET,
    898. BY TYPE, 2025 (% SHARE)
    899. ACTIVATED CARBON MARKET, BY TYPE,
    900. TO 2035 (USD Billions)
    901. ACTIVATED CARBON MARKET,
    902. BY END USE, 2025 (% SHARE)
    903. ACTIVATED CARBON MARKET, BY
    904. END USE, 2019 TO 2035 (USD Billions)
    905. ACTIVATED CARBON
    906. MARKET, BY PRODUCTION METHOD, 2025 (% SHARE)
    907. ACTIVATED
    908. CARBON MARKET, BY PRODUCTION METHOD, 2019 TO 2035 (USD Billions)
    909. ACTIVATED
    910. CARBON MARKET, BY REGIONAL, 2025 (% SHARE)
    911. ACTIVATED
    912. CARBON MARKET, BY REGIONAL, 2019 TO 2035 (USD Billions)
    913. BENCHMARKING
    914. OF MAJOR COMPETITORS

    Activated Carbon Market Segmentation


    • Activated Carbon Market By Application (USD Billion, 2019-2035)

      • Water Treatment
      • Air Purification
      • Food and Beverage Processing
      • Pharmaceuticals
      • Gold Recovery


    • Activated Carbon Market By Type (USD Billion, 2019-2035)

      • Granular Activated Carbon
      • Powdered Activated Carbon
      • Extruded Activated Carbon


    • Activated Carbon Market By End Use (USD Billion, 2019-2035)

      • Industrial
      • Residential
      • Commercial


    • Activated Carbon Market By Production Method (USD Billion, 2019-2035)

      • Physical Activation
      • Chemical Activation


    • Activated Carbon Market By Regional (USD Billion, 2019-2035)

      • North America
      • Europe
      • South America
      • Asia Pacific
      • Middle East and Africa


    Activated Carbon Market Regional Outlook (USD Billion, 2019-2035)


    • North America Outlook (USD Billion, 2019-2035)

      • North America Activated Carbon Market by Application Type

        • Water Treatment
        • Air Purification
        • Food and Beverage Processing
        • Pharmaceuticals
        • Gold Recovery
      • North America Activated Carbon Market by Type

        • Granular Activated Carbon
        • Powdered Activated Carbon
        • Extruded Activated Carbon
      • North America Activated Carbon Market by End Use Type

        • Industrial
        • Residential
        • Commercial
      • North America Activated Carbon Market by Production Method Type

        • Physical Activation
        • Chemical Activation
      • North America Activated Carbon Market by Regional Type

        • US
        • Canada
      • US Outlook (USD Billion, 2019-2035)
      • US Activated Carbon Market by Application Type

        • Water Treatment
        • Air Purification
        • Food and Beverage Processing
        • Pharmaceuticals
        • Gold Recovery
      • US Activated Carbon Market by Type

        • Granular Activated Carbon
        • Powdered Activated Carbon
        • Extruded Activated Carbon
      • US Activated Carbon Market by End Use Type

        • Industrial
        • Residential
        • Commercial
      • US Activated Carbon Market by Production Method Type

        • Physical Activation
        • Chemical Activation
      • CANADA Outlook (USD Billion, 2019-2035)
      • CANADA Activated Carbon Market by Application Type

        • Water Treatment
        • Air Purification
        • Food and Beverage Processing
        • Pharmaceuticals
        • Gold Recovery
      • CANADA Activated Carbon Market by Type

        • Granular Activated Carbon
        • Powdered Activated Carbon
        • Extruded Activated Carbon
      • CANADA Activated Carbon Market by End Use Type

        • Industrial
        • Residential
        • Commercial
      • CANADA Activated Carbon Market by Production Method Type

        • Physical Activation
        • Chemical Activation
    • Europe Outlook (USD Billion, 2019-2035)

      • Europe Activated Carbon Market by Application Type

        • Water Treatment
        • Air Purification
        • Food and Beverage Processing
        • Pharmaceuticals
        • Gold Recovery
      • Europe Activated Carbon Market by Type

        • Granular Activated Carbon
        • Powdered Activated Carbon
        • Extruded Activated Carbon
      • Europe Activated Carbon Market by End Use Type

        • Industrial
        • Residential
        • Commercial
      • Europe Activated Carbon Market by Production Method Type

        • Physical Activation
        • Chemical Activation
      • Europe Activated Carbon Market by Regional Type

        • Germany
        • UK
        • France
        • Russia
        • Italy
        • Spain
        • Rest of Europe
      • GERMANY Outlook (USD Billion, 2019-2035)
      • GERMANY Activated Carbon Market by Application Type

        • Water Treatment
        • Air Purification
        • Food and Beverage Processing
        • Pharmaceuticals
        • Gold Recovery
      • GERMANY Activated Carbon Market by Type

        • Granular Activated Carbon
        • Powdered Activated Carbon
        • Extruded Activated Carbon
      • GERMANY Activated Carbon Market by End Use Type

        • Industrial
        • Residential
        • Commercial
      • GERMANY Activated Carbon Market by Production Method Type

        • Physical Activation
        • Chemical Activation
      • UK Outlook (USD Billion, 2019-2035)
      • UK Activated Carbon Market by Application Type

        • Water Treatment
        • Air Purification
        • Food and Beverage Processing
        • Pharmaceuticals
        • Gold Recovery
      • UK Activated Carbon Market by Type

        • Granular Activated Carbon
        • Powdered Activated Carbon
        • Extruded Activated Carbon
      • UK Activated Carbon Market by End Use Type

        • Industrial
        • Residential
        • Commercial
      • UK Activated Carbon Market by Production Method Type

        • Physical Activation
        • Chemical Activation
      • FRANCE Outlook (USD Billion, 2019-2035)
      • FRANCE Activated Carbon Market by Application Type

        • Water Treatment
        • Air Purification
        • Food and Beverage Processing
        • Pharmaceuticals
        • Gold Recovery
      • FRANCE Activated Carbon Market by Type

        • Granular Activated Carbon
        • Powdered Activated Carbon
        • Extruded Activated Carbon
      • FRANCE Activated Carbon Market by End Use Type

        • Industrial
        • Residential
        • Commercial
      • FRANCE Activated Carbon Market by Production Method Type

        • Physical Activation
        • Chemical Activation
      • RUSSIA Outlook (USD Billion, 2019-2035)
      • RUSSIA Activated Carbon Market by Application Type

        • Water Treatment
        • Air Purification
        • Food and Beverage Processing
        • Pharmaceuticals
        • Gold Recovery
      • RUSSIA Activated Carbon Market by Type

        • Granular Activated Carbon
        • Powdered Activated Carbon
        • Extruded Activated Carbon
      • RUSSIA Activated Carbon Market by End Use Type

        • Industrial
        • Residential
        • Commercial
      • RUSSIA Activated Carbon Market by Production Method Type

        • Physical Activation
        • Chemical Activation
      • ITALY Outlook (USD Billion, 2019-2035)
      • ITALY Activated Carbon Market by Application Type

        • Water Treatment
        • Air Purification
        • Food and Beverage Processing
        • Pharmaceuticals
        • Gold Recovery
      • ITALY Activated Carbon Market by Type

        • Granular Activated Carbon
        • Powdered Activated Carbon
        • Extruded Activated Carbon
      • ITALY Activated Carbon Market by End Use Type

        • Industrial
        • Residential
        • Commercial
      • ITALY Activated Carbon Market by Production Method Type

        • Physical Activation
        • Chemical Activation
      • SPAIN Outlook (USD Billion, 2019-2035)
      • SPAIN Activated Carbon Market by Application Type

        • Water Treatment
        • Air Purification
        • Food and Beverage Processing
        • Pharmaceuticals
        • Gold Recovery
      • SPAIN Activated Carbon Market by Type

        • Granular Activated Carbon
        • Powdered Activated Carbon
        • Extruded Activated Carbon
      • SPAIN Activated Carbon Market by End Use Type

        • Industrial
        • Residential
        • Commercial
      • SPAIN Activated Carbon Market by Production Method Type

        • Physical Activation
        • Chemical Activation
      • REST OF EUROPE Outlook (USD Billion, 2019-2035)
      • REST OF EUROPE Activated Carbon Market by Application Type

        • Water Treatment
        • Air Purification
        • Food and Beverage Processing
        • Pharmaceuticals
        • Gold Recovery
      • REST OF EUROPE Activated Carbon Market by Type

        • Granular Activated Carbon
        • Powdered Activated Carbon
        • Extruded Activated Carbon
      • REST OF EUROPE Activated Carbon Market by End Use Type

        • Industrial
        • Residential
        • Commercial
      • REST OF EUROPE Activated Carbon Market by Production Method Type

        • Physical Activation
        • Chemical Activation
    • APAC Outlook (USD Billion, 2019-2035)

      • APAC Activated Carbon Market by Application Type

        • Water Treatment
        • Air Purification
        • Food and Beverage Processing
        • Pharmaceuticals
        • Gold Recovery
      • APAC Activated Carbon Market by Type

        • Granular Activated Carbon
        • Powdered Activated Carbon
        • Extruded Activated Carbon
      • APAC Activated Carbon Market by End Use Type

        • Industrial
        • Residential
        • Commercial
      • APAC Activated Carbon Market by Production Method Type

        • Physical Activation
        • Chemical Activation
      • APAC Activated Carbon Market by Regional Type

        • China
        • India
        • Japan
        • South Korea
        • Malaysia
        • Thailand
        • Indonesia
        • Rest of APAC
      • CHINA Outlook (USD Billion, 2019-2035)
      • CHINA Activated Carbon Market by Application Type

        • Water Treatment
        • Air Purification
        • Food and Beverage Processing
        • Pharmaceuticals
        • Gold Recovery
      • CHINA Activated Carbon Market by Type

        • Granular Activated Carbon
        • Powdered Activated Carbon
        • Extruded Activated Carbon
      • CHINA Activated Carbon Market by End Use Type

        • Industrial
        • Residential
        • Commercial
      • CHINA Activated Carbon Market by Production Method Type

        • Physical Activation
        • Chemical Activation
      • INDIA Outlook (USD Billion, 2019-2035)
      • INDIA Activated Carbon Market by Application Type

        • Water Treatment
        • Air Purification
        • Food and Beverage Processing
        • Pharmaceuticals
        • Gold Recovery
      • INDIA Activated Carbon Market by Type

        • Granular Activated Carbon
        • Powdered Activated Carbon
        • Extruded Activated Carbon
      • INDIA Activated Carbon Market by End Use Type

        • Industrial
        • Residential
        • Commercial
      • INDIA Activated Carbon Market by Production Method Type

        • Physical Activation
        • Chemical Activation
      • JAPAN Outlook (USD Billion, 2019-2035)
      • JAPAN Activated Carbon Market by Application Type

        • Water Treatment
        • Air Purification
        • Food and Beverage Processing
        • Pharmaceuticals
        • Gold Recovery
      • JAPAN Activated Carbon Market by Type

        • Granular Activated Carbon
        • Powdered Activated Carbon
        • Extruded Activated Carbon
      • JAPAN Activated Carbon Market by End Use Type

        • Industrial
        • Residential
        • Commercial
      • JAPAN Activated Carbon Market by Production Method Type

        • Physical Activation
        • Chemical Activation
      • SOUTH KOREA Outlook (USD Billion, 2019-2035)
      • SOUTH KOREA Activated Carbon Market by Application Type

        • Water Treatment
        • Air Purification
        • Food and Beverage Processing
        • Pharmaceuticals
        • Gold Recovery
      • SOUTH KOREA Activated Carbon Market by Type

        • Granular Activated Carbon
        • Powdered Activated Carbon
        • Extruded Activated Carbon
      • SOUTH KOREA Activated Carbon Market by End Use Type

        • Industrial
        • Residential
        • Commercial
      • SOUTH KOREA Activated Carbon Market by Production Method Type

        • Physical Activation
        • Chemical Activation
      • MALAYSIA Outlook (USD Billion, 2019-2035)
      • MALAYSIA Activated Carbon Market by Application Type

        • Water Treatment
        • Air Purification
        • Food and Beverage Processing
        • Pharmaceuticals
        • Gold Recovery
      • MALAYSIA Activated Carbon Market by Type

        • Granular Activated Carbon
        • Powdered Activated Carbon
        • Extruded Activated Carbon
      • MALAYSIA Activated Carbon Market by End Use Type

        • Industrial
        • Residential
        • Commercial
      • MALAYSIA Activated Carbon Market by Production Method Type

        • Physical Activation
        • Chemical Activation
      • THAILAND Outlook (USD Billion, 2019-2035)
      • THAILAND Activated Carbon Market by Application Type

        • Water Treatment
        • Air Purification
        • Food and Beverage Processing
        • Pharmaceuticals
        • Gold Recovery
      • THAILAND Activated Carbon Market by Type

        • Granular Activated Carbon
        • Powdered Activated Carbon
        • Extruded Activated Carbon
      • THAILAND Activated Carbon Market by End Use Type

        • Industrial
        • Residential
        • Commercial
      • THAILAND Activated Carbon Market by Production Method Type

        • Physical Activation
        • Chemical Activation
      • INDONESIA Outlook (USD Billion, 2019-2035)
      • INDONESIA Activated Carbon Market by Application Type

        • Water Treatment
        • Air Purification
        • Food and Beverage Processing
        • Pharmaceuticals
        • Gold Recovery
      • INDONESIA Activated Carbon Market by Type

        • Granular Activated Carbon
        • Powdered Activated Carbon
        • Extruded Activated Carbon
      • INDONESIA Activated Carbon Market by End Use Type

        • Industrial
        • Residential
        • Commercial
      • INDONESIA Activated Carbon Market by Production Method Type

        • Physical Activation
        • Chemical Activation
      • REST OF APAC Outlook (USD Billion, 2019-2035)
      • REST OF APAC Activated Carbon Market by Application Type

        • Water Treatment
        • Air Purification
        • Food and Beverage Processing
        • Pharmaceuticals
        • Gold Recovery
      • REST OF APAC Activated Carbon Market by Type

        • Granular Activated Carbon
        • Powdered Activated Carbon
        • Extruded Activated Carbon
      • REST OF APAC Activated Carbon Market by End Use Type

        • Industrial
        • Residential
        • Commercial
      • REST OF APAC Activated Carbon Market by Production Method Type

        • Physical Activation
        • Chemical Activation
    • South America Outlook (USD Billion, 2019-2035)

      • South America Activated Carbon Market by Application Type

        • Water Treatment
        • Air Purification
        • Food and Beverage Processing
        • Pharmaceuticals
        • Gold Recovery
      • South America Activated Carbon Market by Type

        • Granular Activated Carbon
        • Powdered Activated Carbon
        • Extruded Activated Carbon
      • South America Activated Carbon Market by End Use Type

        • Industrial
        • Residential
        • Commercial
      • South America Activated Carbon Market by Production Method Type

        • Physical Activation
        • Chemical Activation
      • South America Activated Carbon Market by Regional Type

        • Brazil
        • Mexico
        • Argentina
        • Rest of South America
      • BRAZIL Outlook (USD Billion, 2019-2035)
      • BRAZIL Activated Carbon Market by Application Type

        • Water Treatment
        • Air Purification
        • Food and Beverage Processing
        • Pharmaceuticals
        • Gold Recovery
      • BRAZIL Activated Carbon Market by Type

        • Granular Activated Carbon
        • Powdered Activated Carbon
        • Extruded Activated Carbon
      • BRAZIL Activated Carbon Market by End Use Type

        • Industrial
        • Residential
        • Commercial
      • BRAZIL Activated Carbon Market by Production Method Type

        • Physical Activation
        • Chemical Activation
      • MEXICO Outlook (USD Billion, 2019-2035)
      • MEXICO Activated Carbon Market by Application Type

        • Water Treatment
        • Air Purification
        • Food and Beverage Processing
        • Pharmaceuticals
        • Gold Recovery
      • MEXICO Activated Carbon Market by Type

        • Granular Activated Carbon
        • Powdered Activated Carbon
        • Extruded Activated Carbon
      • MEXICO Activated Carbon Market by End Use Type

        • Industrial
        • Residential
        • Commercial
      • MEXICO Activated Carbon Market by Production Method Type

        • Physical Activation
        • Chemical Activation
      • ARGENTINA Outlook (USD Billion, 2019-2035)
      • ARGENTINA Activated Carbon Market by Application Type

        • Water Treatment
        • Air Purification
        • Food and Beverage Processing
        • Pharmaceuticals
        • Gold Recovery
      • ARGENTINA Activated Carbon Market by Type

        • Granular Activated Carbon
        • Powdered Activated Carbon
        • Extruded Activated Carbon
      • ARGENTINA Activated Carbon Market by End Use Type

        • Industrial
        • Residential
        • Commercial
      • ARGENTINA Activated Carbon Market by Production Method Type

        • Physical Activation
        • Chemical Activation
      • REST OF SOUTH AMERICA Outlook (USD Billion, 2019-2035)
      • REST OF SOUTH AMERICA Activated Carbon Market by Application Type

        • Water Treatment
        • Air Purification
        • Food and Beverage Processing
        • Pharmaceuticals
        • Gold Recovery
      • REST OF SOUTH AMERICA Activated Carbon Market by Type

        • Granular Activated Carbon
        • Powdered Activated Carbon
        • Extruded Activated Carbon
      • REST OF SOUTH AMERICA Activated Carbon Market by End Use Type

        • Industrial
        • Residential
        • Commercial
      • REST OF SOUTH AMERICA Activated Carbon Market by Production Method Type

        • Physical Activation
        • Chemical Activation
    • MEA Outlook (USD Billion, 2019-2035)

      • MEA Activated Carbon Market by Application Type

        • Water Treatment
        • Air Purification
        • Food and Beverage Processing
        • Pharmaceuticals
        • Gold Recovery
      • MEA Activated Carbon Market by Type

        • Granular Activated Carbon
        • Powdered Activated Carbon
        • Extruded Activated Carbon
      • MEA Activated Carbon Market by End Use Type

        • Industrial
        • Residential
        • Commercial
      • MEA Activated Carbon Market by Production Method Type

        • Physical Activation
        • Chemical Activation
      • MEA Activated Carbon Market by Regional Type

        • GCC Countries
        • South Africa
        • Rest of MEA
      • GCC COUNTRIES Outlook (USD Billion, 2019-2035)
      • GCC COUNTRIES Activated Carbon Market by Application Type

        • Water Treatment
        • Air Purification
        • Food and Beverage Processing
        • Pharmaceuticals
        • Gold Recovery
      • GCC COUNTRIES Activated Carbon Market by Type

        • Granular Activated Carbon
        • Powdered Activated Carbon
        • Extruded Activated Carbon
      • GCC COUNTRIES Activated Carbon Market by End Use Type

        • Industrial
        • Residential
        • Commercial
      • GCC COUNTRIES Activated Carbon Market by Production Method Type

        • Physical Activation
        • Chemical Activation
      • SOUTH AFRICA Outlook (USD Billion, 2019-2035)
      • SOUTH AFRICA Activated Carbon Market by Application Type

        • Water Treatment
        • Air Purification
        • Food and Beverage Processing
        • Pharmaceuticals
        • Gold Recovery
      • SOUTH AFRICA Activated Carbon Market by Type

        • Granular Activated Carbon
        • Powdered Activated Carbon
        • Extruded Activated Carbon
      • SOUTH AFRICA Activated Carbon Market by End Use Type

        • Industrial
        • Residential
        • Commercial
      • SOUTH AFRICA Activated Carbon Market by Production Method Type

        • Physical Activation
        • Chemical Activation
      • REST OF MEA Outlook (USD Billion, 2019-2035)
      • REST OF MEA Activated Carbon Market by Application Type

        • Water Treatment
        • Air Purification
        • Food and Beverage Processing
        • Pharmaceuticals
        • Gold Recovery
      • REST OF MEA Activated Carbon Market by Type

        • Granular Activated Carbon
        • Powdered Activated Carbon
        • Extruded Activated Carbon
      • REST OF MEA Activated Carbon Market by End Use Type

        • Industrial
        • Residential
        • Commercial
      • REST OF MEA Activated Carbon Market by Production Method Type

        • Physical Activation
        • Chemical Activation


    Activated Carbon Market Research Report - Global Forecast till 2035 Infographic
    Free Sample Request

    Kindly complete the form below to receive a free sample of this Report

    Customer Strories

    “I am very pleased with how market segments have been defined in a relevant way for my purposes (such as "Portable Freezers & refrigerators" and "last-mile"). In general the report is well structured. Thanks very much for your efforts.”

    Victoria Milne Founder
    Case Study

    Chemicals and Materials