• Cat-intel
  • MedIntelliX
  • Resources
  • About Us
  • Hero Background
    English
    Chinese
    French
    Japanese
    Korean
    German
    Spanish

    Glass Additives Market Share

    ID: MRFR/CnM/3704-HCR
    139 Pages
    Chitranshi Jaiswal
    October 2025

    Global Glass Additives Market Research Report by Product (Metal Oxide, Nanoparticles and Polymers & Rare Earth Metals), Application (Building & Construction, Packaging, Automotive & Transportation, Electronics & Appliances) Region- Forecast till 2035

    Share:
    Download PDF ×

    We do not share your information with anyone. However, we may send you emails based on your report interest from time to time. You may contact us at any time to opt-out.

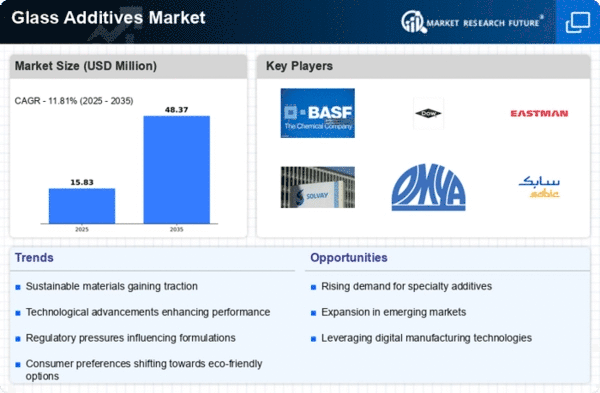
    Glass Additives Market Infographic
    $ 4,950.0
    $ 5,950.0
    $ 7,250.0

    Market Share

    Glass Additives Market Share Analysis

    In the dynamic realm of the glass additives market, companies implement diverse strategies to establish their footing and expand their market share. One of the key strategies employed is differentiation, where companies emphasize unique features or properties of their glass additives to distinguish themselves from competitors. For instance, some companies may highlight additives that improve the strength, clarity, or thermal resistance of glass products. By showcasing these distinctive attributes, they attract customers seeking specific benefits or functionalities, thus carving out a niche within the market.

    Cost leadership is another significant strategy, with companies striving to offer competitive pricing while maintaining profitability. Through efficient manufacturing processes, strategic sourcing of raw materials, and economies of scale, these companies can provide glass additives at lower costs compared to their competitors. This approach appeals to price-conscious consumers and businesses looking to optimize their expenses without compromising on quality. By positioning themselves as cost leaders, companies can capture market share among budget-conscious buyers and strengthen their presence in the market.

    Furthermore, companies may adopt a niche market strategy, targeting specialized segments or applications within the glass additives market. Instead of competing across the entire market spectrum, they focus their efforts on serving specific customer needs or addressing unique industry requirements. For example, a company might specialize in additives designed for architectural glass applications, such as coatings that enhance energy efficiency or reduce glare. By catering to niche markets, companies can develop expertise, build strong customer relationships, and establish themselves as leaders within their chosen segments.

    Branding and marketing play a pivotal role in market share positioning strategies within the glass additives market. Building a strong brand identity helps companies differentiate themselves, cultivate customer loyalty, and command premium pricing. Through targeted marketing campaigns, companies can raise awareness about their products, communicate key benefits, and influence consumer perceptions. Whether through digital platforms, industry events, or collaborations with glass manufacturers, effective marketing efforts enhance visibility and drive demand for glass additives, ultimately contributing to market share expansion.

    Strategic partnerships and collaborations also feature prominently in market share positioning strategies. By forming alliances with glass manufacturers, research institutions, or industry associations, companies can leverage complementary strengths and resources to gain a competitive edge. Collaborative ventures enable companies to access new markets, enhance product development capabilities, and stay abreast of emerging trends. Through strategic partnerships, companies can broaden their market reach, capitalize on growth opportunities, and solidify their position in the glass additives market.

    Innovation serves as a cornerstone of market share positioning strategies in the glass additives market. Companies invest in research and development to introduce new additives, improve existing formulations, and address evolving customer needs. Whether it's developing additives that enhance glass strength, durability, or sustainability, innovation drives differentiation and stimulates market growth. Companies that prioritize innovation can capture market share by offering cutting-edge solutions that meet the evolving demands of glass manufacturers and end-users.

    Customer experience and service quality are also critical components of market share positioning strategies. Providing excellent technical support, product customization options, and timely delivery fosters trust and loyalty among customers. Companies that prioritize customer satisfaction can differentiate themselves from competitors and build long-lasting relationships with clients. Positive experiences lead to repeat business, referrals, and positive word-of-mouth, ultimately contributing to market share expansion and sustained growth.

    Market Summary

    The Global Glass Additives Market is projected to grow from 12.5 USD Billion in 2024 to 20.3 USD Billion by 2035, reflecting a robust growth trajectory.

    Key Market Trends & Highlights

    Global Glass Additives Key Trends and Highlights

    • The market is expected to expand at a compound annual growth rate of 4.51 percent from 2025 to 2035.
    • By 2035, the market valuation is anticipated to reach 20.3 USD Billion, indicating strong demand for glass additives.
    • In 2024, the market is valued at 12.5 USD Billion, showcasing a solid foundation for future growth.
    • Growing adoption of innovative glass formulations due to increasing demand for energy-efficient solutions is a major market driver.

    Market Size & Forecast

    2024 Market Size 12.5 (USD Billion)
    2035 Market Size 20.3 (USD Billion)
    CAGR (2025 - 2035) 4.51%
    Largest Regional Market Share in 2024 -)

    Major Players

    Apple Inc (US), Microsoft Corp (US), Amazon.com Inc (US), Alphabet Inc (US), Berkshire Hathaway Inc (US), Tesla Inc (US), Meta Platforms Inc (US), Johnson & Johnson (US), Visa Inc (US), Procter & Gamble Co (US)

    Market Trends

    The increasing demand for energy-efficient and sustainable building materials is driving innovation in the glass additives sector, as manufacturers seek to enhance performance and reduce environmental impact.

    U.S. Department of Energy

    Glass Additives Market Market Drivers

    Market Trends and Growth Projections

    The Global Glass Additives Market Industry is poised for substantial growth, with projections indicating a market value of 12.5 USD Billion in 2024 and an anticipated increase to 20.3 USD Billion by 2035. The industry is expected to experience a CAGR of 4.51% from 2025 to 2035, reflecting the ongoing demand for innovative glass solutions across various sectors. This growth is driven by factors such as technological advancements, increasing applications in electronics, and the rising need for sustainable materials. As the market evolves, stakeholders are likely to focus on developing new additives that enhance product performance and meet changing consumer preferences.

    Increasing Applications in Electronics

    The integration of glass in electronic devices is a burgeoning trend that is positively impacting the Global Glass Additives Market Industry. Glass is increasingly utilized in screens and displays due to its superior optical properties and durability. Additives that enhance the conductivity and thermal stability of glass are becoming essential in the electronics sector. As consumer electronics continue to advance, the demand for specialized glass products is likely to grow. This trend could further bolster the market, as manufacturers seek to innovate and meet the evolving needs of the electronics industry.

    Rising Demand for Sustainable Materials

    The Global Glass Additives Market Industry is experiencing a notable shift towards sustainability, driven by increasing consumer awareness and regulatory pressures. Manufacturers are increasingly incorporating eco-friendly additives to meet the growing demand for green products. For instance, the use of recycled glass in production not only reduces waste but also enhances the properties of glass products. This trend is expected to contribute to the market's growth, with projections indicating a market value of 12.5 USD Billion in 2024. As sustainability becomes a priority, the adoption of innovative glass additives is likely to accelerate, further propelling the industry forward.

    Regulatory Compliance and Quality Standards

    The Global Glass Additives Market Industry is influenced by stringent regulatory frameworks and quality standards that govern glass production. Compliance with these regulations often necessitates the use of specific additives that enhance product safety and performance. For instance, additives that reduce the leaching of harmful substances are increasingly mandated in various regions. As manufacturers adapt to these regulations, the demand for compliant glass additives is expected to rise. This focus on quality and safety could contribute to the market's growth trajectory, ensuring that products meet both consumer expectations and regulatory requirements.

    Growth in Construction and Automotive Sectors

    The Global Glass Additives Market Industry is closely tied to the expansion of the construction and automotive sectors. With urbanization and infrastructure development on the rise, the demand for high-quality glass products is increasing. For example, architectural glass used in commercial buildings requires specific additives to enhance strength and energy efficiency. Similarly, the automotive industry demands glass that meets safety and aesthetic standards. This synergy is expected to drive the market, with a projected CAGR of 4.51% from 2025 to 2035, as both sectors continue to evolve and expand.

    Technological Advancements in Glass Production

    Technological innovations in glass manufacturing processes are significantly influencing the Global Glass Additives Market Industry. Advanced techniques such as 3D printing and automated production lines enhance efficiency and reduce costs. These advancements allow for the development of specialized glass additives that improve product performance, such as thermal resistance and durability. As a result, manufacturers are better equipped to meet diverse consumer needs. The market is projected to reach 20.3 USD Billion by 2035, reflecting the impact of these technological improvements on production capabilities and overall market growth.

    Market Segment Insights

    Regional Insights

    Key Companies in the Glass Additives Market market include

    Industry Developments

    Future Outlook

    Glass Additives Market Future Outlook

    The Global Glass Additives Market is projected to grow at a 4.51% CAGR from 2024 to 2035, driven by increasing demand for advanced glass products and sustainable manufacturing practices.

    New opportunities lie in:

    • Develop eco-friendly glass additives to meet sustainability regulations.
    • Invest in R&D for high-performance additives enhancing glass durability.
    • Expand into emerging markets with tailored product offerings for local industries.

    By 2035, the market is expected to demonstrate robust growth, reflecting evolving consumer preferences and technological advancements.

    Market Segmentation

    Report Scope

    Attribute/Metric Details
      Market Size   2032: USD 9,904.8 million
      CAGR   6.9% CAGR
      Base Year   2023
      Forecast Period   2024 to 2032
      Historical Data   2019 & 2020
      Forecast Units   Value (USD Million)
      Report Coverage   Revenue Forecast, Competitive Landscape, Growth Factors, and Trends
      Segments Covered   Product Type, Applications, Region
      Geographies Covered   North America, Europe, Asia-Pacific, and Rest of the World (RoW)
      Key Vendors   Namibia Rare Earths Inc. (Canada), Lynas Corporation Ltd (Australia), Torrecid Group (Spain), Potters Industries LLC (U.S.), SCHOTT AG (Germany), DuPont. (U.S.), GILLINDER GLASS (U.S.), METALL RARE EARTH LIMITED (China), Ardagh Group (Republic of Ireland), HAMMOND GROUP INC (U.S.)
      Key Market Opportunities Higher adoption rate of plastics as cheaper alternative to glass Relatively low costs of plastic additives
      Key Market Drivers Technological advancement such as using lanthanum oxide as an additive to improve the durability Refractive index of glass materials

    Market Highlights

    Author

    Chitranshi Jaiswal
    Research Analyst Level I

    She holds an experience of about 6+ years in market research and business consulting, working under the spectrum of information communication technology, telecommunications and semiconductor domains. aarti conceptualizes and implements a scalable business strategy and provides strategic leadership to the clients. her expertise lies in market estimation, competitive intelligence, pipeline analysis, customer assessment, etc.

    Leave a Comment

    Latest Comments

    John Doe
    john@example.com

    This is a great article! Really helped me understand the topic better.

    Posted on July 23, 2025, 10:15 AM
    Jane Smith
    jane@domain.com

    Thanks for sharing this. I’ve bookmarked it for later reference.

    Posted on July 22, 2025, 7:45 PM

    FAQs

    What are glass additives?

    Glass additives are substances added to glass products to enhance certain properties of the finished products.

    What is the major driver for the glass additives market?

    The growing demand from the packaging industry and the construction industry is the major driver for the global glass additives market.

    What is the major restraint on the glass additives market?

    The low costs of plastic additives are the key restraint on the global glass additives market.

    Which is the major regional market for glass additives?

    Europe is the largest regional market for glass additives, with Asia Pacific expected to exhibit the highest growth rate over the forecast period.

    Which are the leading players in the glass additives market?

    Leading players in the glass additives market include Potters Industries LLC, Lynas Corporation Ltd., DuPont, Schott AG, Torrecid Group, Ardagh Group, and Hammond Group Inc.

    1. Table of Contents:
    2. Executive Summary
    3. Scope of the Report
      1. Market Definition
      2. Scope of the Study
        1. Research Objectives
        2. Assumptions & Limitations
      3. Markets Structure
    4. Market Research Methodology
      1. Research Process
      2. Secondary Research
      3. Primary Research
      4. Forecast Model
    5. Market Landscape
      1. Porter’s Five Forces Analysis
        1. Threat of New Entrants
        2. Bargaining Power of Buyers
        3. Threat of Substitutes
        4. Segment Rivalry
      2. Value Chain/Supply Chain of Global Glass Additives Market
    6. Industry Overview of Global Glass Additives Market
      1. Introduction
      2. Growth Drivers
      3. Impact Analysis
      4. Market Challenges
    7. Market Trends
      1. Introduction
      2. Growth Trends
      3. Impact Analysis
    8. Global Glass Additives Market by Product
      1. Introduction
      2. Metal Oxide
        1. Market Estimates & Forecast, 2019-2027
        2. Market Estimates & Forecast by Region, 2019-2027
      3. Nanoparticles
        1. Market Estimates & Forecast, 2019-2027
        2. Market Estimates & Forecast by Region, 2019-2027
      4. Polymers & Rare Earth Metals
        1. Market Estimates & Forecast, 2019-2027
        2. Market Estimates & Forecast by Region, 2019-2027
    9. Global Glass Additives Market by Application
      1. Introduction
      2. Building & Construction
        1. Market Estimates & Forecast, 2019-2027
        2. Market Estimates & Forecast by Region, 2019-2027
      3. Packaging
        1. Market Estimates & Forecast, 2019-2027
        2. Market Estimates & Forecast by Region, 2019-2027
      4. Automotive & Transportation
        1. Market Estimates & Forecast, 2019-2027
        2. Market Estimates & Forecast by Region, 2019-2027
      5. Electronics & Appliances
        1. Market Estimates & Forecast, 2019-2027
        2. Market Estimates & Forecast by Region, 2019-2027
      6. Others
        1. Market Estimates & Forecast, 2019-2027
        2. Market Estimates & Forecast by Region, 2019-2027
    10. Global Glass Additives Market by Region
      1. Introduction
      2. North America
        1. Market Estimates & Forecast, 2019-2027
        2. Market Estimates & Forecast by Product, 2019-2027
        3. Market Estimates & Forecast by Application, 2019-2027
        4. U.S.
        5. Mexico
        6. Canada
      3. Europe
        1. Market Estimates & Forecast, 2019-2027
        2. Market Estimates & Forecast by Product, 2019-2027
        3. Market Estimates & Forecast by Application, 2019-2027
        4. Germany
        5. France
        6. Italy
        7. Spain
        8. UK
      4. Asia Pacific
        1. Market Estimates & Forecast, 2019-2027
        2. Market Estimates & Forecast by Product, 2019-2027
        3. Market Estimates & Forecast by Application, 2019-2027
        4. China
        5. India
        6. Japan
        7. Australia
        8. New Zealand
        9. Rest of Asia Pacific
      5. The Middle East & Africa
        1. Market Estimates & Forecast, 2019-2027
        2. Market Estimates & Forecast by Product, 2019-2027
        3. Market Estimates & Forecast by Application, 2019-2027
        4. Turkey
        5. Israel
        6. North Africa
        7. GCC
        8. Rest of The Middle East & Africa
      6. Latin America
        1. Market Estimates & Forecast, 2019-2027
        2. Market Estimates & Forecast by Product, 2019-2027
        3. Market Estimates & Forecast by Application, 2019-2027
        4. Brazil
        5. Argentina
        6. Rest of Latin America
    11. Company Landscape
    12. Company Profiles
      1. Namibia Rare Earths Inc.
        1. Company Overview
        2. Product/Business Segment Overview
        3. Financial Updates
        4. Key Developments
      2. Lynas Corporation Ltd
        1. Company Overview
        2. Product/Business Segment Overview
        3. Financial Updates
        4. Key Developments
      3. Torrecid Group
        1. Company Overview
        2. Product/Business Segment Overview
        3. Financial Updates
        4. Key Developments
      4. Potters Industries LLC
        1. Company Overview
        2. Product/Business Segment Overview
        3. Financial Updates
        4. Key Developments
      5. SCHOTT AG
        1. Company Overview
        2. Product/Business Segment Overview
        3. Financial Updates
        4. Key Developments
      6. DuPont.
        1. Company Overview
        2. Product/Business Segment Overview
        3. Financial Updates
        4. Key Developments
      7. GILLINDER GLASS
        1. Company Overview
        2. Product/Business Segment Overview
        3. Financial Updates
        4. Key Developments
      8. METALL RARE EARTH LIMITED
        1. Company Overview
        2. Product/Business Segment Overview
        3. Financial Updates
        4. Key Developments
      9. Ardagh Group
        1. Company Overview
        2. Product/Business Segment Overview
        3. Financial Updates
        4. Key Developments
      10. HAMMOND GROUP INC
        1. Company Overview
        2. Product/Business Segment Overview
        3. Financial Updates
        4. Key Developments
    13. Conclusion
    14. List of Tables and Figures
      1. List of Tables:
      2. Table 1 World Population by Major Regions (2019 To 2027)
      3. Table 2 Global Glass Additives Market: By Region, 2019-2027
      4. Table 3 North America Glass Additives Market: By Country, 2019-2027
      5. Table 4 Europe Glass Additives Market: By Country, 2019-2027
      6. Table 5 Asia Pacific Glass Additives Market: By Country, 2019-2027
      7. Table 6 The Middle East & Africa Glass Additives Market: By Country, 2019-2027
      8. Table 7 Latin America Glass Additives Market: By Country, 2019-2027
      9. Table 8 Global Glass Additives by Product Market: By Regions, 2019-2027
      10. Table 9 North America Glass Additives by Product Market: By Country, 2019-2027
      11. Table 10 Europe Glass Additives by Product Market: By Country, 2019-2027 Table11 Asia Pacific Glass Additives by Product Market: By Country, 2019-2027 Table12 The Middle East & Africa Glass Additives by Product Market: By Country, 2019-2027 Table13 Latin America Glass Additives by Product Market: By Country, 2019-2027 Table14 North America Glass Additives for Application Market: By Country, 2019-2027 Table15 Europe Glass Additives for Application Market: By Country, 2019-2027 Table16 Asia Pacific Glass Additives for Application Market: By Country, 2019-2027 Table17 The Middle East & Africa Glass Additives for Application Market: By Country, 2019-2027 Table18 Latin America Glass Additives for Application Market: By Country, 2019-2027
      12. Table 19 Global Product Market: By Region, 2019-2027
      13. Table 20 Global Application Market: By Region, 2019-2027
      14. Table 21 North America Glass Additives Market, By Country
      15. Table 22 North America Glass Additives Market, By Product
      16. Table 23 North America Glass Additives Market, By Application Table24 Europe: Glass Additives Market, By Country Table25 Europe: Glass Additives Market, By Product
      17. Table 26 Europe: Glass Additives Market, By Application
      18. Table 27 Asia Pacific: Glass Additives Market, By Country
      19. Table 28 Asia Pacific: Glass Additives Market, By Product
      20. Table 29 Asia Pacific: Glass Additives Market, By Application
      21. Table 30 The Middle East & Africa: Glass Additives Market, By Country
      22. Table 31 The Middle East & Africa Glass Additives Market, By Product
      23. Table 32 The Middle East & Africa: Glass Additives Market, By Application
      24. Table 33 Latin America: Glass Additives Market, By Country
      25. Table 34 Latin America Glass Additives Market, By Product
      26. Table 35 Latin America: Glass Additives Market, By Application List of Figures:
      27. FIGURE 1 Global Glass Additives Market Segmentation
      28. FIGURE 2 Forecast Methodology
      29. FIGURE 3 Five Forces Analysis of Global Glass Additives Market
      30. FIGURE 4 Value Chain of Global Glass Additives Market
      31. FIGURE 5 Share of Global Glass Additives Market in 2019, by country (in %)
      32. FIGURE 6 Global Glass Additives Market, 2019-2027,
      33. FIGURE 7 Sub segments of Product
      34. FIGURE 8 Global Glass Additives Market size by Product, 2019
      35. FIGURE 9 Share of Global Glass Additives Market by Product, 2019 to 2027
      36. FIGURE 10 Sub segments of Application
      37. FIGURE 11 Global Glass Additives Market size by Application, 2019
      38. FIGURE 12 Share of Global Glass Additives Market by Application, 2019 to 2027

    Glass Additives Market Segmentation

    Market Segmentation Overview

    • Detailed segmentation data will be available in the full report
    • Comprehensive analysis by multiple parameters
    • Regional and country-level breakdowns
    • Market size forecasts by segment
    Infographic

    Free Sample Request

    Kindly complete the form below to receive a free sample of this Report

    Get Free Sample

    Customer Strories

    “I am very pleased with how market segments have been defined in a relevant way for my purposes (such as "Portable Freezers & refrigerators" and "last-mile"). In general the report is well structured. Thanks very much for your efforts.”

    Victoria Milne

    Founder
    Case Study
    Chemicals and Materials