• Cat-intel
  • MedIntelliX
  • Resources
  • About Us
  • Hero Background
    English
    Chinese
    French
    Japanese
    Korean
    German
    Spanish

    GaN powered Chargers Market Trends

    ID: MRFR/SEM/10363-HCR
    128 Pages
    Shubham Munde
    October 2025

    GaN-powered Chargers Market Research Report Information By Power Output (25W GaN Chargers, 30W GaN Chargers, 45W GaN Chargers, 60W GaN Chargers, 65W GaN Chargers, 90W GaN Chargers, and 100W GaN Chargers), By Application (Smartphones and Tablets, Laptops and Notebooks, Autonomous Robots, Industrial Equipment, and Wireless Charging), By End User (Consumer Electronics, IT and Telecommunication, Au...

    Share:
    Download PDF ×

    We do not share your information with anyone. However, we may send you emails based on your report interest from time to time. You may contact us at any time to opt-out.

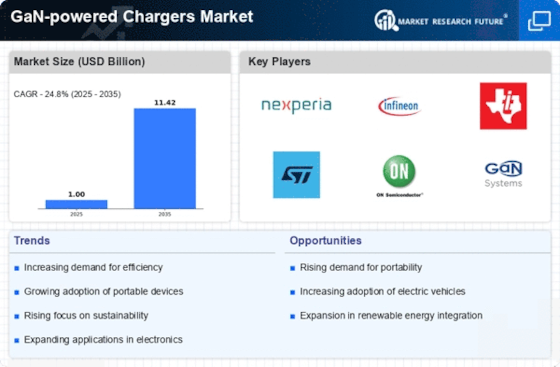
    GaN powered Chargers Market Infographic
    $ 4,950.0
    $ 5,950.0
    $ 7,250.0

    Market Trends

    Key Emerging Trends in the GaN powered Chargers Market

    The gaming monitors market is witnessing several notable trends that are shaping the industry and influencing consumer choices. One prominent trend is the emphasis on higher refresh rates. Gamers are increasingly seeking monitors with refresh rates well beyond the standard 60Hz, aiming for smoother and more responsive gameplay. Monitors with 144Hz, 240Hz, and even higher refresh rates have become popular choices, especially among competitive gamers who prioritize fluid visuals and reduced motion blur.

    Another significant trend is the integration of adaptive sync technologies. Both NVIDIA's G-Sync and AMD's FreeSync have gained traction, as they eliminate screen tearing and stuttering by synchronizing the monitor's refresh rate with the graphics card's frame rate. This technology enhances the overall gaming experience, providing a seamless and tear-free display, and it has become a key consideration for gamers when selecting a monitor.

    The quest for higher resolutions is also a prevailing trend in the gaming monitors market. While 1080p (Full HD) remains popular, there's a growing demand for higher resolutions such as 1440p (Quad HD) and 4K (Ultra HD). Gamers are drawn to the increased clarity and detail offered by higher resolutions, especially when paired with larger monitor sizes. This trend reflects the industry's commitment to providing immersive and visually stunning gaming experiences.

    Curved displays have become increasingly popular, contributing to the immersive trend in gaming monitors. Curved monitors aim to provide a more enveloping viewing experience, especially for users with ultrawide displays. The curvature is designed to match the natural field of view, creating a more immersive and engaging gaming environment. This trend caters to gamers seeking a heightened sense of presence and realism in their gameplay.

    RGB lighting has emerged as a stylish and customizable feature in gaming monitors. Manufacturers incorporate RGB LEDs into the monitor design, allowing users to customize lighting effects to match their gaming setups or preferences. This trend aligns with the broader gaming peripherals market, where RGB lighting has become a popular aesthetic choice among gamers, adding a touch of personalization to their gaming stations.

    Ultra-fast response times are a key trend in the gaming monitors market. Lower response times, measured in milliseconds, reduce motion blur and ghosting, enhancing the visual clarity during fast-paced gaming scenarios. Monitors with response times of 1ms or less are highly sought after by gamers, especially those involved in competitive gaming where split-second reactions can make a significant difference.

    The rise of HDR (High Dynamic Range) technology is transforming the visual quality of gaming monitors. HDR-enabled monitors offer a wider range of colors and increased contrast ratios, resulting in more vibrant and lifelike visuals. As HDR content becomes more prevalent in the gaming industry, monitors supporting HDR are becoming a popular choice for gamers who prioritize stunning visuals and realistic color reproduction.

    Inclusivity and accessibility are emerging trends in the gaming monitors market. Manufacturers are recognizing the diverse needs of gamers, including those with specific requirements, such as color vision deficiencies. Monitors with enhanced accessibility features, such as customizable color profiles and user-friendly interfaces, are gaining attention as the industry moves towards making gaming experiences more inclusive for a broader audience.

    Wireless technology is making its mark in the gaming monitors market. Wireless connectivity, such as Bluetooth and Wi-Fi, is being integrated into monitors, providing a cable-free gaming setup. This trend aligns with the overall movement towards cleaner and more minimalist gaming stations, eliminating the need for cable management and offering greater flexibility in arranging gaming setups.

    Market Summary

    As per Market Research Future Analysis, the Global Gaming Monitors Market was valued at USD 1.00 Billion in 2024 and is projected to grow from USD 1.25 Billion in 2025 to USD 11.42 Billion by 2035, with a CAGR of 24.8% during the forecast period. Key drivers include increased internet accessibility and the adoption of advanced features by gamers and industry players. However, high investment costs for premium gaming displays may restrain growth. The market is also benefiting from the rise of online gaming tournaments and the growing number of gamers, particularly in regions like Asia-Pacific, which has around 1.5 billion video gamers.

    Key Market Trends & Highlights

    The gaming monitors market is experiencing significant growth driven by technological advancements and increasing gamer participation.

    • Market Size in 2024: USD 1.00 Billion Projected Market Size by 2035: USD 11.42 Billion CAGR from 2025 to 2035: 24.80% Dominant End User Segment: Consumers in 2022

    Market Size & Forecast

    2024 Market Size USD 1.00 Billion
    2035 Market Size USD 11.42 Billion
    CAGR (2025-2035) 24.80%
    Largest Regional Market Share in 2022 North America

    Major Players

    <p>Key players include Samsung Electronics Co., Ltd., LG Electronics, Dell Inc., ASUSTek Computer Inc., GIGA-BYTE Technology Co., Ltd., AOC Global, Micro-Star INT'L CO., LTD., CORSAIR, and BenQ Corporation.</p>

    Market Trends

    The extensive utilization of GaN powered chargers in various end use industries is driving the market growth

    The widespread use of GaN powered chargers in numerous end use sectors is now driving the market. For instance, electric vehicles (EVs) and hybrid electric vehicles (HEVs) employ it in the lighting and brake control systems. Global sales of EVs and HEVs are increasing as a result of governments in numerous nations enacting strict regulations on greenhouse gas (GHG) emissions. Additionally, they are encouraging people to use energy-efficient technology, which is increasing the demand for GaN powered chargers in the defence and aerospace sectors.

    In radars, these components are also used to improve navigation, prevent collisions, and enable real-time air traffic control. In order to improve surgical precision, they are also used in the production of medical scanning devices including sonograms, MRIs, and miniature X-ray machines. Additionally, they are employed in distributed antenna systems (DAS), tiny cells, and the densification of remote radio head networks. In addition, it is anticipated that in the upcoming years, manufacturers would benefit from the growing usage of internet of things (IoT) technology and the advent of 5G technology.

    The market for GaN-powered chargers is driven by the need for quick charging options that produce less heat and lessen the possibility of overcharging. The market for GaN-powered chargers is anticipated to grow as a result of the rising use of contemporary chargers, which feature monitoring systems across numerous end-use sectors. Industry growth has been fueled by the need for fast charging for the telecommunications sectors while maintaining all power capabilities and safety norms.

    Additionally, it is anticipated that throughout the forecast period, the integration of technologies such as Internet of Things (IoT), artificial intelligence (AI), machine learning, and others would hasten the total market advancement. The growing demand for these chargers across various industries is also expected to contribute to the market's rapid expansion. During the projection period, the market's growth rate will be further boosted by the spike in demand for energy-efficient and quick charging devices.

    Gallium nitride (GaN) powered chargers are expected to experience continued rapid growth over the course of the projection period thanks to the development of tiny GaN-powered chargers that can be integrated with small electronics devices. Additionally, industry participants are focusing on R&D activities to expand GaN technology and introduce more potent goods. Consumer electronics device manufacturers are entering into long-term agreements with manufacturers of GaN-powered chargers in order to maintain or increase their market position in the global market. Thus, driving the GaN-powered Chargers market revenue.

    <p>The increasing demand for energy-efficient solutions in consumer electronics is driving the adoption of GaN technology in charging devices, which appears to enhance performance while reducing environmental impact.</p>

    U.S. Department of Energy

    GaN powered Chargers Market Market Drivers

    Consumer Electronics Market Growth

    The Global GaN-powered Chargers Market Industry is closely tied to the growth of the consumer electronics market. As the demand for high-performance devices continues to rise, manufacturers are increasingly adopting GaN technology to meet consumer expectations for faster and more efficient charging solutions. The proliferation of smart devices, including wearables and IoT gadgets, further fuels this trend. The market's expansion is indicative of a broader shift towards advanced charging technologies, with projections suggesting a robust growth trajectory. The increasing integration of GaN chargers in consumer electronics is likely to play a pivotal role in shaping the industry's future.

    Environmental Sustainability Initiatives

    The Global GaN-powered Chargers Market Industry aligns with the growing emphasis on environmental sustainability. GaN chargers are known for their energy efficiency, which contributes to reduced carbon footprints compared to conventional chargers. As global awareness of climate change increases, consumers and businesses are increasingly prioritizing eco-friendly products. This shift is evident in the rising demand for GaN technology, which not only offers faster charging but also minimizes energy waste. The market's potential for growth is underscored by the projected CAGR of 24.78% from 2025 to 2035, reflecting a broader trend towards sustainable technology solutions in the electronics sector.

    Growing Demand for Fast Charging Solutions

    The Global GaN-powered Chargers Market Industry experiences a notable surge in demand for fast charging solutions, driven by the increasing reliance on portable electronic devices. As consumers seek efficient charging options for smartphones, laptops, and tablets, GaN technology offers a compelling advantage due to its ability to deliver higher power levels in a compact form. This trend is reflected in the projected market value of 1 USD Billion in 2024, highlighting the industry's rapid growth. The efficiency of GaN chargers, which can charge devices up to three times faster than traditional silicon-based chargers, positions them as a preferred choice among consumers and manufacturers alike.

    Expansion of Electric Vehicle Charging Infrastructure

    The Global GaN-powered Chargers Market Industry is significantly influenced by the expansion of electric vehicle (EV) charging infrastructure. As governments worldwide implement policies to promote electric mobility, the demand for efficient charging solutions rises. GaN technology, with its ability to handle high power levels and compact design, is well-suited for EV chargers. This trend is further supported by investments in charging networks, which are expected to proliferate in urban and suburban areas. The integration of GaN chargers into EV infrastructure not only enhances charging speed but also supports the transition to sustainable transportation, thereby driving market growth.

    Technological Advancements in Semiconductor Materials

    The Global GaN-powered Chargers Market Industry benefits from continuous advancements in semiconductor materials, particularly gallium nitride. This material exhibits superior thermal conductivity and efficiency compared to traditional silicon, enabling the development of smaller and more powerful chargers. As manufacturers invest in research and development, the performance of GaN chargers improves, leading to increased adoption across various sectors. The anticipated growth trajectory suggests that by 2035, the market could reach a valuation of 11.4 USD Billion, driven by innovations that enhance charging speed and reduce energy loss. This technological evolution is crucial for meeting the demands of modern electronics.

    Market Segment Insights

    GaN-powered Chargers Power Output Insights

    <p>The GaN-powered Chargers Market segmentation, based on Power Output, includes 25W GaN Chargers, 30W GaN Chargers, 45W GaN Chargers, 60W GaN Chargers, 65W GaN Chargers, 90W GaN Chargers, and 100W GaN Chargers. 30W GaN chargers segment dominated the global market in 2022. Due to their great efficiency and high energy density, 30W GaN chargers are being used more frequently to recharge laptops, cellphones, and tablets.</p>

    GaN-powered Chargers Application Insights

    <p>The GaN-powered Chargers Market segmentation, based on Application, includes Smartphones and Tablets, Laptops and Notebooks, Autonomous Robots, Industrial Equipment, and Wireless Charging. Smartphones and tablets segment dominated the GaN-powered Chargers Market in 2022. Compared to silicon, GaN-powered chargers are more compact and lightweight but also more durable and effective. Additionally, these chargers guarantee fast charging capabilities, which will increase their sales over the anticipated time frame.</p>

    GaN-powered Chargers End User Insights

    <p>The GaN-powered Chargers Market segmentation, based on End User, includes Consumer Electronics, IT and Telecommunication, Automotive, Aerospace and Defense, and Others. Automotive segment dominated the global market in 2022. This is explained by the rising need for GaN-powered chargers in the EV automobile industry.</p>

    <p>Figure 1: GaN-powered Chargers Market, by End User, 2022 &amp; 2032 (USD Billion)</p>

    <p>Source: Secondary Research, Primary Research, MRFR Database and Analyst Review</p>

    Get more detailed insights about GaN-powered Chargers Market Research Report—Global Forecast till 2034

    Regional Insights

    By region, the study provides the market insights into North America, Europe, Asia-Pacific and Rest of the World. The North America GaN-powered Chargers Market dominated this market in 2022 (45.80%). This is because some of the top suppliers and manufacturers are well-represented in the area. This can be attributed to the rise in demand for GaN-powered chargers for a variety of applications, including wireless charging, autonomous robotics, computers, notebooks, smartphones, and tablets. Further, the U.S. GaN-powered Chargers market held the largest market share, and the Canada GaN-powered Chargers market was the fastest growing market in the North America region.

    Further, the major countries studied in the market report are The US, Canada, German, France, the UK, Italy, Spain, China, Japan, India, Australia, South Korea, and Brazil.

    Figure 2: GAN-POWERED CHARGERS MARKET SHARE BY REGION 2022 (USD Billion)

    GAN-POWERED CHARGERS MARKET SHARE BY REGION 2022

    Source: Secondary Research, Primary Research, MRFR Database and Analyst Review

    Europe GaN-powered Chargers market accounted for the healthy market share in 2022. Application in many end-use areas is accelerating due to technological advancements in GaN semiconductor devices. A growing emphasis on various radio frequency (RF) and wireless applications will also help the market grow. One of the key developments in Europe is the rising demand for GaN in wireless devices. Further, the German GaN-powered Chargers market held the largest market share, and the U.K GaN-powered Chargers market was the fastest growing market in the European region

    The Asia Pacific GaN-powered Chargers market is expected to register significant growth from 2023 to 2032. In developing nations like China, there is a growing market for high-tech GaN-powered charger items like the Dual USB-C PD GaN Wall Charger, controllers, and chargers, which is opening up profitable expansion prospects. Due to the large number of Tier II and Tier III manufacturers in East Asia, the automotive and telecom industries are expanding quickly. As a result, there will likely be a rise in the demand for GaN-powered chargers in the area.

    Moreover, China’s GaN-powered Chargers market held the largest market share, and the Indian GaN-powered Chargers market was the fastest growing market in the Asia-Pacific region.

    Key Players and Competitive Insights

    Leading market players are investing heavily in research and development in order to expand their product lines, which will help the GaN-powered Chargers market, grow even more. Market participants are also undertaking a variety of strategic activities to expand their global footprint, with important market developments including new product launches, contractual agreements, mergers and acquisitions, higher investments, and collaboration with other organizations. To expand and survive in a more competitive and rising market climate, GaN-powered Chargers Industry must offer cost-effective items.

    Manufacturing locally to minimize operational costs is one of the key business tactics used by manufacturers in the global GaN-powered Chargers Industry to benefit clients and increase the market sector. In recent years, the GaN-powered Chargers Industry has offered some of the most significant advantages to medicine.

    Major players in the GaN-powered Chargers market, including Fujitsu, Toshiba Corporation, Texas Instruments Incorporated, Cree LED, Aixtron, Mitsubishi Chemical Corporation, Eaton, Siemens, Belkin International, Inc., Aukey, Gizmochina, VisIC Technologies, Koninklijke Philips N.V., VINA International Holdings LTD., GaN Systems Inc., Epigan NV, and Navitas Semiconductor Ltd., are attempting to increase market demand by investing in research and development operations.

    Baseus is a manufacturer and owner of a consumer electronics brand that aims to offer consumers straightforward, cost-effective, and useful gadgets. The company's brand is focused on giving consumers with affordable and useful electronics solutions by delivering them high-quality items with premium feel and application cases for various lifestyles. Baseus introduced new Gallium Nitride (GaN) Series 120W charging heads in November 2020, with outputs of 45W, 65W, and 120W. Additionally, the business led the charging sector by introducing the first 65W triple-port quick charging plug. The 120W new Gallium Nitride (GaN) Series is primarily made for 100W 20V/5A laptop charging.

    Additionally, it supports rapid charging on two laptops at once, including MacBook, Dell, HP, Lenovo, and others.

    A multifaceted company with interests in electronics, electrical equipment, and information technology is Toshiba Corp (Toshiba). Storage devices, point-of-sale (POS) systems, energy-saving goods and services, semiconductors, microwave semiconductors and components, tablets, home appliance products, power systems, transmission and distribution systems, and water treatment systems are among the products it designs, develops, manufactures, and sells.

    It provides building and facility technologies, digital solutions, building solutions for power systems, and other solutions for social infrastructure, including steam turbines for thermal power plants, wind and nuclear power generation systems, hydroelectric, secondary batteries, and energy supply systems, as well as lighting, air conditioning, and lift systems. The corporation conducts business throughout the Americas, Europe, the Middle East, Asia-Pacific, and Africa. The headquarters of Toshiba are in Minato-ku, Tokyo, Japan.

    Key Companies in the GaN powered Chargers Market market include

    Industry Developments

    September 2020: In order to expand indoor coverage, Samsung Electronics struck a contract with Verizon as its first client in the United States. The current standard for rapid charging is GaN-based wall chargers, which Verizon offers. GaN-based wall chargers are considerably more compact than other types of conventional chargers.

    Future Outlook

    GaN powered Chargers Market Future Outlook

    <p>The GaN-powered Chargers Market is projected to grow at a 24.80% CAGR from 2025 to 2035, driven by increasing demand for efficient charging solutions and advancements in semiconductor technology.</p>

    New opportunities lie in:

    • <p>Develop compact GaN chargers for electric vehicles to capture emerging market segments.&nbsp;</p><p>Innovate wireless charging solutions utilizing GaN technology for consumer electronics.&nbsp;</p><p>Expand partnerships with tech companies to integrate GaN chargers into new devices.</p>

    <p>By 2035, the GaN-powered Chargers Market is poised to achieve substantial growth, reflecting a robust demand for advanced charging technologies.</p>

    Market Segmentation

    GaN-powered Chargers End User Outlook

    • Consumer Electronics
    • IT and Telecommunication
    • Automotive
    • Aerospace and Defense
    • Others

    GaN-powered Chargers Regional Outlook

    • {"North America"=>["US"
    • "Canada"]}
    • {"Europe"=>["Germany"
    • "France"
    • "UK"
    • "Italy"
    • "Spain"
    • "Rest of Europe"]}
    • {"Asia-Pacific"=>["China"
    • "Japan"
    • "India"
    • "Australia"
    • "South Korea"
    • "Rest of Asia-Pacific"]}
    • {"Rest of the World"=>["Middle East"
    • "Africa"
    • "Latin America"]}

    GaN-powered Chargers Application Outlook

    • Smartphones and Tablets
    • Laptops and Notebooks
    • Autonomous Robots
    • Industrial Equipment
    • Wireless Charging

    GaN-powered Chargers Power Output Outlook

    • 25W GaN Chargers
    • 30W GaN Chargers
    • 45W GaN Chargers
    • 60W GaN Chargers
    • 65W GaN Chargers
    • 90W GaN Chargers
    • 100W GaN Chargers

    Report Scope

    Report Attribute/Metric Details
    Market Size 2024 USD 1.0 Billion
    Market Size 2025 USD 1.25 Billion
    Market Size 2035 11.42 (Value (USD Billion))
    Compound Annual Growth Rate (CAGR) 24.80% (2025 - 2035)
    Base Year 2024
    Market Forecast Period 2025 - 2035
    Historical Data 2020-2023
    Market Forecast Units Value (USD Billion)
    Report Coverage Revenue Forecast, Market Competitive Landscape, Growth Factors, and Trends
    Segments Covered Power Output, Application, End User, and Region
    Geographies Covered North America, Europe, Asia Pacific, and the Rest of the World
    Countries Covered The U.S., Canada, German, France, U.K, Italy, Spain, China, Japan, India, Australia, South Korea, and Brazil
    Key Companies Profiled Fujitsu, Toshiba Corporation, Texas Instruments Incorporated, Cree LED, Aixtron, Mitsubishi Chemical Corporation, Eaton, Siemens, Belkin International, Inc., Aukey, Gizmochina, VisIC Technologies, Koninklijke Philips N.V., VINA International Holdings LTD., GaN Systems Inc., Epigan NV, and Navitas Semiconductor Ltd.
    Key Market Opportunities Requirement of GaN powered chargers in electric and hybrid vehicle
    Key Market Dynamics The extensive utilization of GaN power devices in various end use industries and burgeoning demand for GaN powered chargers

    Market Highlights

    Author

    Shubham Munde
    Research Analyst Level II

    She holds an experience of about 6+ years in market research and business consulting, working under the spectrum of information communication technology, telecommunications and semiconductor domains. aarti conceptualizes and implements a scalable business strategy and provides strategic leadership to the clients. her expertise lies in market estimation, competitive intelligence, pipeline analysis, customer assessment, etc.

    Leave a Comment

    Latest Comments

    John Doe
    john@example.com

    This is a great article! Really helped me understand the topic better.

    Posted on July 23, 2025, 10:15 AM
    Jane Smith
    jane@domain.com

    Thanks for sharing this. I’ve bookmarked it for later reference.

    Posted on July 22, 2025, 7:45 PM

    FAQs

    How much is the GaN-powered Chargers market?

    The GaN-powered Chargers Market size was valued at USD 1.00 billion in 2024.

    What is the growth rate of the GaN-powered Chargers market?

    The global market is projected to grow at a CAGR of 24.80% during the forecast period, 2025 to 2035.

    Which region held the largest market share in the GaN-powered Chargers market?

    North America had the largest share in the global market

    Who are the key players in the GaN-powered Chargers market?

    The key players in the market are Fujitsu, Toshiba Corporation, Texas Instruments Incorporated, Cree LED, Aixtron, Mitsubishi Chemical Corporation, Eaton, Siemens, Belkin International, Inc., Aukey, Gizmochina, VisIC Technologies, Koninklijke Philips N.V., VINA International Holdings LTD., GaN Systems Inc., Epigan NV, and Navitas Semiconductor Ltd.

    Which Power Output led the GaN-powered Chargers market?

    The 30W GaN Chargers Power Output dominated the market in 2022.

    Which Application had the largest market share in the GaN-powered Chargers market?

    The Smartphones and Tablets Application had the largest share in the global market.

    1. . EXECUTIVE SUMMARY
    2. . MARKET INTRODUCTION
    3. . Definition
    4. . Scope of the Study
    5. . Research Objective
    6. . Assumptions
    7. . Limitations
    8. . RESEARCH METHODOLOGY
    9. . Overview
    10. . Data Mining
    11. . Secondary Research
    12. . Primary Research
    13. . Primary Interviews and Information Gathering Process
    14. . Breakdown of Primary Respondents
    15. . Forecasting Modality
    16. . Market Size Estimation
    17. . Bottom-Up Approach
    18. . Top-Down Approach
    19. . Data Triangulation
    20. . Validation
    21. . MARKET DYNAMICS
    22. . Overview
    23. . Drivers
    24. . Restraints
    25. . Opportunities
    26. . MARKET FACTOR ANALYSIS
    27. . Value Chain Analysis
    28. . Porter’s Five Forces Analysis
    29. . Bargaining Power of Suppliers
    30. . Bargaining Power of Buyers
    31. . Threat of New Entrants
    32. . Threat of Substitutes
    33. . Intensity of Rivalry
    34. . COVID-19 Impact Analysis
    35. . Market Impact Analysis
    36. . Regional Impact
    37. . Opportunity and Threat Analysis
    38. . GLOBAL GAN-POWERED CHARGERS MARKET, BY POWER OUTPUT
    39. . Overview
    40. . 25W GaN Chargers
    41. . 30W GaN Chargers
    42. . 45W GaN Chargers
    43. . 60W GaN Chargers
    44. . 65W GaN Chargers
    45. . 90W GaN Chargers
    46. . 100W GaN Chargers
    47. . GLOBAL GAN-POWERED CHARGERS MARKET, BY APPLICATION
    48. . Overview
    49. . Smartphones and Tablets
    50. . Laptops and Notebooks
    51. . Autonomous Robots
    52. . Industrial Equipment
    53. . Wireless Charging
    54. . GLOBAL GAN-POWERED CHARGERS MARKET, BY END USER
    55. . Overview
    56. . Consumer Electronics
    57. . IT and Telecommunication
    58. . Automotive
    59. . Aerospace and Defense
    60. . Others
    61. . GLOBAL GAN-POWERED CHARGERS MARKET, BY REGION
    62. . Overview
    63. . North America
    64. . U.S.
    65. . Canada
    66. . Europe
    67. . Germany
    68. . France
    69. . U.K
    70. . Italy
    71. . Spain
    72. . Rest of Europe
    73. . Asia-Pacific
    74. . China
    75. . India
    76. . Japan
    77. . South Korea
    78. . Australia
    79. . Rest of Asia-Pacific
    80. . Rest of the World
    81. . Middle East
    82. . Africa
    83. . Latin America
    84. . COMPETITIVE LANDSCAPE
    85. . Overview
    86. . Competitive Analysis
    87. . Market Share Analysis
    88. . Major Growth Strategy in the Global GaN-powered Chargers Market,
    89. . Competitive Benchmarking
    90. . Leading Players in Terms of Number of Developments in the Global GaN-powered Chargers Market,
    91. . Key developments and Growth Strategies
    92. . New Power Output Launch/Application Deployment
    93. . Merger & Acquisitions
    94. . Joint Ventures
    95. . Major Players Financial Matrix
    96. . Sales & Operating Income, 2024
    97. . Major Players R&D Expenditure. 2024
    98. . COMPANY PROFILES
    99. . Fujitsu (Japan).
    100. . Company Overview
    101. . Financial Overview
    102. . Power Outputs Offered
    103. . Key Developments
    104. . SWOT Analysis
    105. . Key Strategies
    106. . Toshiba Corporation (Japan)
    107. . Company Overview
    108. . Financial Overview
    109. . Power Outputs Offered
    110. . Key Developments
    111. . SWOT Analysis
    112. . Key Strategies
    113. . Texas Instruments Incorporated (U.S.)
    114. . Company Overview
    115. . Financial Overview
    116. . Power Outputs Offered
    117. . Key Developments
    118. . SWOT Analysis
    119. . Key Strategies
    120. . Cree LED (U.S.)
    121. . Company Overview
    122. . Financial Overview
    123. . Power Outputs Offered
    124. . Key Developments
    125. . SWOT Analysis
    126. . Key Strategies
    127. . Aixtron (Germany)
    128. . Company Overview
    129. . Financial Overview
    130. . Power Outputs Offered
    131. . Key Developments
    132. . SWOT Analysis
    133. . Key Strategies
    134. . MITSUBISHI CHEMICAL CORPORATION (JAPAN)
    135. . Company Overview
    136. . Financial Overview
    137. . Power Outputs Offered
    138. . Key Developments
    139. . SWOT Analysis
    140. . Key Strategies
    141. . Eaton (Ireland)
    142. . Company Overview
    143. . Financial Overview
    144. . Power Outputs Offered
    145. . Key Developments
    146. . SWOT Analysis
    147. . Key Strategies
    148. . Siemens (Germany)
    149. . Company Overview
    150. . Financial Overview
    151. . Power Outputs Offered
    152. . Key Developments
    153. . SWOT Analysis
    154. . Key Strategies
    155. . Belkin International, Inc (U.S.)
    156. . Company Overview
    157. . Financial Overview
    158. . Power Outputs Offered
    159. . Key Developments
    160. . SWOT Analysis
    161. . Key Strategies
    162. . Aukey (China)
    163. . Company Overview
    164. . Financial Overview
    165. . Power Outputs Offered
    166. . Key Developments
    167. . SWOT Analysis
    168. . Key Strategies
    169. . Gizmochina (China)
    170. . Company Overview
    171. . Financial Overview
    172. . Power Outputs Offered
    173. . Key Developments
    174. . SWOT Analysis
    175. . Key Strategies
    176. . VisIC Technologies (Israel)
    177. . Company Overview
    178. . Financial Overview
    179. . Power Outputs Offered
    180. . Key Developments
    181. . SWOT Analysis
    182. . Key Strategies
    183. . Koninklijke Philips N.V. (Netherlands)
    184. . Company Overview
    185. . Financial Overview
    186. . Power Outputs Offered
    187. . Key Developments
    188. . SWOT Analysis
    189. . Key Strategies
    190. . VINA International Holdings LTD. (U.S.)
    191. . Company Overview
    192. . Financial Overview
    193. . Power Outputs Offered
    194. . Key Developments
    195. . SWOT Analysis
    196. . Key Strategies
    197. . GaN Systems Inc. (Canada)
    198. . Company Overview
    199. . Financial Overview
    200. . Power Outputs Offered
    201. . Key Developments
    202. . SWOT Analysis
    203. . Key Strategies
    204. . Epigan NV (Belgium)
    205. . Company Overview
    206. . Financial Overview
    207. . Power Outputs Offered
    208. . Key Developments
    209. . SWOT Analysis
    210. . Key Strategies
    211. . Navitas Semiconductor Ltd. (U.S.)
    212. . Company Overview
    213. . Financial Overview
    214. . Power Outputs Offered
    215. . Key Developments
    216. . SWOT Analysis
    217. . Key Strategies
    218. . APPENDIX
    219. . References
    220. . Related Reports   LIST OF TABLES TABLE 1 GLOBAL GAN-POWERED CHARGERS MARKET, SYNOPSIS, 2018-2032 TABLE 2 GLOBAL GAN-POWERED CHARGERS MARKET, ESTIMATES & FORECAST, 2020-2034(USD BILLION) TABLE 3 GLOBAL GAN-POWERED CHARGERS MARKET, BY POWER OUTPUT, 2020-2034(USD BILLION) TABLE 4 GLOBAL GAN-POWERED CHARGERS MARKET, BY APPLICATION, 2020-2034(USD BILLION) TABLE 5 GLOBAL GAN-POWERED CHARGERS MARKET, BY END USER, 2020-2034(USD BILLION) TABLE 6 NORTH AMERICA GAN-POWERED CHARGERS MARKET, BY POWER OUTPUT, 2020-2034(USD BILLION) TABLE 7 NORTH AMERICA GAN-POWERED CHARGERS MARKET, BY APPLICATION, 2020-2034(USD BILLION) TABLE 8 NORTH AMERICA GAN-POWERED CHARGERS MARKET, BY END USER, 2020-2034(USD BILLION) TABLE 9 NORTH AMERICA GAN-POWERED CHARGERS MARKET, BY COUNTRY, 2020-2034(USD BILLION) TABLE 10 U.S. GAN-POWERED CHARGERS MARKET, BY POWER OUTPUT, 2020-2034(USD BILLION) TABLE 11 U.S. GAN-POWERED CHARGERS MARKET, BY APPLICATION, 2020-2034(USD BILLION) TABLE 12 U.S. GAN-POWERED CHARGERS MARKET, BY END USER, 2020-2034(USD BILLION) TABLE 13 CANADA GAN-POWERED CHARGERS MARKET, BY POWER OUTPUT, 2020-2034(USD BILLION) TABLE 14 CANADA GAN-POWERED CHARGERS MARKET, BY APPLICATION, 2020-2034(USD BILLION) TABLE 15 CANADA GAN-POWERED CHARGERS MARKET, BY END USER, 2020-2034(USD BILLION) TABLE 16 EUROPE GAN-POWERED CHARGERS MARKET, BY POWER OUTPUT, 2020-2034(USD BILLION) TABLE 17 EUROPE GAN-POWERED CHARGERS MARKET, BY APPLICATION, 2020-2034(USD BILLION) TABLE 18 EUROPE GAN-POWERED CHARGERS MARKET, BY END USER, 2020-2034(USD BILLION) TABLE 19 EUROPE GAN-POWERED CHARGERS MARKET, BY COUNTRY, 2020-2034(USD BILLION) TABLE 20 GERMANY GAN-POWERED CHARGERS MARKET, BY POWER OUTPUT, 2020-2034(USD BILLION) TABLE 21 GERMANY GAN-POWERED CHARGERS MARKET, BY APPLICATION, 2020-2034(USD BILLION) TABLE 22 GERMANY GAN-POWERED CHARGERS MARKET, BY END USER, 2020-2034(USD BILLION) TABLE 23 FRANCE GAN-POWERED CHARGERS MARKET, BY POWER OUTPUT, 2020-2034(USD BILLION) TABLE 24 FRANCE GAN-POWERED CHARGERS MARKET, BY APPLICATION, 2020-2034(USD BILLION) TABLE 25 FRANCE GAN-POWERED CHARGERS MARKET, BY END USER, 2020-2034(USD BILLION) TABLE 26 ITALY GAN-POWERED CHARGERS MARKET, BY POWER OUTPUT, 2020-2034(USD BILLION) TABLE 27 ITALY GAN-POWERED CHARGERS MARKET, BY APPLICATION, 2020-2034(USD BILLION) TABLE 28 ITALY GAN-POWERED CHARGERS MARKET, BY END USER, 2020-2034(USD BILLION) TABLE 29 SPAIN GAN-POWERED CHARGERS MARKET, BY POWER OUTPUT, 2020-2034(USD BILLION) TABLE 30 SPAIN GAN-POWERED CHARGERS MARKET, BY APPLICATION, 2020-2034(USD BILLION) TABLE 31 SPAIN GAN-POWERED CHARGERS MARKET, BY END USER, 2020-2034(USD BILLION) TABLE 32 U.K GAN-POWERED CHARGERS MARKET, BY POWER OUTPUT, 2020-2034(USD BILLION) TABLE 33 U.K GAN-POWERED CHARGERS MARKET, BY APPLICATION, 2020-2034(USD BILLION) TABLE 34 U.K GAN-POWERED CHARGERS MARKET, BY END USER, 2020-2034(USD BILLION) TABLE 35 REST OF EUROPE GAN-POWERED CHARGERS MARKET, BY POWER OUTPUT, 2020-2034(USD BILLION) TABLE 36 REST OF EUROPE GAN-POWERED CHARGERS MARKET, BY APPLICATION, 2020-2034(USD BILLION) TABLE 37 REST OF EUROPE GAN-POWERED CHARGERS MARKET, BY END USER, 2020-2034(USD BILLION) TABLE 38 ASIA PACIFIC GAN-POWERED CHARGERS MARKET, BY POWER OUTPUT, 2020-2034(USD BILLION) TABLE 39 ASIA PACIFIC GAN-POWERED CHARGERS MARKET, BY APPLICATION, 2020-2034(USD BILLION) TABLE 40 ASIA PACIFIC GAN-POWERED CHARGERS MARKET, BY END USER, 2020-2034(USD BILLION) TABLE 41 ASIA PACIFIC GAN-POWERED CHARGERS MARKET, BY COUNTRY, 2020-2034(USD BILLION) TABLE 42 JAPAN GAN-POWERED CHARGERS MARKET, BY POWER OUTPUT, 2020-2034(USD BILLION) TABLE 43 JAPAN GAN-POWERED CHARGERS MARKET, BY APPLICATION, 2020-2034(USD BILLION) TABLE 44 JAPAN GAN-POWERED CHARGERS MARKET, BY END USER, 2020-2034(USD BILLION) TABLE 45 CHINA GAN-POWERED CHARGERS MARKET, BY POWER OUTPUT, 2020-2034(USD BILLION) TABLE 46 CHINA GAN-POWERED CHARGERS MARKET, BY APPLICATION, 2020-2034(USD BILLION) TABLE 47 CHINA GAN-POWERED CHARGERS MARKET, BY END USER, 2020-2034(USD BILLION) TABLE 48 INDIA GAN-POWERED CHARGERS MARKET, BY POWER OUTPUT, 2020-2034(USD BILLION) TABLE 49 INDIA GAN-POWERED CHARGERS MARKET, BY APPLICATION, 2020-2034(USD BILLION) TABLE 50 INDIA GAN-POWERED CHARGERS MARKET, BY END USER, 2020-2034(USD BILLION) TABLE 51 AUSTRALIA GAN-POWERED CHARGERS MARKET, BY POWER OUTPUT, 2020-2034(USD BILLION) TABLE 52 AUSTRALIA GAN-POWERED CHARGERS MARKET, BY APPLICATION, 2020-2034(USD BILLION) TABLE 53 AUSTRALIA GAN-POWERED CHARGERS MARKET, BY END USER, 2020-2034(USD BILLION) TABLE 54 SOUTH KOREA GAN-POWERED CHARGERS MARKET, BY POWER OUTPUT, 2020-2034(USD BILLION) TABLE 55 SOUTH KOREA GAN-POWERED CHARGERS MARKET, BY APPLICATION, 2020-2034(USD BILLION) TABLE 56 SOUTH KOREA GAN-POWERED CHARGERS MARKET, BY END USER, 2020-2034(USD BILLION) TABLE 57 REST OF ASIA-PACIFIC GAN-POWERED CHARGERS MARKET, BY POWER OUTPUT, 2020-2034(USD BILLION) TABLE 58 REST OF ASIA-PACIFIC GAN-POWERED CHARGERS MARKET, BY APPLICATION, 2020-2034(USD BILLION) TABLE 59 REST OF ASIA-PACIFIC GAN-POWERED CHARGERS MARKET, BY END USER, 2020-2034(USD BILLION) TABLE 60 REST OF WORLD GAN-POWERED CHARGERS MARKET, BY POWER OUTPUT, 2020-2034(USD BILLION) TABLE 61 REST OF WORLD GAN-POWERED CHARGERS MARKET, BY APPLICATION, 2020-2034(USD BILLION) TABLE 62 REST OF WORLD GAN-POWERED CHARGERS MARKET, BY END USER, 2020-2034(USD BILLION) TABLE 63 REST OF WORLD GAN-POWERED CHARGERS MARKET, BY COUNTRY, 2020-2034(USD BILLION) TABLE 64 MIDDLE EAST GAN-POWERED CHARGERS MARKET, BY POWER OUTPUT, 2020-2034(USD BILLION) TABLE 65 MIDDLE EAST GAN-POWERED CHARGERS MARKET, BY APPLICATION, 2020-2034(USD BILLION) TABLE 66 MIDDLE EAST GAN-POWERED CHARGERS MARKET, BY END USER, 2020-2034(USD BILLION) TABLE 67 AFRICA GAN-POWERED CHARGERS MARKET, BY POWER OUTPUT, 2020-2034(USD BILLION) TABLE 68 AFRICA GAN-POWERED CHARGERS MARKET, BY APPLICATION, 2020-2034(USD BILLION) TABLE 69 AFRICA GAN-POWERED CHARGERS MARKET, BY END USER, 2020-2034(USD BILLION) TABLE 70 LATIN AMERICA GAN-POWERED CHARGERS MARKET, BY POWER OUTPUT, 2020-2034(USD BILLION) TABLE 71 LATIN AMERICA GAN-POWERED CHARGERS MARKET, BY APPLICATION, 2020-2034(USD BILLION) TABLE 72 LATIN AMERICA GAN-POWERED CHARGERS MARKET, BY END USER, 2020-2034(USD BILLION)  LIST OF FIGURES FIGURE 1 RESEARCH PROCESS FIGURE 2 MARKET STRUCTURE FOR THE GLOBAL GAN-POWERED CHARGERS MARKET FIGURE 3 MARKET DYNAMICS FOR THE GLOBAL GAN-POWERED CHARGERS MARKET FIGURE 4 GLOBAL GAN-POWERED CHARGERS MARKET, SHARE (%), BY POWER OUTPUT, 2024 FIGURE 5 GLOBAL GAN-POWERED CHARGERS MARKET, SHARE (%), BY APPLICATION, 2024 FIGURE 6 GLOBAL GAN-POWERED CHARGERS MARKET, SHARE (%), BY END USER, 2024 FIGURE 7 GLOBAL GAN-POWERED CHARGERS MARKET, SHARE (%), BY REGION, 2024 FIGURE 8 NORTH AMERICA: GAN-POWERED CHARGERS MARKET, SHARE (%), BY REGION, 2024 FIGURE 9 EUROPE: GAN-POWERED CHARGERS MARKET, SHARE (%), BY REGION, 2024 FIGURE 10 ASIA-PACIFIC: GAN-POWERED CHARGERS MARKET, SHARE (%), BY REGION, 2024 FIGURE 11 REST OF THE WORLD: GAN-POWERED CHARGERS MARKET, SHARE (%), BY REGION, 2024 FIGURE 12 GLOBAL GAN-POWERED CHARGERS MARKET: COMPANY SHARE ANALYSIS, 2024 (%) FIGURE 13 FUJITSU (JAPAN).: FINANCIAL OVERVIEW SNAPSHOT FIGURE 14 FUJITSU (JAPAN).: SWOT ANALYSIS FIGURE 15 TOSHIBA CORPORATION (JAPAN): FINANCIAL OVERVIEW SNAPSHOT FIGURE 16 TOSHIBA CORPORATION (JAPAN): SWOT ANALYSIS FIGURE 17 TEXAS INSTRUMENTS INCORPORATED (U.S.): FINANCIAL OVERVIEW SNAPSHOT FIGURE 18 TEXAS INSTRUMENTS INCORPORATED (U.S.): SWOT ANALYSIS FIGURE 19 CREE LED (U.S.): FINANCIAL OVERVIEW SNAPSHOT FIGURE 20 CREE LED (U.S.): SWOT ANALYSIS FIGURE 21 AIXTRON (GERMANY) .: FINANCIAL OVERVIEW SNAPSHOT FIGURE 22 AIXTRON (GERMANY) .: SWOT ANALYSIS FIGURE 23 MITSUBISHI CHEMICAL CORPORATION (JAPAN): FINANCIAL OVERVIEW SNAPSHOT FIGURE 24 MITSUBISHI CHEMICAL CORPORATION (JAPAN): SWOT ANALYSIS FIGURE 25 EATON (IRELAND): FINANCIAL OVERVIEW SNAPSHOT FIGURE 26 EATON (IRELAND): SWOT ANALYSIS FIGURE 27 SIEMENS (GERMANY): FINANCIAL OVERVIEW SNAPSHOT FIGURE 28 SIEMENS (GERMANY): SWOT ANALYSIS FIGURE 29 BELKIN INTERNATIONAL, INC (U.S.): FINANCIAL OVERVIEW SNAPSHOT FIGURE 30 BELKIN INTERNATIONAL, INC (U.S.): SWOT ANALYSIS FIGURE 31 AUKEY (CHINA): FINANCIAL OVERVIEW SNAPSHOT FIGURE 32 AUKEY (CHINA): SWOT ANALYSIS FIGURE 33 GIZMOCHINA (CHINA): FINANCIAL OVERVIEW SNAPSHOT FIGURE 34 GIZMOCHINA (CHINA): SWOT ANALYSIS FIGURE 35 VISIC TECHNOLOGIES (ISRAEL): FINANCIAL OVERVIEW SNAPSHOT FIGURE 36 VISIC TECHNOLOGIES (ISRAEL): SWOT ANALYSIS FIGURE 37 KONINKLIJKE PHILIPS N.V. (NETHERLANDS): FINANCIAL OVERVIEW SNAPSHOT FIGURE 38 KONINKLIJKE PHILIPS N.V. (NETHERLANDS): SWOT ANALYSIS FIGURE 39 VINA INTERNATIONAL HOLDINGS LTD. (U.S.): FINANCIAL OVERVIEW SNAPSHOT FIGURE 40 VINA INTERNATIONAL HOLDINGS LTD. (U.S.): SWOT ANALYSIS FIGURE 41 GAN SYSTEMS INC. (CANADA): FINANCIAL OVERVIEW SNAPSHOT FIGURE 42 GAN SYSTEMS INC. (CANADA): SWOT ANALYSIS FIGURE 43 EPIGAN NV (BELGIUM) : FINANCIAL OVERVIEW SNAPSHOT FIGURE 44 EPIGAN NV (BELGIUM) : SWOT ANALYSIS FIGURE 45 NAVITAS SEMICONDUCTOR LTD. (U.S.): FINANCIAL OVERVIEW SNAPSHOT FIGURE 46 NAVITAS SEMICONDUCTOR LTD. (U.S.): SWOT ANALYSIS
    221. List of Tables and Figures
      1. Table FIGURE 1 RESEARCH PROCESS FIGURE 2 MARKET STRUCTURE FOR THE GLOBAL GAN-POWERED CHARGERS MARKET FIGURE 3 MARKET DYNAMICS FOR THE GLOBAL GAN-POWERED CHARGERS MARKET FIGURE 4 GLOBAL GAN-POWERED CHARGERS MARKET, SHARE (%), BY POWER OUTPUT, 2024 FIGURE 5 GLOBAL GAN-POWERED CHARGERS MARKET, SHARE (%), BY APPLICATION, 2024 FIGURE 6 GLOBAL GAN-POWERED CHARGERS MARKET, SHARE (%), BY END USER, 2024 FIGURE 7 GLOBAL GAN-POWERED CHARGERS MARKET, SHARE (%), BY REGION, 2024 FIGURE 8 NORTH AMERICA: GAN-POWERED CHARGERS MARKET, SHARE (%), BY REGION, 2024 FIGURE 9 EUROPE: GAN-POWERED CHARGERS MARKET, SHARE (%), BY REGION, 2024 FIGURE 10 ASIA-PACIFIC: GAN-POWERED CHARGERS MARKET, SHARE (%), BY REGION, 2024 FIGURE 11 REST OF THE WORLD: GAN-POWERED CHARGERS MARKET, SHARE (%), BY REGION, 2024 FIGURE 12 GLOBAL GAN-POWERED CHARGERS MARKET: COMPANY SHARE ANALYSIS, 2024 (%) FIGURE 13 FUJITSU (JAPAN).: FINANCIAL OVERVIEW SNAPSHOT FIGURE 14 FUJITSU (JAPAN).: SWOT ANALYSIS FIGURE 15 TOSHIBA CORPORATION (JAPAN): FINANCIAL OVERVIEW SNAPSHOT FIGURE 16 TOSHIBA CORPORATION (JAPAN): SWOT ANALYSIS FIGURE 17 TEXAS INSTRUMENTS INCORPORATED (U.S.): FINANCIAL OVERVIEW SNAPSHOT FIGURE 18 TEXAS INSTRUMENTS INCORPORATED (U.S.): SWOT ANALYSIS FIGURE 19 CREE LED (U.S.): FINANCIAL OVERVIEW SNAPSHOT FIGURE 20 CREE LED (U.S.): SWOT ANALYSIS FIGURE 21 AIXTRON (GERMANY) .: FINANCIAL OVERVIEW SNAPSHOT FIGURE 22 AIXTRON (GERMANY) .: SWOT ANALYSIS FIGURE 23 MITSUBISHI CHEMICAL CORPORATION (JAPAN): FINANCIAL OVERVIEW SNAPSHOT FIGURE 24 MITSUBISHI CHEMICAL CORPORATION (JAPAN): SWOT ANALYSIS FIGURE 25 EATON (IRELAND): FINANCIAL OVERVIEW SNAPSHOT FIGURE 26 EATON (IRELAND): SWOT ANALYSIS FIGURE 27 SIEMENS (GERMANY): FINANCIAL OVERVIEW SNAPSHOT FIGURE 28 SIEMENS (GERMANY): SWOT ANALYSIS FIGURE 29 BELKIN INTERNATIONAL, INC (U.S.): FINANCIAL OVERVIEW SNAPSHOT FIGURE 30 BELKIN INTERNATIONAL, INC (U.S.): SWOT ANALYSIS FIGURE 31 AUKEY (CHINA): FINANCIAL OVERVIEW SNAPSHOT FIGURE 32 AUKEY (CHINA): SWOT ANALYSIS FIGURE 33 GIZMOCHINA (CHINA): FINANCIAL OVERVIEW SNAPSHOT FIGURE 34 GIZMOCHINA (CHINA): SWOT ANALYSIS FIGURE 35 VISIC TECHNOLOGIES (ISRAEL): FINANCIAL OVERVIEW SNAPSHOT FIGURE 36 VISIC TECHNOLOGIES (ISRAEL): SWOT ANALYSIS FIGURE 37 KONINKLIJKE PHILIPS N.V. (NETHERLANDS): FINANCIAL OVERVIEW SNAPSHOT FIGURE 38 KONINKLIJKE PHILIPS N.V. (NETHERLANDS): SWOT ANALYSIS FIGURE 39 VINA INTERNATIONAL HOLDINGS LTD. (U.S.): FINANCIAL OVERVIEW SNAPSHOT FIGURE 40 VINA INTERNATIONAL HOLDINGS LTD. (U.S.): SWOT ANALYSIS FIGURE 41 GAN SYSTEMS INC. (CANADA): FINANCIAL OVERVIEW SNAPSHOT FIGURE 42 GAN SYSTEMS INC. (CANADA): SWOT ANALYSIS FIGURE 43 EPIGAN NV (BELGIUM) : FINANCIAL OVERVIEW SNAPSHOT FIGURE 44 EPIGAN NV (BELGIUM) : SWOT ANALYSIS FIGURE 45 NAVITAS SEMICONDUCTOR LTD. (U.S.): FINANCIAL OVERVIEW SNAPSHOT FIGURE 46 NAVITAS SEMICONDUCTOR LTD. (U.S.): SWOT ANALYSIS
    222. Table FIGURE 1 RESEARCH PROCESS FIGURE 2 MARKET STRUCTURE FOR THE GLOBAL GAN-POWERED CHARGERS MARKET FIGURE 3 MARKET DYNAMICS FOR THE GLOBAL GAN-POWERED CHARGERS MARKET FIGURE 4 GLOBAL GAN-POWERED CHARGERS MARKET, SHARE (%), BY POWER OUTPUT, 2024 FIGURE 5 GLOBAL GAN-POWERED CHARGERS MARKET, SHARE (%), BY APPLICATION, 2024 FIGURE 6 GLOBAL GAN-POWERED CHARGERS MARKET, SHARE (%), BY END USER, 2024 FIGURE 7 GLOBAL GAN-POWERED CHARGERS MARKET, SHARE (%), BY REGION, 2024 FIGURE 8 NORTH AMERICA: GAN-POWERED CHARGERS MARKET, SHARE (%), BY REGION, 2024 FIGURE 9 EUROPE: GAN-POWERED CHARGERS MARKET, SHARE (%), BY REGION, 2024 FIGURE 10 ASIA-PACIFIC: GAN-POWERED CHARGERS MARKET, SHARE (%), BY REGION, 2024 FIGURE 11 REST OF THE WORLD: GAN-POWERED CHARGERS MARKET, SHARE (%), BY REGION, 2024 FIGURE 12 GLOBAL GAN-POWERED CHARGERS MARKET: COMPANY SHARE ANALYSIS, 2024 (%) FIGURE 13 FUJITSU (JAPAN).: FINANCIAL OVERVIEW SNAPSHOT FIGURE 14 FUJITSU (JAPAN).: SWOT ANALYSIS FIGURE 15 TOSHIBA CORPORATION (JAPAN): FINANCIAL OVERVIEW SNAPSHOT FIGURE 16 TOSHIBA CORPORATION (JAPAN): SWOT ANALYSIS FIGURE 17 TEXAS INSTRUMENTS INCORPORATED (U.S.): FINANCIAL OVERVIEW SNAPSHOT FIGURE 18 TEXAS INSTRUMENTS INCORPORATED (U.S.): SWOT ANALYSIS FIGURE 19 CREE LED (U.S.): FINANCIAL OVERVIEW SNAPSHOT FIGURE 20 CREE LED (U.S.): SWOT ANALYSIS FIGURE 21 AIXTRON (GERMANY) .: FINANCIAL OVERVIEW SNAPSHOT FIGURE 22 AIXTRON (GERMANY) .: SWOT ANALYSIS FIGURE 23 MITSUBISHI CHEMICAL CORPORATION (JAPAN): FINANCIAL OVERVIEW SNAPSHOT FIGURE 24 MITSUBISHI CHEMICAL CORPORATION (JAPAN): SWOT ANALYSIS FIGURE 25 EATON (IRELAND): FINANCIAL OVERVIEW SNAPSHOT FIGURE 26 EATON (IRELAND): SWOT ANALYSIS FIGURE 27 SIEMENS (GERMANY): FINANCIAL OVERVIEW SNAPSHOT FIGURE 28 SIEMENS (GERMANY): SWOT ANALYSIS FIGURE 29 BELKIN INTERNATIONAL, INC (U.S.): FINANCIAL OVERVIEW SNAPSHOT FIGURE 30 BELKIN INTERNATIONAL, INC (U.S.): SWOT ANALYSIS FIGURE 31 AUKEY (CHINA): FINANCIAL OVERVIEW SNAPSHOT FIGURE 32 AUKEY (CHINA): SWOT ANALYSIS FIGURE 33 GIZMOCHINA (CHINA): FINANCIAL OVERVIEW SNAPSHOT FIGURE 34 GIZMOCHINA (CHINA): SWOT ANALYSIS FIGURE 35 VISIC TECHNOLOGIES (ISRAEL): FINANCIAL OVERVIEW SNAPSHOT FIGURE 36 VISIC TECHNOLOGIES (ISRAEL): SWOT ANALYSIS FIGURE 37 KONINKLIJKE PHILIPS N.V. (NETHERLANDS): FINANCIAL OVERVIEW SNAPSHOT FIGURE 38 KONINKLIJKE PHILIPS N.V. (NETHERLANDS): SWOT ANALYSIS FIGURE 39 VINA INTERNATIONAL HOLDINGS LTD. (U.S.): FINANCIAL OVERVIEW SNAPSHOT FIGURE 40 VINA INTERNATIONAL HOLDINGS LTD. (U.S.): SWOT ANALYSIS FIGURE 41 GAN SYSTEMS INC. (CANADA): FINANCIAL OVERVIEW SNAPSHOT FIGURE 42 GAN SYSTEMS INC. (CANADA): SWOT ANALYSIS FIGURE 43 EPIGAN NV (BELGIUM) : FINANCIAL OVERVIEW SNAPSHOT FIGURE 44 EPIGAN NV (BELGIUM) : SWOT ANALYSIS FIGURE 45 NAVITAS SEMICONDUCTOR LTD. (U.S.): FINANCIAL OVERVIEW SNAPSHOT FIGURE 46 NAVITAS SEMICONDUCTOR LTD. (U.S.): SWOT ANALYSIS

    GaN-powered Chargers Market Segmentation

    GaN-powered Chargers Market Power Output Outlook (USD Billion, 2020-2034)

    • 25W GaN Chargers
    • 30W GaN Chargers
    • 45W GaN Chargers
    • 60W GaN Chargers
    • 65W GaN Chargers
    • 90W GaN Chargers
    • 100W GaN Chargers

    GaN-powered Chargers Market Application Outlook (USD Billion, 2020-2034)

    • Smartphones and Tablets
    • Laptops and Notebooks
    • Autonomous Robots
    • Industrial Equipment
    • Wireless Charging

    GaN-powered Chargers Market End User Outlook (USD Billion, 2020-2034)

    • Consumer Electronics
    • IT and Telecommunication
    • Automotive
    • Aerospace and Defense
    • Others

    GaN-powered Chargers Market Regional Outlook (USD Billion, 2020-2034)

    • North America Outlook (USD Billion, 2020-2034)
      • GaN-powered Chargers Market by Power Output
        • 25W GaN Chargers
        • 30W GaN Chargers
        • 45W GaN Chargers
        • 60W GaN Chargers
        • 65W GaN Chargers
        • 90W GaN Chargers
        • 100W GaN Chargers
      • GaN-powered Chargers Market by Application
        • Smartphones and Tablets
        • Laptops and Notebooks
        • Autonomous Robots
        • Industrial Equipment
        • Wireless Charging
      • GaN-powered Chargers Market by End User
        • Consumer Electronics
        • IT and Telecommunication
        • Automotive
        • Aerospace and Defense
        • Others
      • US Outlook (USD Billion, 2020-2034)
      • GaN-powered Chargers Market by Power Output
        • 25W GaN Chargers
        • 30W GaN Chargers
        • 45W GaN Chargers
        • 60W GaN Chargers
        • 65W GaN Chargers
        • 90W GaN Chargers
        • 100W GaN Chargers
      • GaN-powered Chargers Market by Application
        • Smartphones and Tablets
        • Laptops and Notebooks
        • Autonomous Robots
        • Industrial Equipment
        • Wireless Charging
      • GaN-powered Chargers Market by End User
        • Consumer Electronics
        • IT and Telecommunication
        • Automotive
        • Aerospace and Defense
        • Others
      • Canada Outlook (USD Billion, 2020-2034)
      • GaN-powered Chargers Market by Power Output
        • 25W GaN Chargers
        • 30W GaN Chargers
        • 45W GaN Chargers
        • 60W GaN Chargers
        • 65W GaN Chargers
        • 90W GaN Chargers
        • 100W GaN Chargers
      • GaN-powered Chargers Market by Application
        • Smartphones and Tablets
        • Laptops and Notebooks
        • Autonomous Robots
        • Industrial Equipment
        • Wireless Charging
      • GaN-powered Chargers Market by End User
        • Consumer Electronics
        • IT and Telecommunication
        • Automotive
        • Aerospace and Defense
        • Others
    • Europe Outlook (USD Billion, 2020-2034)
      • GaN-powered Chargers Market by Power Output
        • 25W GaN Chargers
        • 30W GaN Chargers
        • 45W GaN Chargers
        • 60W GaN Chargers
        • 65W GaN Chargers
        • 90W GaN Chargers
        • 100W GaN Chargers
      • GaN-powered Chargers Market by Application
        • Smartphones and Tablets
        • Laptops and Notebooks
        • Autonomous Robots
        • Industrial Equipment
        • Wireless Charging
      • GaN-powered Chargers Market by End User
        • Consumer Electronics
        • IT and Telecommunication
        • Automotive
        • Aerospace and Defense
        • Others
      • Germany Outlook (USD Billion, 2020-2034)
      • GaN-powered Chargers Market by Power Output
        • 25W GaN Chargers
        • 30W GaN Chargers
        • 45W GaN Chargers
        • 60W GaN Chargers
        • 65W GaN Chargers
        • 90W GaN Chargers
        • 100W GaN Chargers
      • GaN-powered Chargers Market by Application
        • Smartphones and Tablets
        • Laptops and Notebooks
        • Autonomous Robots
        • Industrial Equipment
        • Wireless Charging
      • GaN-powered Chargers Market by End User
        • Consumer Electronics
        • IT and Telecommunication
        • Automotive
        • Aerospace and Defense
        • Others
      • France Outlook (USD Billion, 2020-2034)
      • GaN-powered Chargers Market by Power Output
        • 25W GaN Chargers
        • 30W GaN Chargers
        • 45W GaN Chargers
        • 60W GaN Chargers
        • 65W GaN Chargers
        • 90W GaN Chargers
        • 100W GaN Chargers
      • GaN-powered Chargers Market by Application
        • Smartphones and Tablets
        • Laptops and Notebooks
        • Autonomous Robots
        • Industrial Equipment
        • Wireless Charging
      • GaN-powered Chargers Market by End User
        • Consumer Electronics
        • IT and Telecommunication
        • Automotive
        • Aerospace and Defense
        • Others
      • UK Outlook (USD Billion, 2020-2034)
      • GaN-powered Chargers Market by Power Output
        • 25W GaN Chargers
        • 30W GaN Chargers
        • 45W GaN Chargers
        • 60W GaN Chargers
        • 65W GaN Chargers
        • 90W GaN Chargers
        • 100W GaN Chargers
      • GaN-powered Chargers Market by Application
        • Smartphones and Tablets
        • Laptops and Notebooks
        • Autonomous Robots
        • Industrial Equipment
        • Wireless Charging
      • GaN-powered Chargers Market by End User
        • Consumer Electronics
        • IT and Telecommunication
        • Automotive
        • Aerospace and Defense
        • Others
      • Italy Outlook (USD Billion, 2020-2034)
      • GaN-powered Chargers Market by Power Output
        • 25W GaN Chargers
        • 30W GaN Chargers
        • 45W GaN Chargers
        • 60W GaN Chargers
        • 65W GaN Chargers
        • 90W GaN Chargers
        • 100W GaN Chargers
      • GaN-powered Chargers Market by Application
        • Smartphones and Tablets
        • Laptops and Notebooks
        • Autonomous Robots
        • Industrial Equipment
        • Wireless Charging
      • GaN-powered Chargers Market by End User
        • Consumer Electronics
        • IT and Telecommunication
        • Automotive
        • Aerospace and Defense
        • Others
      • Spain Outlook (USD Billion, 2020-2034)
      • GaN-powered Chargers Market by Power Output
        • 25W GaN Chargers
        • 30W GaN Chargers
        • 45W GaN Chargers
        • 60W GaN Chargers
        • 65W GaN Chargers
        • 90W GaN Chargers
        • 100W GaN Chargers
      • GaN-powered Chargers Market by Application
        • Smartphones and Tablets
        • Laptops and Notebooks
        • Autonomous Robots
        • Industrial Equipment
        • Wireless Charging
      • GaN-powered Chargers Market by End User
        • Consumer Electronics
        • IT and Telecommunication
        • Automotive
        • Aerospace and Defense
        • Others
      • Rest Of Europe Outlook (USD Billion, 2020-2034)
      • GaN-powered Chargers Market by Power Output
        • 25W GaN Chargers
        • 30W GaN Chargers
        • 45W GaN Chargers
        • 60W GaN Chargers
        • 65W GaN Chargers
        • 90W GaN Chargers
        • 100W GaN Chargers
      • GaN-powered Chargers Market by Application
        • Smartphones and Tablets
        • Laptops and Notebooks
        • Autonomous Robots
        • Industrial Equipment
        • Wireless Charging
      • GaN-powered Chargers Market by End User
        • Consumer Electronics
        • IT and Telecommunication
        • Automotive
        • Aerospace and Defense
        • Others
    • Asia-Pacific Outlook (USD Billion, 2020-2034)
      • GaN-powered Chargers Market by Power Output
        • 25W GaN Chargers
        • 30W GaN Chargers
        • 45W GaN Chargers
        • 60W GaN Chargers
        • 65W GaN Chargers
        • 90W GaN Chargers
        • 100W GaN Chargers
      • GaN-powered Chargers Market by Application
        • Smartphones and Tablets
        • Laptops and Notebooks
        • Autonomous Robots
        • Industrial Equipment
        • Wireless Charging
      • GaN-powered Chargers Market by End User
        • Consumer Electronics
        • IT and Telecommunication
        • Automotive
        • Aerospace and Defense
        • Others
      • China Outlook (USD Billion, 2020-2034)
      • GaN-powered Chargers Market by Power Output
        • 25W GaN Chargers
        • 30W GaN Chargers
        • 45W GaN Chargers
        • 60W GaN Chargers
        • 65W GaN Chargers
        • 90W GaN Chargers
        • 100W GaN Chargers
      • GaN-powered Chargers Market by Application
        • Smartphones and Tablets
        • Laptops and Notebooks
        • Autonomous Robots
        • Industrial Equipment
        • Wireless Charging
      • GaN-powered Chargers Market by End User
        • Consumer Electronics
        • IT and Telecommunication
        • Automotive
        • Aerospace and Defense
        • Others
      • Japan Outlook (USD Billion, 2020-2034)
      • GaN-powered Chargers Market by Power Output
        • 25W GaN Chargers
        • 30W GaN Chargers
        • 45W GaN Chargers
        • 60W GaN Chargers
        • 65W GaN Chargers
        • 90W GaN Chargers
        • 100W GaN Chargers
      • GaN-powered Chargers Market by Application
        • Smartphones and Tablets
        • Laptops and Notebooks
        • Autonomous Robots
        • Industrial Equipment
        • Wireless Charging
      • GaN-powered Chargers Market by End User
        • Consumer Electronics
        • IT and Telecommunication
        • Automotive
        • Aerospace and Defense
        • Others
      • India Outlook (USD Billion, 2020-2034)
      • GaN-powered Chargers Market by Power Output
        • 25W GaN Chargers
        • 30W GaN Chargers
        • 45W GaN Chargers
        • 60W GaN Chargers
        • 65W GaN Chargers
        • 90W GaN Chargers
        • 100W GaN Chargers
      • GaN-powered Chargers Market by Application
        • Smartphones and Tablets
        • Laptops and Notebooks
        • Autonomous Robots
        • Industrial Equipment
        • Wireless Charging
      • GaN-powered Chargers Market by End User
        • Consumer Electronics
        • IT and Telecommunication
        • Automotive
        • Aerospace and Defense
        • Others
      • Australia Outlook (USD Billion, 2020-2034)
      • GaN-powered Chargers Market by Power Output
        • 25W GaN Chargers
        • 30W GaN Chargers
        • 45W GaN Chargers
        • 60W GaN Chargers
        • 65W GaN Chargers
        • 90W GaN Chargers
        • 100W GaN Chargers
      • GaN-powered Chargers Market by Application
        • Smartphones and Tablets
        • Laptops and Notebooks
        • Autonomous Robots
        • Industrial Equipment
        • Wireless Charging
      • GaN-powered Chargers Market by End User
        • Consumer Electronics
        • IT and Telecommunication
        • Automotive
        • Aerospace and Defense
        • Others
      • Rest of Asia-Pacific Outlook (USD Billion, 2020-2034)
      • GaN-powered Chargers Market by Power Output
        • 25W GaN Chargers
        • 30W GaN Chargers
        • 45W GaN Chargers
        • 60W GaN Chargers
        • 65W GaN Chargers
        • 90W GaN Chargers
        • 100W GaN Chargers
      • GaN-powered Chargers Market by Application
        • Smartphones and Tablets
        • Laptops and Notebooks
        • Autonomous Robots
        • Industrial Equipment
        • Wireless Charging
      • GaN-powered Chargers Market by End User
        • Consumer Electronics
        • IT and Telecommunication
        • Automotive
        • Aerospace and Defense
        • Others
    • Rest of the World Outlook (USD Billion, 2020-2034)
      • GaN-powered Chargers Market by Power Output
        • 25W GaN Chargers
        • 30W GaN Chargers
        • 45W GaN Chargers
        • 60W GaN Chargers
        • 65W GaN Chargers
        • 90W GaN Chargers
        • 100W GaN Chargers
      • GaN-powered Chargers Market by Application
        • Smartphones and Tablets
        • Laptops and Notebooks
        • Autonomous Robots
        • Industrial Equipment
        • Wireless Charging
      • GaN-powered Chargers Market by End User
        • Consumer Electronics
        • IT and Telecommunication
        • Automotive
        • Aerospace and Defense
        • Others
      • Middle East Outlook (USD Billion, 2020-2034)
      • GaN-powered Chargers Market by Power Output
        • 25W GaN Chargers
        • 30W GaN Chargers
        • 45W GaN Chargers
        • 60W GaN Chargers
        • 65W GaN Chargers
        • 90W GaN Chargers
        • 100W GaN Chargers
      • GaN-powered Chargers Market by Application
        • Smartphones and Tablets
        • Laptops and Notebooks
        • Autonomous Robots
        • Industrial Equipment
        • Wireless Charging
      • GaN-powered Chargers Market by End User
        • Consumer Electronics
        • IT and Telecommunication
        • Automotive
        • Aerospace and Defense
        • Others
      • Africa Outlook (USD Billion, 2020-2034)
      • GaN-powered Chargers Market by Power Output
        • 25W GaN Chargers
        • 30W GaN Chargers
        • 45W GaN Chargers
        • 60W GaN Chargers
        • 65W GaN Chargers
        • 90W GaN Chargers
        • 100W GaN Chargers
      • GaN-powered Chargers Market by Application
        • Smartphones and Tablets
        • Laptops and Notebooks
        • Autonomous Robots
        • Industrial Equipment
        • Wireless Charging
      • GaN-powered Chargers Market by End User
        • Consumer Electronics
        • IT and Telecommunication
        • Automotive
        • Aerospace and Defense
        • Others
      • Latin America Outlook (USD Billion, 2020-2034)
      • GaN-powered Chargers Market by Power Output
        • 25W GaN Chargers
        • 30W GaN Chargers
        • 45W GaN Chargers
        • 60W GaN Chargers
        • 65W GaN Chargers
        • 90W GaN Chargers
        • 100W GaN Chargers
      • GaN-powered Chargers Market by Application
        • Smartphones and Tablets
        • Laptops and Notebooks
        • Autonomous Robots
        • Industrial Equipment
        • Wireless Charging
      • GaN-powered Chargers Market by End User
        • Consumer Electronics
        • IT and Telecommunication
        • Automotive
        • Aerospace and Defense
        • Others
    Infographic

    Free Sample Request

    Kindly complete the form below to receive a free sample of this Report

    Get Free Sample

    Customer Strories

    “I am very pleased with how market segments have been defined in a relevant way for my purposes (such as "Portable Freezers & refrigerators" and "last-mile"). In general the report is well structured. Thanks very much for your efforts.”

    Victoria Milne

    Founder
    Case Study
    Chemicals and Materials