• Cat-intel
  • MedIntelliX
  • Resources
  • About Us
  • English
    Chinese
    French
    Japanese
    Korean
    German
    Spanish

    E Visa Market Share

    ID: MRFR/ICT/7299-CR
    128 Pages
    Shubham Munde
    January 2024

    E-Visa Market Research Report By Component (Software and Services), by Application (Travelling, Students/Educational Visa, Government/Foreign Affairs and Others), by Platform (Desktop, Smartphone and Tablets), and By Region (North America, Europe, Asia-Pacific, Middle East and Africa, South America) – Market Forecast Till 2032

    Share:
    Download PDF ×

    We do not share your information with anyone. However, we may send you emails based on your report interest from time to time. You may contact us at any time to opt-out.

    E-Visa Market Research Report — Global Forecast till 2032 Infographic
    $ 4,950.0
    $ 5,950.0
    $ 7,250.0

    Market Share

    E Visa Market Share Analysis

    In the E-Visa market, businesses and governments need good strategies to get big parts of it. One important plan is to create easy-to-use and smart screens for applying E-Visas. Businesses that make it easy to use and reach their online services win by getting more job requests. They also put themselves in a good spot as top providers of stress-free electronic visas work. This plan goes along with the bigger idea of turning things digital, where giving a good experience to users is very important. Working with travel service providers is another big way to set a good position in the E-Visa market. By combining their E-Visa services with other travel features like booking flights, making hotel reservations and arranging transportation, firms can give a fully smooth journey experience. This plan makes it easier for customers and helps travel guides offer complete solutions, getting a bigger part of the market. Using top-notch ID checking tools is an important plan in the E-Visa market.

    Companies and governments that spend money on high-tech security measures like facial recognition or fingerprint scanning make their E-Visa systems safer and more trustworthy. This plan not only helps with worries about fake identity but also gives trust to people who want jobs and governments too. Being first in checking identity with new technologies makes the eVisa market players leaders. They make sure electronic visa processes are honest and safe. Real-time communication and updates make for a plan that meets customer needs in the E-Visa market. Giving people who apply for a visa live updates and messages about their application makes things clearer. This also increases belief in the process.

    Businesses that focus on good communication during job applications put themselves in a customer-focused way. They answer the growing need for showing what is happening and being quick with electronic visa services. Plans that focus on health and safety are becoming more popular in the E-Visa market. With the COVID-19 pandemic affecting everyone, companies and governments that include health rules like vaccine proof or negative test results in their E-Visa processes show they are changing with time. They also care about people's health problems. This plan matches up with the current world health situation and strengthens the promise to keep travelers safe as well host communities.

    Market Summary

    As per Market Research Future Analysis, the E-Visa Market was valued at USD 933.4 million in 2023 and is projected to grow to USD 2,395.2 million by 2032, reflecting a CAGR of 11.1% from 2024 to 2032. The market is driven by increasing international travel, government initiatives for e-visa systems, and technological advancements such as biometric authentication. The demand for e-visas is rising due to their efficiency compared to traditional visa processes, which are often time-consuming. The market is characterized by a competitive landscape with various global and regional players focusing on enhancing their service offerings.

    Key Market Trends & Highlights

    Key trends driving the E-Visa Market include advancements in technology and increasing travel demand.

    • E-Visa Market Size in 2023: USD 933.4 million.
    • Projected Market Size by 2032: USD 2,395.2 million.
    • CAGR during 2024-2032: 11.1%.
    • Largest Market Share in 2023: Travelling visas.

    Market Size & Forecast

    2023 Market Size USD 933.4 million
    2024 Market Size USD 1,030.5 million
    2032 Market Size USD 2,395.2 million
    CAGR (2024-2032) 11.1%.

    Major Players

    Mühlbauer Group, BLS International, Scicom (MSC) Bhd, Canadian Bank Note Company, Limited (CBN), Cserve Technologies, IVisa.com, VisaHQ, Travisa Visa Service Inc., ItsEasy Passport & Visa Services, Gemalto N V, 4G Identity Solutions Pvt. Ltd, VFS Global, Securiport LLC, Swiss Authentis S.A.

    Market Trends

    INCREASING INTERNATIONAL TRAVEL AND TOURISM

    International travel has become cheaper and therefore more easily accessible. As a result, the demand for visas is rising. These e-visas meet this demand by providing an easy process of obtaining your necessary papers in a prompt and efficient manner. This may be compared to traditional visa application processes that are time-consuming as well as hindrances to would-be travelers. So that people apply easily, e-Visas simplify the process by minimizing paperwork, processing time, visiting embassies or consulates during applications. All these make it easier to travel thus making people want more visas.

    The rise in travelers implies that there is an increasing market for e-visa services. Governments and service providers can take advantage of this growth by expanding their e-visa offerings, investing in information technology infrastructure and enhancing user experiences to meet diverse traveler needs. Additional revenue can be obtained through governments collecting visa fees from more individuals who choose e-visas for purposes of travelling abroad. The income generated from electronic visa applications contributes to national economies, finance infrastructural developments and support tourism-based projects.

    Advanced border security measures can use digital visas that have biometric authentication and data encryption. This further strengthens the visa system aimed at provoking trust between the government and potential travelers, hence increasing international travel. Countries can also use e-visa systems as part of their broader tourism promotion strategy. As a result, there will be more tourists in such reciprocating countries thus giving away more incomes and spending on accommodation, meals, transport and attraction sites. Governments can gain extra income from visa fees if there are more travelers choosing e-visa option for traveling.

    Thus, governments should consider using this revenue to finance infrastructure improvements, projects connected with tourism development, or other national needs.

    The global e-visa market is poised for expansion as governments increasingly adopt digital solutions to streamline travel processes and enhance security measures.

    U.S. Department of State

    E Visa Market Market Drivers

    Market Growth Projections

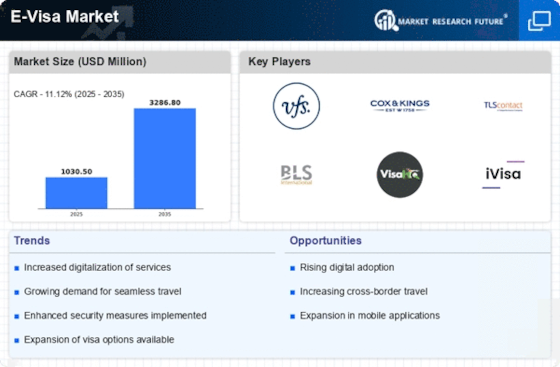
    The Global E-Visa Market Industry is projected to experience substantial growth over the next decade. With a current valuation of 1.03 USD Billion in 2024, the market is expected to reach 3.28 USD Billion by 2035. This growth trajectory indicates a robust compound annual growth rate (CAGR) of 11.11% from 2025 to 2035. Such projections highlight the increasing reliance on digital solutions for visa processing and the ongoing trend towards globalization. As more countries implement e-visa systems, the market is likely to expand, driven by technological advancements and changing traveler preferences.

    Increasing Global Travel Demand

    The Global E-Visa Market Industry is experiencing a surge in demand due to the increasing number of international travelers. In 2024, the market is valued at approximately 1.03 USD Billion, reflecting a growing trend towards digital solutions for visa processing. As countries aim to streamline entry processes, e-visas offer a convenient alternative to traditional visa applications. This shift is particularly evident in regions with high tourism potential, where governments are adopting e-visa systems to attract more visitors. The ease of obtaining an e-visa is likely to encourage travel, further boosting the market's growth.

    Government Initiatives and Policy Support

    Government initiatives aimed at promoting tourism and simplifying visa processes are driving the Global E-Visa Market Industry. Many countries are implementing policies that encourage the adoption of e-visas, recognizing their potential to boost economic growth through increased tourism. For example, nations like India and Australia have expanded their e-visa programs, making it easier for travelers to visit. Such initiatives not only facilitate smoother entry for tourists but also generate revenue for governments. As more countries recognize the benefits of e-visas, the market is expected to grow, potentially reaching 3.28 USD Billion by 2035.

    Growing Awareness and Acceptance of E-Visas

    As travelers become more familiar with e-visas, the Global E-Visa Market Industry is witnessing a shift in acceptance and usage. Increased awareness campaigns by governments and travel agencies are educating potential travelers about the benefits of e-visas, such as convenience and faster processing times. This growing acceptance is particularly evident in regions where e-visas are newly introduced. As more travelers opt for e-visas over traditional visas, the market is likely to expand. The trend suggests a promising future for the e-visa sector, with the potential for significant growth as more countries adopt these systems.

    Technological Advancements in Visa Processing

    Technological innovations are playing a pivotal role in the expansion of the Global E-Visa Market Industry. Enhanced digital platforms and secure online payment systems are making it easier for travelers to apply for visas. Governments are increasingly investing in technology to improve the efficiency and security of e-visa applications. For instance, biometric verification and AI-driven processing systems are being integrated into e-visa frameworks. These advancements not only enhance user experience but also reduce processing times, making e-visas a more attractive option for travelers. As a result, the market is projected to grow significantly, with a CAGR of 11.11% from 2025 to 2035.

    Rising Security Concerns and Compliance Requirements

    The Global E-Visa Market Industry is also influenced by rising security concerns and the need for compliance with international regulations. Governments are increasingly focused on ensuring the safety of their borders while facilitating legitimate travel. E-visas provide a mechanism for enhanced scrutiny of applicants, allowing for better tracking and verification of travelers. This focus on security is likely to drive the adoption of e-visa systems, as they can incorporate advanced security features such as biometric data and real-time monitoring. Consequently, the market is poised for growth as countries prioritize both security and efficiency in their visa processes.

    Market Segment Insights

    E-Visa Component Insights

    Based on component, the E-Visa Market has been segmented into Services and Software. E-Visa software solutions are varied and are designed to meet the needs of different users, from government agencies to travel companies to individuals. These software solutions help streamline the E-Visa application process, increase efficiency and accuracy, and enhance security. Also, the software systems used by government agencies and to manage passport applications and issue passports. They automate the process of verifying passport eligibility, collecting application fees, and processing passport applications.

    FIGURE 2: E-VISA MARKET, BY COMPONENT, 2023 VS 2032 (USD MILLION)

    Source: Secondary Research, Primary Research, Market Research Future Database, and Analyst Review

    E-Visa Application Insights

    Based on Application, the E-Visa Market has been segmented into travelling, students/educational visa, government/foreign affairs, and others. In 2023, travelling accounted for the largest market share. The demand for travelling visas and passports is an important indicator of international travel trends and can be influenced by various factors, including global pandemics, political and economic situations, and international relations.

    In general, the demand for travelling visas and passports has been impacted by the COVID-19 pandemic. Many countries have implemented travel restrictions and border closures to control the spread of the virus, which has greatly reduced the demand for these documents. The World Tourism Organization reported that in 2020, international tourist arrivals decreased by 74% compared to the previous year, representing a loss of approximately one billion arrivals. This decrease in tourism has had a significant impact on the demand for travelling visas and passports.

    E-Visa Platform

    Based on Platform, the E-Visa Market has been segmented into Desktop, Smartphone, and Tablets. Desktop accounted for the largest share in E-Visa Market in 2023. Desktop devices have been the most utilized devices in the past when using online services and the same applies to the e-visa market. The majority of e-visas are still applied using a desktop computer although they are also applied using notebook computers, tablet computers or smart phones because the former has a larger screen and more comfortable keyboard.

    Also, numerous users believe that they are safe using their desktops to carry out sensitive activities such as submission of visa applications. But the use of desktop devices in the application of e-visa is expected to reduce in the coming years. This is because Smartphone and Tablets are now on the rise, and they are much more portable than the PCs. Also, the increased number of countries that provide mobile-friendly e-visa applications help the users to apply for a visa while using a smartphone or a tablet.

    Get more detailed insights about E-Visa Market Research Report — Global Forecast till 2032

    Regional Insights

    By Region, the study provides market insights into North America, Europe, Asia-Pacific, Middle East and Africa and South America. North America consists of the U.S, Canada, and Mexico. The E-Visa market in North America is growing due to high flow of traffic both within and from the region. North America is made up of many countries among them being U.S, Canada and Mexico all of which have different E-Visa requirements.

    The global market for visas and passports is dominated by the United States; millions of people apply for different types of visas, such as tourist, working and student visas. The U. S. passport is also one of the most secure passports in the world allowing entry to 186 countries without a visa or with a visa on arrival.

    The Asia Pacific region is a big consumer of E-Visa due to high traffic of people traveling to and from the region and hence is a big market. The Asia Pacific region is made up of many countries and each of these countries has its own E-Visa requirements. China is among the largest visa and passport markets in the region, with millions of persons applying for the different types of visas such as tourist, work, and student visas yearly. The Chinese passport is also strengthening and is now within the list of the world’s 70 most powerful passports.

    More advanced countries in the region are for instance Japan, South Korea and Australia that have highly developed E-Visa markets. Japan currently possesses one of the strongest passports in the world, with visa-free or visa on arrival to more than 190 countries. South Korea has made visa application easy, and it has many categories of visa such as business visa, work visa, and student visa among others. Australia has a fairly developed E-Visa system, and it has several types of visas for tourists, employment, and students.

    There are also several new opportunities for visas and passports in the region including the Indian and Indonesian markets. Both countries are populated and are investing in infrastructure to fasten the E-Visa application processes.

    Europe region consists of UK, Germany, France, Rest of Europe for the study. The market for E-Visas in Europe is large, as the continent is a popular area for travel and immigration. Europe is made up of so many countries, and each country has its own stringent E-Visa requirements. The market most affected by visas and passports in Europe is the European Union or the EU as it is commonly known. Citizens of the member states can move within the member states without a visa and the EU passport is recognized in most countries of the world.

    As for the citizens of the countries which are not the members of the EU it is necessary to obtain a Schengen visa in order to visit the EU for such purposes as business or tourism, and the procedure may differ.

    FIGURE 3: E-VISA MARKET SIZE BY REGION 2023 VS 2032

    E-VISA MARKET SIZE BY REGION 2023 VS 2032

    Source: Secondary Research, Primary Research, Market Research Future Database, and Analyst Review

    Further, the major countries studied in the market report are the U.S., Canada, Mexico, Germany, UK, France, Italy, Spain, China, Japan, and India.

    Key Players and Competitive Insights

    The E-Visa Market is characterized by the presence of many global, regional, and local vendors. The regional market is highly competitive, with all the players continually competing to gain a larger market share. The vendors compete based on reliability, cost, product quality, and aftermarket services. Therefore, vendors must provide cost-effective and efficient products to survive and succeed in a competitive market environment.

    The growth of the vendors is dependent on market conditions, government support, and industrial development. Thus, the vendors should focus on expanding their presence and improving their services. According to MRFR analysis, the growth of the E-Visa Market is dependent on market conditions.

    The growth of the vendors is dependent on market conditions, and industrial development. Thus, the vendors should focus on expanding their presence and improving their services. According to MRFR analysis, major players in the E-Visa Market have contributed to the market growth. These include Mühlbauer Group, BLS International, Scicom (MSC) Bhd, Canadian Bank Note Company, Limited (CBN), Cserve Technologies, IVisa.com, VisaHQ, Travisa Visa Service Inc., ItsEasy Passport & Visa Services, Gemalto N V, 4G Identity Solutions Pvt. Ltd, VFS Global, Securiport LLC, Swiss Authentis S.A are among the top players in E-Visa Market.

    These players focus on expanding and enhancing their product portfolio and services to remain competitive and increase their customers.

    Key Companies in the E Visa Market market include

    Industry Developments

      • In June 2023, BLS International Services Ltd. signed a contract with the Embassy of Italy in Kazakhstan to improve and simplify the process of visa application for individuals traveling to Italy from Kazakhstan. BLS International will open five visa application centers across Kazakhstan, handling 25,000 visa applications annually, and offering end-to-end visa processing solutions, including application submission, biometric data collection, and applicant support.
      • In October 2023, iVisa has partnered with travel partners to provide worldwide tourism visas for any travel agent. The aim of this partnership is to give travel agents the flexibility to set up built-in options allowing them to fully customize the system to their needs.

    Future Outlook

    E Visa Market Future Outlook

    The Global E-Visa Market is projected to grow at an 11.11% CAGR from 2024 to 2035, driven by digital transformation, increased travel demand, and enhanced security measures.

    New opportunities lie in:

    • Develop AI-driven platforms for personalized visa application processes.
    • Expand partnerships with governments to streamline e-visa issuance.
    • Invest in cybersecurity solutions to protect sensitive applicant data.

    By 2035, the E-Visa Market is expected to be robust, reflecting significant advancements in technology and user experience.

    Market Segmentation

    E-Visa Platform Outlook

    • Desktop
    • Smartphone
    • Tablets

    E-Visa Regional Outlook

    • US

    E-Visa Component Outlook

    • Software
    • Services

    E-Visa Application Outlook

    • Travelling
    • Students/Educational Visa
    • Government/Foreign Affairs
    • Others

    Report Scope

    Report Attribute/Metric Details
    Market Size 2023 USD 933.4 million
    Market Size 2024 USD 1,030.5 million
    Market Size 2032 USD 2,395.2 million
    Compound Annual Growth Rate (CAGR) 11.1 % (2024-2032)
    Base Year 2023
    Market Forecast Period 2024-2032
    Historical Data 2019- 2022
    Market Forecast Units Value (USD Million)
    Report Coverage Revenue Forecast, Market Competitive Landscape, Growth Factors, and Trends
    Segments Covered Component, Application, Platform and Region
    Geographies Covered Europe, North America, Asia-Pacific, Middle East & Africa, and South America
    Countries Covered US, Canada, Mexico, Germany, U.K., Italy, France, Japan, China, India, South Korea, Saudi Arabia, UAE, South Africa Brazil, Argentina, and Others.
    Key Companies Profiled ·       Mühlbauer Group ·       BLS International ·       Scicom (MSC) Bhd ·       Canadian Bank Note Company, Limited (CBN) ·       Cserve Technologies ·       IVisa.com ·       VisaHQ ·       Travisa Visa Service Inc. ·       ItsEasy Passport & Visa Services ·       Gemalto N V ·       4G Identity Solutions Pvt. Ltd ·       VFS Global ·       Securiport LLC ·       Swiss Authentis S.A ·       Others
    Key Market Opportunities ·       Increasing International Travel and Tourism ·       Flexibility and Scalability to Meet Changing Needs
    Key Market Dynamics ·       Demand From Emerging Economies ·       Offering Value-Added Services to Clients

    Market Highlights

    Author

    Shubham Munde
    Research Analyst Level II

    She holds an experience of about 6+ years in market research and business consulting, working under the spectrum of information communication technology, telecommunications and semiconductor domains. aarti conceptualizes and implements a scalable business strategy and provides strategic leadership to the clients. her expertise lies in market estimation, competitive intelligence, pipeline analysis, customer assessment, etc.

    Leave a Comment

    Latest Comments

    John Doe

    This is a great article! Really helped me understand the topic better.

    Posted on July 23, 2025, 10:15 AM
    Jane Smith

    Thanks for sharing this. I’ve bookmarked it for later reference.

    Posted on July 22, 2025, 7:45 PM

    FAQs

    How much is the E-Visa Market?

    The E-Visa Market size is expected to be valued at USD 933.4 Million in 2023.

    What is the growth rate of the E-Visa Market?

    The global market is projected to grow at a CAGR of 11.1% during the forecast period, 2024-2032.

    Which region held the largest market share in the E-Visa Market?

    Asia-Pacific had the largest share of the global market.

    Who are the key players in the E-Visa Market?

    The key players in the market are Mühlbauer Group, BLS International, Scicom (MSC) Bhd, Canadian Bank Note Company, Limited (CBN), Cserve Technologies, IVisa.com, VisaHQ, Travisa Visa Service Inc., ItsEasy Passport & Visa Services, Gemalto N V, 4G Identity Solutions Pvt. Ltd, VFS Global and Others.

    Which Component led the E-Visa Market?

    The software type dominated the market in 2023.

    1. 'TABLE OF CONTENTS
    2. EXECUTIVE SUMMARY 14
      1. MARKET ATTRACTIVENESS
    3. ANALYSIS 16
    4. MARKET INTRODUCTION 17
    5. DEFINITION 17
    6. SCOPE OF THE STUDY 17
    7. RESEARCH OBJECTIVE 17
    8. MARKET STRUCTURE 17
    9. RESEARCH METHODOLOGY 19
    10. MARKET DYNAMICS 26
      1. INTRODUCTION 26
      2. DRIVERS 27
        1. INCREASING INTERNATIONAL TRAVEL AND TOURISM 27
        2. FLEXIBILITY AND SCALABILITY
    11. TO MEET CHANGING NEEDS 27
      1. GOVERNMENT INITIATIVES FOCUSING ON THE IMPLEMENTATION OF E-VISA
    12. SYSTEMS TO ENHANCE USER EXPERIENCE IN RECENT PAST 28
      1. DRIVERS IMPACT ANALYSIS 29
      2. RESTRAINTS 29
        1. GOVERNMENT AGENCIES DEVELOPING
    13. THEIR OWN E-VISA SOLUTIONS TO CAUSE RESTRAIN FOR GROWTH OF PRIVATE PLAYERS 29
      1. NATIONAL SECURITY
    14. AND COMPLIANCE WITH INTERNATIONAL LAW COUPLED WITH TECHNICAL REQUIREMENTS TO RESTRICT
    15. GROWTH OF MARKET IN TARGETED ECONOMIES 30
      1. OPPORTUNITIES 31
        1. DEMAND FROM EMERGING ECONOMIES 31
        2. OFFERING VALUE-ADDED
    16. SERVICES TO CLIENTS 32
    17. IMPACT ANALYSIS OF COVID-19 32
      1. COVID 19 IMPACT ON TRAVEL INDUSTRY 32
        1. INCREASING NEED FOR "ONLINE" VISA PROCESS ACROSS
    18. THE GLOBE 33
    19. COVID 19 IMPACT ON OVERALL MARKET Y-O-Y IN 2020-2022 33
      1. VACCINATION REQUIREMENTS 34
    20. MARKET FACTOR ANALYSIS 35
      1. VALUE CHAIN ANALYSIS
      2. PORTER''S
    21. FIVE FORCES MODEL 36
    22. THREAT OF NEW ENTRANTS 37
      1. BARGAINING POWER OF SUPPLIERS 37
        1. THREAT OF SUBSTITUTES 38
        2. BARGAINING POWER OF BUYERS
        3. INTENSITY
    23. OF RIVALRY 39
    24. GLOBAL E-VISA OFFERING ANALYSIS 39
    25. GLOBAL E-VISA MARKET, BY COMPONENT 40
      1. OVERVIEW 40
        1. GLOBAL E-VISA MARKET, BY
    26. COMPONENT, 2019–2032 (USD MILLION) 41
      1. SOFTWARE 41
      2. SERVICES 42
    27. GLOBAL E-VISA MARKET, BY APPLICATION 43
      1. OVERVIEW 43
        1. GLOBAL E-VISA MARKET,
    28. BY APPLICATION, 2019–2032 (USD MILLION) 44
      1. TRAVELLING 44
      2. STUDENTS/EDUCATIONAL VISA 44
      3. GOVERNMENT/FOREIGN AFFAIRS
      4. OTHERS
    29. GLOBAL
    30. E-VISA MARKET, BY PLATFORM 46
      1. OVERVIEW 46
        1. GLOBAL E-VISA MARKET, BY PLATFORM, 2019–2032 (USD MILLION)
      2. DESKTOP
      3. SMARTHONE
      4. TABLETS
    31. GLOBAL
    32. E-VISA MARKET, BY REGION 48
      1. OVERVIEW 48
        1. GLOBAL E-VISA MARKET, BY REGION, 2023 VS 2032 (USD MILLION) 48
        2. GLOBAL E-VISA MARKET,
    33. BY REGION, 2019–2032 (USD MILLION) 49
      1. NORTH AMERICA 49
        1. NORTH AMERICA: E-VISA MARKET, BY COUNTRY, 2019–2032
    34. (USD MILLION) 51
    35. NORTH AMERICA E-VISA MARKET, BY COMPONENT, 2019–2032 (USD MILLION) 51
      1. NORTH AMERICA E-VISA
    36. MARKET, BY APPLICATION, 2019–2032 (USD MILLION) 52
      1. NORTH AMERICA E-VISA MARKET, BY PLATFORM, 2019–2032
    37. (USD MILLION) 53
    38. US 54
    39. US E-VISA MARKET, BY COMPONENT, 2019–2032 (USD MILLION) 54
      1. US E-VISA MARKET, BY
    40. APPLICATION, 2019–2032 (USD MILLION) 54
      1. US E-VISA MARKET, BY PLATFORM, 2019–2032
    41. (USD MILLION) 54
    42. CANADA 55
    43. CANADA E-VISA MARKET, BY COMPONENT, 2019–2032 (USD MILLION) 55
      1. CANADA E-VISA MARKET,
    44. BY APPLICATION, 2019–2032 (USD MILLION) 55
      1. CANADA E-VISA MARKET, BY PLATFORM, 2019–2032
    45. (USD MILLION) 55
    46. MEXICO 56
    47. MEXICO E-VISA MARKET, BY COMPONENT, 2019–2032 (USD MILLION) 56
      1. MEXICO E-VISA MARKET,
    48. BY APPLICATION, 2019–2032 (USD MILLION) 56
      1. MEXICO E-VISA MARKET, BY PLATFORM, 2019–2032
    49. (USD MILLION) 56
    50. EUROPE 57
    51. EUROPE: E-VISA MARKET, BY COUNTRY, 2019–2032 (USD MILLION) 58
      1. EUROPE E-VISA MARKET, BY
    52. COMPONENT, 2019–2032 (USD MILLION) 59
      1. EUROPE E-VISA MARKET, BY APPLICATION, 2019–2032
    53. (USD MILLION) 60
    54. EUROPE E-VISA MARKET, BY PLATFORM, 2019–2032 (USD MILLION) 61
      1. GERMANY 62
        1. GERMANY E-VISA MARKET,
    55. BY COMPONENT, 2019–2032 (USD MILLION) 62
      1. GERMANY E-VISA MARKET, BY APPLICATION, 2019–2032
    56. (USD MILLION) 62
    57. GERMANY E-VISA MARKET, BY PLATFORM, 2019–2032 (USD MILLION) 62
      1. FRANCE 63
        1. FRANCE E-VISA MARKET,
    58. BY COMPONENT, 2019–2032 (USD MILLION) 63
      1. FRANCE E-VISA MARKET, BY APPLICATION, 2019–2032
    59. (USD MILLION) 63
    60. FRANCE E-VISA MARKET, BY PLATFORM, 2019–2032 (USD MILLION) 63
      1. UK 64
        1. UK E-VISA MARKET, BY
    61. COMPONENT, 2019–2032 (USD MILLION) 64
      1. UK E-VISA MARKET, BY APPLICATION, 2019–2032
    62. (USD MILLION) 64
    63. UK E-VISA MARKET, BY PLATFORM, 2019–2032 (USD MILLION) 64
      1. REST OF EUROPE 65
        1. REST OF EUROPE
    64. E-VISA MARKET, BY COMPONENT, 2019–2032 (USD MILLION) 65
      1. REST OF EUROPE E-VISA
    65. MARKET, BY APPLICATION, 2019–2032 (USD MILLION) 65
      1. REST OF EUROPE E-VISA MARKET, BY PLATFORM,
    66. –2032 (USD MILLION) 65
      1. ASIA-PACIFIC 66
        1. ASIA-PACIFIC: E-VISA MARKET, BY COUNTRY, 2019–2032 (USD
    67. MILLION) 67
    68. ASIA-PACIFIC E-VISA MARKET, BY COMPONENT, 2019–2032 (USD MILLION) 68
      1. ASIA-PACIFIC E-VISA
    69. MARKET, BY APPLICATION, 2019–2032 (USD MILLION) 69
      1. ASIA-PACIFIC E-VISA MARKET, BY PLATFORM, 2019–2032
    70. (USD MILLION) 69
    71. CHINA 70
    72. CHINA E-VISA MARKET, BY COMPONENT, 2019–2032 (USD MILLION) 70
      1. CHINA E-VISA MARKET,
    73. BY APPLICATION, 2019–2032 (USD MILLION) 70
      1. CHINA E-VISA MARKET, BY PLATFORM, 2019–2032
    74. (USD MILLION) 70
    75. JAPAN 71
    76. APAN E-VISA MARKET, BY COMPONENT, 2019–2032 (USD MILLION) 71
      1. JAPAN E-VISA MARKET,
    77. BY APPLICATION, 2019–2032 (USD MILLION) 71
      1. JAPAN E-VISA MARKET, BY PLATFORM, 2019–2032
    78. (USD MILLION) 71
    79. INDIA 72
    80. INDIA E-VISA MARKET, BY COMPONENT, 2019–2032 (USD MILLION) 72
      1. INDIA E-VISA MARKET,
    81. BY APPLICATION, 2019–2032 (USD MILLION) 72
      1. INDIA E-VISA MARKET, BY PLATFORM, 2019–2032
    82. (USD MILLION) 72
    83. SOUTH KOREA 73
    84. SOUTH KOREA E-VISA MARKET, BY COMPONENT, 2019–2032 (USD MILLION) 73
      1. SOUTH KOREA E-VISA
    85. MARKET, BY APPLICATION, 2019–2032 (USD MILLION) 73
      1. SOUTH KOREA E-VISA MARKET, BY PLATFORM, 2019–2032
    86. (USD MILLION) 73
    87. REST OF ASIA-PACIFIC 74
      1. REST OF ASIA-PACIFIC E-VISA MARKET, BY COMPONENT, 2019–2032
    88. (USD MILLION) 74
    89. REST OF ASIA-PACIFIC E-VISA MARKET, BY APPLICATION, 2019–2032 (USD MILLION)
    90. REST OF ASIA-PACIFIC E-VISA MARKET, BY PLATFORM, 2019–2032 (USD MILLION) 74
      1. MIDDLE EAST &
    91. AFRICA 75
    92. MIDDLE EAST & AFRICA E-VISA MARKET, BY COMPONENT, 2019–2032 (USD MILLION)
      1. MIDDLE
    93. EAST & AFRICA E-VISA MARKET, BY APPLICATION, 2019–2032 (USD MILLION) 76
      1. MIDDLE EAST &
    94. AFRICA E-VISA MARKET, BY PLATFORM, 2019–2032 (USD MILLION) 77
      1. SOUTH AMERICA 78
        1. SOUTH AMERICA E-VISA
    95. MARKET, BY COMPONENT, 2019–2032 (USD MILLION) 78
      1. SOUTH AMERICA E-VISA MARKET, BY APPLICATION,
    96. –2032 (USD MILLION) 79
      1. SOUTH AMERICA E-VISA MARKET, BY PLATFORM, 2019–2032 (USD
    97. MILLION) 80
    98. COMPETITIVE LANDSCAPE 81
      1. OVERVIEW 81
      2. COMPETITIVE BENCHMARKING 82
      3. MARKET SHARE ANALYSIS 83
      4. KEY DEVELOPMENT IN THE GLOBAL E-VISA MARKET
        1. PRODUCT
    99. LAUNCHES/SERVICE 84
    100. CONTRACTS & AGREEMENTS 84
      1. EXPANSIONS/ JOINT VENTURE & INVESTMENTS 85
        1. PARTNERSHIP & COLABORATION
    101. COMPANY
    102. PROFILE 86
    103. MÜHLBAUER GROUP 86
      1. COMPANY OVERVIEW 86
        1. FINANCIAL OVERVIEW 86
        2. PRODUCTS OFFERED 87
        3. PRODUCTS/SOLUTIONS/SERVICES OFFERED 87
        4. KEY DEVELOPMENTSS
        5. SWOT
    104. ANALYSIS 88
    105. KEY STRATEGIES 88
    106. BLS INTERNATIONAL 89
    107. COMPANY OVERVIEW 89
    108. FINANCIAL OVERVIEW 90
    109. PRODUCTS/SOLUTIONS/SERVICES OFFERED 90
      1. SWOT ANALYSIS 93
        1. KEY STRATEGIES 93
      2. CANADIAN BANK NOTE COMPANY, LIMITED (CBN) 94
        1. COMPANY OVERVIEW
        2. FINANCIAL
    110. OVERVIEW 94
    111. PRODUCTS/SOLUTIONS/SERVICES OFFERED 94
      1. KEY DEVELOPMENTS 95
      2. CSERVE TECHNOLOGIES 95
        1. COMPANY OVERVIEW 95
        2. FINANCIAL OVERVIEW 95
        3. PRODUCTS/SOLUTIONS/SERVICES OFFERED 95
        4. KEY DEVELOPMENTS
      3. IVISA.COM
        1. COMPANY
    112. OVERVIEW 96
    113. FINANCIAL OVERVIEW 96
    114. PRODUCTS/SOLUTIONS/SERVICES OFFERED 96
      1. KEY DEVELOPMENTS 97
        1. SWOT ANALYSIS 97
        2. KEY STRATEGIES 97
      2. VISAHQ 98
        1. COMPANY OVERVIEW 98
        2. FINANCIAL OVERVIEW 98
        3. PRODUCTS/SOLUTIONS/SERVICES OFFERED 98
        4. KEY DEVELOPMENTS
      3. TRAVISA
    115. VISA SERVICES, INC. 99
    116. COMPANY OVERVIEW 99
    117. FINANCIAL OVERVIEW 99
    118. PRODUCTS/SOLUTIONS/SERVICES OFFERED 99
      1. KEY DEVELOPMENTS 100
      2. ITSEASY PASSPORT & VISA SERVICES 101
        1. COMPANY OVERVIEW
    119. FINANCIAL OVERVIEW 101
    120. PRODUCTS/SOLUTIONS/SERVICES OFFERED 101
      1. KEY DEVELOPMENTS 102
      2. GEMALTO NV (A THALES COMPANY) 103
        1. COMPANY OVERVIEW
    121. FINANCIAL OVERVIEW 103
    122. PRODUCTS/SOLUTIONS/SERVICES OFFERED 103
      1. KEY DEVELOPMENTS 103
        1. SWOT ANALYSIS 104
        2. KEY STRATEGIES 104
      2. 4G IDENTITY SOLUTIONS PVT. LTD (4GID) 105
        1. COMPANY OVERVIEW
    123. FINANCIAL OVERVIEW 105
    124. PRODUCTS/SOLUTIONS/SERVICES OFFERED 105
      1. KEY DEVELOPMENTS 106
        1. KEY STRATEGIES 106
      2. VFS GLOBAL GROUP 107
        1. COMPANY OVERVIEW 107
        2. FINANCIAL OVERVIEW 107
        3. PRODUCTS/SOLUTIONS/SERVICES
    125. OFFERED 107
    126. KEY DEVELOPMENTS 107
    127. KEY STRATEGIES 107
    128. SECURIPORT LLC 109
    129. COMPANY OVERVIEW 109
    130. FINANCIAL OVERVIEW 109
    131. PRODUCTS/SOLUTIONS/SERVICES OFFERED 109
      1. KEY DEVELOPMENTS 109
        1. KEY STRATEGIES 109
      2. SWISS AUTHENTIS S.A. 111
        1. COMPANY OVERVIEW 111
        2. FINANCIAL OVERVIEW
    132. PRODUCTS/SOLUTIONS/SERVICES OFFERED 111
      1. KEY DEVELOPMENTS 111
        1. KEY STRATEGIES 111
    133. MARKET, BY COMPONENT, 2019–2032 (USD MILLION) 41
    134. (USD MILLION) 44
    135. GLOBAL E-VISA MARKET, BY PLATFORM, 2019–2032 (USD MILLION) 47
    136. MARKET, BY REGION, 2019–2032 (USD MILLION) 49
    137. –2032 (USD MILLION) 51
    138. (USD MILLION) 51
    139. NORTH AMERICA E-VISA MARKET, BY APPLICATION, 2019–2032 (USD MILLION) 52
    140. E-VISA MARKET, BY PLATFORM 2019–2032 (USD MILLION) 53
    141. (USD MILLION) 54
    142. US E-VISA MARKET, BY APPLICATION, 2019–2032 (USD MILLION) 54
    143. BY PLATFORM 2019–2032 (USD MILLION) 54
    144. (USD MILLION) 55
    145. CANADA E-VISA MARKET, BY APPLICATION, 2019–2032 (USD MILLION) 55
    146. MARKET, BY PLATFORM 2019–2032 (USD MILLION) 55
    147. (USD MILLION) 56
    148. MEXICO E-VISA MARKET, BY APPLICATION, 2019–2032 (USD MILLION) 56
    149. MARKET, BY PLATFORM 2019–2032 (USD MILLION) 56
    150. (USD MILLION) 58
    151. EUROPE E-VISA MARKET, BY COMPONENT, 2019–2032 (USD MILLION) 59
    152. MARKET, BY APPLICATION, 2019–2032 (USD MILLION) 60
    153. (USD MILLION) 61
    154. GERMANY E-VISA MARKET, BY COMPONENT, 2019–2032 (USD MILLION) 62
    155. MARKET, BY APPLICATION, 2019–2032 (USD MILLION) 62
    156. (USD MILLION) 62
    157. FRANCE E-VISA MARKET, BY COMPONENT, 2019–2032 (USD MILLION) 63
    158. MARKET, BY APPLICATION, 2019–2032 (USD MILLION) 63
    159. (USD MILLION) 63
    160. UK E-VISA MARKET, BY COMPONENT, 2019–2032 (USD MILLION) 64
    161. APPLICATION, 2019–2032 (USD MILLION) 64
    162. (USD MILLION) 64
    163. REST OF EUROPE E-VISA MARKET, BY COMPONENT, 2019–2032 (USD MILLION) 65
    164. E-VISA MARKET, BY APPLICATION, 2019–2032 (USD MILLION) 65
    165. MARKET, BY PLATFORM 2019–2032 (USD MILLION) 65
    166. –2032 (USD MILLION) 67
    167. (USD MILLION) 68
    168. ASIA-PACIFIC E-VISA MARKET, BY APPLICATION, 2019–2032 (USD MILLION) 69
    169. E-VISA MARKET, BY PLATFORM 2019–2032 (USD MILLION) 69
    170. (USD MILLION) 70
    171. CHINA E-VISA MARKET, BY APPLICATION, 2019–2032 (USD MILLION) 70
    172. MARKET, BY PLATFORM 2019–2032 (USD MILLION) 70
    173. (USD MILLION) 71
    174. JAPAN E-VISA MARKET, BY APPLICATION, 2019–2032 (USD MILLION) 71
    175. MARKET, BY PLATFORM 2019–2032 (USD MILLION) 71
    176. (USD MILLION) 72
    177. INDIA E-VISA MARKET, BY APPLICATION, 2019–2032 (USD MILLION) 72
    178. MARKET, BY PLATFORM 2019–2032 (USD MILLION) 72
    179. –2032 (USD MILLION) 73
    180. (USD MILLION) 73
    181. SOUTH KOREA E-VISA MARKET, BY PLATFORM 2019–2032 (USD MILLION) 73
    182. E-VISA MARKET, BY COMPONENT, 2019–2032 (USD MILLION) 74
    183. E-VISA MARKET, BY APPLICATION, 2019–2032 (USD MILLION) 74
    184. E-VISA MARKET, BY PLATFORM 2019–2032 (USD MILLION) 74
    185. BY COMPONENT, 2019–2032 (USD MILLION) 75

    E-Visa Market Segmentation

    Global E-Visa Component Outlook (USD Million, 2019-2032)

    • Software
    • Services

    Global E-Visa Application Outlook (USD Million, 2019-2032)

    • Travelling
    • Students/Educational Visa
    • Government/Foreign Affairs
    • Others

    Global E-Visa Platform Outlook (USD Million, 2019-2032)

    • Desktop
    • Smartphone
    • Tablets

    Global E-Visa Regional Outlook (USD Million, 2019-2032)

    North America E-Visa Component Outlook (USD Million, 2019-2032)

    • Software
    • Services

    North America E-Visa Application Outlook (USD Million, 2019-2032)

    • Travelling
    • Students/Educational Visa
    • Government/Foreign Affairs
    • Others

    North America E-Visa Platform Outlook (USD Million, 2019-2032)

    • Desktop
    • Smartphone
    • Tablets

    US E-Visa Component Outlook (USD Million, 2019-2032)

    • Software
    • Services

    US E-Visa Application Outlook (USD Million, 2019-2032)

    • Travelling
    • Students/Educational Visa
    • Government/Foreign Affairs
    • Others

    US E-Visa Platform Outlook (USD Million, 2019-2032)

    • Desktop
    • Smartphone
    • Tablets

    Canada E-Visa Component Outlook (USD Million, 2019-2032)

    • Software
    • Services

    Canada E-Visa Application Outlook (USD Million, 2019-2032)

    • Travelling
    • Students/Educational Visa
    • Government/Foreign Affairs
    • Others

    Canada E-Visa Platform Outlook (USD Million, 2019-2032)

    • Desktop
    • Smartphone
    • Tablets

    Mexico E-Visa Component Outlook (USD Million, 2019-2032)

    • Software
    • Services

    Mexico E-Visa Application Outlook (USD Million, 2019-2032)

    • Travelling
    • Students/Educational Visa
    • Government/Foreign Affairs
    • Others

    Mexico E-Visa Platform Outlook (USD Million, 2019-2032)

    • Desktop
    • Smartphone
    • Tablets

    Europe E-Visa Component Outlook (USD Million, 2019-2032)

    • Software
    • Services

    Europe E-Visa Application Outlook (USD Million, 2019-2032)

    • Travelling
    • Students/Educational Visa
    • Government/Foreign Affairs
    • Others

    Europe E-Visa Platform Outlook (USD Million, 2019-2032)

    • Desktop
    • Smartphone
    • Tablets

    Germany E-Visa Component Outlook (USD Million, 2019-2032)

    • Software
    • Services

    Germany E-Visa Application Outlook (USD Million, 2019-2032)

    • Travelling
    • Students/Educational Visa
    • Government/Foreign Affairs
    • Others

    Germany E-Visa Platform Outlook (USD Million, 2019-2032)

    • Desktop
    • Smartphone
    • Tablets

    UK E-Visa Component Outlook (USD Million, 2019-2032)

    • Software
    • Services

    UK E-Visa Application Outlook (USD Million, 2019-2032)

    • Travelling
    • Students/Educational Visa
    • Government/Foreign Affairs
    • Others

    UK E-Visa Platform Outlook (USD Million, 2019-2032)

    • Desktop
    • Smartphone
    • Tablets

    France E-Visa Component Outlook (USD Million, 2019-2032)

    • Software
    • Services

    France E-Visa Application Outlook (USD Million, 2019-2032)

    • Travelling
    • Students/Educational Visa
    • Government/Foreign Affairs
    • Others

    France E-Visa Platform Outlook (USD Million, 2019-2032)

    • Desktop
    • Smartphone
    • Tablets

    Italy E-Visa Component Outlook (USD Million, 2019-2032)

    • Software
    • Services

    Italy E-Visa Application Outlook (USD Million, 2019-2032)

    • Travelling
    • Students/Educational Visa
    • Government/Foreign Affairs
    • Others

    Italy E-Visa Platform Outlook (USD Million, 2019-2032)

    • Desktop
    • Smartphone
    • Tablets

    Spain E-Visa Component Outlook (USD Million, 2019-2032)

    • Software
    • Services

    Spain E-Visa Application Outlook (USD Million, 2019-2032)

    • Travelling
    • Students/Educational Visa
    • Government/Foreign Affairs
    • Others

    Spain E-Visa Platform Outlook (USD Million, 2019-2032)

    • Desktop
    • Smartphone
    • Tablets

    Rest of Europe E-Visa Component Outlook (USD Million, 2019-2032)

    • Software
    • Services

    Rest of Europe E-Visa Application Outlook (USD Million, 2019-2032)

    • Travelling
    • Students/Educational Visa
    • Government/Foreign Affairs
    • Others

    Rest of Europe E-Visa Platform Outlook (USD Million, 2019-2032)

    • Desktop
    • Smartphone
    • Tablets

    Asia-Pacific E-Visa Component Outlook (USD Million, 2019-2032)

    • Software
    • Services

    Asia-Pacific E-Visa Application Outlook (USD Million, 2019-2032)

    • Travelling
    • Students/Educational Visa
    • Government/Foreign Affairs
    • Others

    Asia-Pacific E-Visa Platform Outlook (USD Million, 2019-2032)

    • Desktop
    • Smartphone
    • Tablets

    China E-Visa Component Outlook (USD Million, 2019-2032)

    • Software
    • Services

    China E-Visa Application Outlook (USD Million, 2019-2032)

    • Travelling
    • Students/Educational Visa
    • Government/Foreign Affairs
    • Others

    China E-Visa Platform Outlook (USD Million, 2019-2032)

    • Desktop
    • Smartphone
    • Tablets

    Japan E-Visa Component Outlook (USD Million, 2019-2032)

    • Software
    • Services

    Japan E-Visa Application Outlook (USD Million, 2019-2032)

    • Travelling
    • Students/Educational Visa
    • Government/Foreign Affairs
    • Others

    Japan E-Visa Platform Outlook (USD Million, 2019-2032)

    • Desktop
    • Smartphone
    • Tablets

    India E-Visa Component Outlook (USD Million, 2019-2032)

    • Software
    • Services

    India E-Visa Application Outlook (USD Million, 2019-2032)

    • Travelling
    • Students/Educational Visa
    • Government/Foreign Affairs
    • Others

    India E-Visa Platform Outlook (USD Million, 2019-2032)

    • Desktop
    • Smartphone
    • Tablets

    Rest of Asia-Pacific E-Visa Component Outlook (USD Million, 2019-2032)

    • Software
    • Services

    Rest of Asia-Pacific E-Visa Application Outlook (USD Million, 2019-2032)

    • Travelling
    • Students/Educational Visa
    • Government/Foreign Affairs
    • Others

    Rest of Asia-Pacific E-Visa Platform Outlook (USD Million, 2019-2032)

    • Desktop
    • Smartphone
    • Tablets

    Middle East & Africa E-Visa Component Outlook (USD Million, 2019-2032)

    • Software
    • Services

    Middle East & Africa E-Visa Application Outlook (USD Million, 2019-2032)

    • Travelling
    • Students/Educational Visa
    • Government/Foreign Affairs
    • Others

    Middle East & Africa E-Visa Platform Outlook (USD Million, 2019-2032)

    • Desktop
    • Smartphone
    • Tablets

    Saudi Arabia E-Visa Component Outlook (USD Million, 2019-2032)

    • Software
    • Services

    Saudi Arabia E-Visa Application Outlook (USD Million, 2019-2032)

    • Travelling
    • Students/Educational Visa
    • Government/Foreign Affairs
    • Others

    Saudi Arabia E-Visa Platform Outlook (USD Million, 2019-2032)

    • Desktop
    • Smartphone
    • Tablets

    UAE E-Visa Component Outlook (USD Million, 2019-2032)

    • Software
    • Services

    UAE E-Visa Application Outlook (USD Million, 2019-2032)

    • Travelling
    • Students/Educational Visa
    • Government/Foreign Affairs
    • Others

    UAE E-Visa Platform Outlook (USD Million, 2019-2032)

    • Desktop
    • Smartphone
    • Tablets

    South Africa E-Visa Component Outlook (USD Million, 2019-2032)

    • Software
    • Services

    South Africa E-Visa Application Outlook (USD Million, 2019-2032)

    • Travelling
    • Students/Educational Visa
    • Government/Foreign Affairs
    • Others

    South Africa E-Visa Platform Outlook (USD Million, 2019-2032)

    • Desktop
    • Smartphone
    • Tablets

    Rest of MEA E-Visa Component Outlook (USD Million, 2019-2032)

    • Software
    • Services

    Rest of MEA E-Visa Application Outlook (USD Million, 2019-2032)

    • Travelling
    • Students/Educational Visa
    • Government/Foreign Affairs
    • Others

    Rest of MEA E-Visa Platform Outlook (USD Million, 2019-2032)

    • Desktop
    • Smartphone
    • Tablets

    South America E-Visa Component Outlook (USD Million, 2019-2032)

    • Software
    • Services

    South America E-Visa Application Outlook (USD Million, 2019-2032)

    • Travelling
    • Students/Educational Visa
    • Government/Foreign Affairs
    • Others

    South America E-Visa Platform Outlook (USD Million, 2019-2032)

    • Desktop
    • Smartphone
    • Tablets

    Brazil E-Visa Component Outlook (USD Million, 2019-2032)

    • Software
    • Services

    Brazil E-Visa Application Outlook (USD Million, 2019-2032)

    • Travelling
    • Students/Educational Visa
    • Government/Foreign Affairs
    • Others

    Brazil E-Visa Platform Outlook (USD Million, 2019-2032)

    • Desktop
    • Smartphone
    • Tablets

    Argentina E-Visa Component Outlook (USD Million, 2019-2032)

    • Software
    • Services

    Argentina E-Visa Application Outlook (USD Million, 2019-2032)

    • Travelling
    • Students/Educational Visa
    • Government/Foreign Affairs
    • Others

    Argentina E-Visa Platform Outlook (USD Million, 2019-2032)

    • Desktop
    • Smartphone
    • Tablets

    Rest of South America E-Visa Component Outlook (USD Million, 2019-2032)

    • Software
    • Services

    Rest of South America E-Visa Application Outlook (USD Million, 2019-2032)

    • Travelling
    • Students/Educational Visa
    • Government/Foreign Affairs
    • Others

    Rest of South America E-Visa Platform Outlook (USD Million, 2019-2032)

    • Desktop
    • Smartphone
    • Tablets
    Infographic

    Free Sample Request

    Kindly complete the form below to receive a free sample of this Report

    Get Free Sample

    Customer Strories

    “I am very pleased with how market segments have been defined in a relevant way for my purposes (such as "Portable Freezers & refrigerators" and "last-mile"). In general the report is well structured. Thanks very much for your efforts.”

    Victoria Milne

    Founder
    Case Study

    Smartphone Motherboard Parts Manufacturing Research