• Cat-intel
  • MedIntelliX
  • Resources
  • About Us
  • Hero Background
    English
    Chinese
    French
    Japanese
    Korean
    German
    Spanish

    Aviation Fuel Market Analysis

    ID: MRFR/A&D/6946-CR
    200 Pages
    Sejal Akre
    June 2025

    Aviation Fuel Market Research Report By Fuel Type (Jet A, Jet A-1, Jet B, Avgas, Sustainable Aviation Fuel), By End Use (Commercial Aviation, Military Aviation, General Aviation), By Distribution Channel (Direct Sales, Distributors, Retailers), By Application (Cargo Transportation, Passenger Flights, Charter Services) and By Regional (North America, Europe, South America, Asia Pacific, Middle E...

    Share:
    Download PDF ×

    We do not share your information with anyone. However, we may send you emails based on your report interest from time to time. You may contact us at any time to opt-out.

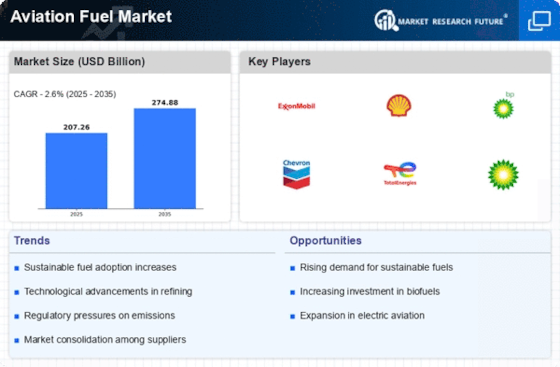
    Aviation Fuel Market Infographic
    $ 4,950.0
    $ 5,950.0
    $ 7,250.0

    Market Analysis

    In-depth Analysis of Aviation Fuel Market Industry Landscape

    There are dynamic forces in the Aviation Fuel Market that reflect the intricate balance of needs between the aviation industry, global energy trends and environmental aspects. One of the central dynamics is demand for aviation fuels which is intrinsically linked to growth of the aviation sector. As air travel continues to surge globally, especially in emerging economies, a corresponding increase in demand for aviation fuel ensues. This dynamic is influenced by rising passenger numbers and expanding fleets as well as continued globalization of trade and tourism.

    The dynamics of the Aviation Fuel Market are significantly affected by geopolitics and global economic conditions. Oil prices determine jet fuel costs directly and are sensitive to geopolitical tensions, disruptions in supply, and economic uncertainties. These market dynamics result from an industry that is prone to geopolitical events because they can bring about sudden price changes for fuel thereby affecting airlines’ operational expenses as well as posing challenges towards fuel suppliers. Thus it becomes important for market participants to be able to manage such geopolitical dynamics if they want to maintain stability within this market.

    Technological advancements in aviation play a pivotal role in shaping the market dynamics. The aviation industry continuously seeks more fuel-efficient planes and alternative propulsion technologies that will enhance sustainability while reducing environmental impact. The development and uptake of advanced planes, engines, and aerodynamics influence demand for more efficient green-friendly aircraft fuels. This dynamic reflects the determination within industry towards innovation coupled with efficiency; ultimately influencing composition plus other characteristics of aviation fuel markets.

    Environmental concerns particularly sustainability are transformative dynamisms within Aviation Fuel Markets. There has been increasing pressure on the industry to reduce greenhouse gas emissions leading to a shift towards sustainable aviation fuels (SAFs) or biofuels . A combination of regulatory initiatives, corporate responsibility goals, and consumer preferences for eco-friendly air travel drives this dynamic.. While seeking alternatives that address environmental concerns expressed by these fuels industries ,aviation companies also seek alignment with international efforts aimed at climate change mitigation measures.

    Given that it is a global industry, supply chain dynamics are fundamental to the Aviation Fuel Market. The provision of jet fuel involves complex logistics, refinery capacities, transport infrastructure and geopolitical factors. Disruptions in the supply chain which may be precipitated by natural calamities, geopolitical skirmishes among other causes can have immediate as well as long term implications on the market. These supply chain dynamics should be navigated by market participants to ensure consistent and dependable fuel supplies for the aviation industry.

    Government regulations as well as international agreements play a significant role in shaping the Aviation Fuel Market dynamics. Regulatory measures such as emission standards and incentives for use of sustainable aviation fuels directly influence how the industry acquires and uses its fuels. Such international agreements’ initiatives like CORSIA (Carbon Offsetting and Reduction Scheme for International Aviation) help drive the industry towards reducing its carbon footprint at large. Consequently, compliance with these regulations plus agreements drives changes within this market rendering it net neutral regarding evolution issues over time.

    Volatility in crude oil prices also affects market dynamics. The fact that jet fuel is predominantly derived from crude oil means that changes in the price of oil directly impact the Aviation Fuel Market’s cost structure. This industry also depends on geopolitical events, decisions made by OPEC, and global economic situations which contribute to fluctuations in oil prices. Understanding and managing this dynamic is very important for airlines, fuel suppliers, and market players who want to remain profitable.

    Market dynamics are driven by competitive interactions among aviation fuel suppliers and producers. Airlines look for reliable and cheap sources of fuel whereas suppliers try to offer competitive prices, efficient supply chains, and innovative approaches. There are several major players like independent refiners, biofuel producers as well as oil companies whose strategies influence market dynamics. Competitiveness and success in the Aviation Fuel Market results from the capacity of participants to adjust to a rapidly changing environment.

    Technological innovation dynamics associated with production processes will keep changing how things happen in the aviation fuel sector. Innovations such as better refining technologies, new conversion processes for sustainable aviation fuels that are less energy-intensive or use non-fossil carbon feedstock and emerging biofuel production techniques alter the entire market place. These developments help shape alternative choices, behavior patterns adopted by companies supplying this product in question through influencing availability costs as well as environmental sustainability considerations.

    Therefore, growth rates of aviation sector, geopolitical concerns, technological breakthroughs , environmental issues ,supply chain conduct ,government policy regulations ,oil price instability ,competitive landscape ,and technology innovations form some of the dynamic forces experienced within Aviation Fuel Market.This interplay among these elements shapes how air carriers go about their business; thus they determine what future awaits the Aviation Fuel Market

    Market Summary

    The Global Aviation Fuel Market is projected to grow from 207.3 USD Billion in 2024 to 275 USD Billion by 2035.

    Key Market Trends & Highlights

    Aviation Fuel Key Trends and Highlights

    • The market is expected to witness a compound annual growth rate (CAGR) of 2.6 percent from 2025 to 2035.
    • By 2035, the market valuation is anticipated to reach 275 USD Billion, indicating robust growth potential.
    • In 2024, the market is valued at 207.3 USD Billion, reflecting a strong foundation for future expansion.
    • Growing adoption of sustainable aviation fuel due to increasing environmental regulations is a major market driver.

    Market Size & Forecast

    2024 Market Size 207.3 (USD Billion)
    2035 Market Size 275 (USD Billion)
    CAGR (2025-2035) 2.6%
    Largest Regional Market Share in 2024 latin_america)

    Major Players

    World Fuel Services, ExxonMobil, Marathon Petroleum, PetroChina, Shell, AirBP, Chevron, Phillips 66, Valero Energy, Reliance Industries, TotalEnergies, British Petroleum

    Market Trends

    The Aviation Fuel Market is currently witnessing significant trends driven by a combination of environmental regulations and advancing technologies. One of the primary market drivers is the increasing push for sustainable aviation fuel (SAF), as countries and aviation bodies aim to reduce carbon emissions and combat climate change.

    Governments worldwide are setting ambitious targets to lower greenhouse gas emissions in the aviation sector, creating a growing demand for more sustainable fuel options.

    In response, airlines and fuel suppliers are exploring partnerships to develop and distribute SAF, reflecting a shift towards green alternatives.

    The Aviation Fuel Market offers an extensive array of opportunities, particularly in the expansion of the production and use of biofuels derived from renewable materials.

    The conversion processes for these fuels are becoming more efficient and cost-effective as technology advances, which has the potential to attract additional investments.

    Furthermore, emerging markets are experiencing an increase in aviation traffic, which necessitates the establishment of more dependable fuel supply chains and infrastructure development.

    This provides stakeholders with the opportunity to investigate the potential for investment in new facilities and distribution channels to address the increasing demand for aviation fuel. In recent years, there has been a significant increase in the collaboration between private sectors and countries to address petroleum shortages and guarantee energy security in the aviation sector. This has resulted in heightened discourse regarding the enhancement of global supply chains, the enhancement of airport infrastructure, and the implementation of refined fuel-efficient technologies.

    The transition to digital advancements, which encompasses the optimization and monitoring of petroleum consumption in real time, is also gaining momentum.

    The Aviation Fuel Market is poised for substantial growth and development in the years ahead, as these trends suggest a strong emphasis on sustainability, efficiency, and collaboration as aviation continues to develop.

    The global aviation fuel market is poised for transformation as the industry increasingly embraces sustainable practices and alternative fuels, reflecting a broader commitment to reducing carbon emissions and enhancing energy efficiency.

    U.S. Energy Information Administration (EIA)

    Aviation Fuel Market Market Drivers

    Increasing Air Travel Demand

    The Global Aviation Fuel Market Industry is experiencing a surge in demand driven by the increasing number of air travelers worldwide. In 2024, the market is projected to reach 207.3 USD Billion, reflecting a growing preference for air travel as a primary mode of transportation. Factors such as rising disposable incomes, urbanization, and the expansion of low-cost carriers contribute to this trend. As more individuals and businesses opt for air travel, the demand for aviation fuel is likely to escalate, further solidifying the industry's growth trajectory.

    Market Trends and Projections

    Emergence of Sustainable Aviation Fuels

    The emergence of sustainable aviation fuels (SAFs) represents a transformative driver within the Global Aviation Fuel Market Industry. SAFs, derived from renewable resources, are gaining traction as airlines seek to reduce their carbon footprints. The adoption of SAFs is expected to grow as airlines respond to consumer demand for greener travel options. This shift could lead to a significant reconfiguration of fuel supply chains and market dynamics. As the industry moves towards sustainability, the integration of SAFs may reshape the aviation fuel landscape, influencing both demand and pricing strategies.

    Global Economic Growth and Trade Expansion

    The Global Aviation Fuel Market Industry is closely tied to global economic growth and trade expansion. As economies recover and expand, the demand for air cargo and passenger travel is likely to increase. This growth is expected to propel the aviation fuel market, with projections indicating a market size of 275 USD Billion by 2035. The expansion of international trade routes and the increasing need for efficient logistics solutions further contribute to this trend. Consequently, the aviation fuel sector is poised to benefit from the overall economic landscape, driving demand for fuel.

    Technological Advancements in Fuel Efficiency

    Technological innovations in aircraft design and fuel efficiency are pivotal drivers within the Global Aviation Fuel Market Industry. The introduction of more fuel-efficient engines and aerodynamic designs has the potential to reduce fuel consumption significantly. For instance, advancements in materials and engine technology may lead to reductions in fuel usage by up to 20 percent. This not only lowers operational costs for airlines but also aligns with global sustainability goals. As airlines increasingly adopt these technologies, the demand for aviation fuel is expected to evolve, impacting market dynamics positively.

    Regulatory Framework and Environmental Policies

    The Global Aviation Fuel Market Industry is influenced by stringent regulatory frameworks and environmental policies aimed at reducing carbon emissions. Governments worldwide are implementing regulations that encourage the use of sustainable aviation fuels (SAFs) and promote cleaner technologies. For instance, the International Civil Aviation Organization has set ambitious targets for reducing greenhouse gas emissions. These policies may drive investments in alternative fuels, potentially reshaping the aviation fuel landscape. As the industry adapts to these regulations, the demand for traditional aviation fuels may experience fluctuations, impacting market growth.

    Market Segment Insights

    Aviation Fuel Market Segment Insights

    Aviation Fuel Market Segment Insights

    Aviation Fuel Market Fuel Type Insights

    Aviation Fuel Market Fuel Type Insights

    The Aviation Fuel Market is segmented by Fuel Type, revealing distinct characteristics and growth patterns among its various categories. By 2024, the market is valued at 207.26 USD Billion, with expected shifts and growth driving the dynamics of its components. The dominant fuel, Jet A, holds a valuation of 50.0 USD Billion in 2024 and is projected to increase to 65.0 USD Billion by 2035.

    Jet A is commonly used for commercial aviation, making it crucial in the overall market landscape due to its widespread acceptance and compatibility with numerous aircraft.

    Another significant segment, Jet A-1, is valued at 70.0 USD Billion in 2024 and is anticipated to rise to 85.0 USD Billion by 2035. This variant is favored globally for its lower freezing point, making it particularly appropriate for international flights that operate in varying temperatures, thus reinforcing its pivotal role in global aviation operations.

    The Jet B segment, while smaller, with a valuation of 15.0 USD Billion in 2024, is projected to grow to 20.0 USD Billion by 2035. This fuel is primarily utilized in colder climates due to its improved cold-weather performance and is especially relevant for bush flying and cold-weather operations.

    The market insights underline the various dynamics at play, with each fuel type playing a vital role in shaping the future of aviation fuel utilization globally.

    Source: Primary Research, Secondary Research, Market Research Future Database and Analyst Review

    Aviation Fuel Market End Use Insights

    Aviation Fuel Market End Use Insights

    The Aviation Fuel Market is a crucial component of the broader aviation industry, showcasing diverse applications under the End Use segment. As of 2024, the market reached a valuation of 207.26 USD billion, reflecting its foundational role in the operational capabilities of various aviation sectors.

    Within this segment, Commercial Aviation holds substantial importance, driving demand for aviation fuel due to the increasing global air travel frequency. Military Aviation also plays a significant role, as robust funding and modernization programs bolster fuel consumption for defense operations.General Aviation, while smaller in comparison, supports a variety of leisure, transport, and business flights, adding to the overall market dynamics. This entire segment is fueled by trends such as technological advancements in fuel efficiency, growing tourism, and the shift towards sustainable aviation fuels.

    As the Aviation Fuel Market continuously adapts to emerging challenges and opportunities, including regulatory changes and fluctuating oil prices, its diverse applications ensure a stable and significant contribution to the global economy.The Aviation Fuel Market statistics reveal the intricate interplay within these subcategories, underscoring their collective impact on market growth and sustainability improvements within the industry.

    Aviation Fuel Market Distribution Channel Insights

    Aviation Fuel Market Distribution Channel Insights

    The Distribution Channel segment of the Aviation Fuel Market is pivotal in ensuring efficient fuel delivery to various stakeholders, reflecting a vital part of the entire supply chain. As of 2024, the market is valued at USD 207.26 Billion, highlighting the importance of robust distribution mechanisms in meeting global demand.

    Within this segment, direct sales, distributors, and retailers each play a significant role, with direct sales often showing dominance due to the efficiency of bypassing intermediaries. Distributors are critical for regional penetration, providing essential logistics support to transport fuel where it is needed most, thus shaping the market dynamics.Retailers, similarly, ensure accessibility and timely delivery of aviation fuel to end-users, particularly at airports. The interplay among these distribution channels facilitates market growth, driven by the expanding aviation industry and increasing air travel, while also posing challenges like fluctuating fuel prices and regulatory changes.

    Moreover, technological advancements in logistics and supply chain management create opportunities for improving operational efficiency, thereby enhancing the competitive landscape of the Aviation Fuel Market.This segment, with its multifaceted distribution approach, continues to be instrumental in navigating market forces and ensuring steady supply to meet growing global demand.

    Aviation Fuel Market Application Insights

    Aviation Fuel Market Application Insights

    The Aviation Fuel Market is expected to witness substantial growth, particularly in its Application segment, where it is projected to reach a valuation of 207.26 USD Billion by 2024. This segment is primarily composed of Cargo Transportation, Passenger Flights, and Charter Services.

    In recent years, the demand for cargo transportation has surged due to increased global trade and e-commerce activities, making it a significant contributor to the overall market. Passenger flights continue to dominate the market as the preference for air travel rises across the globe, driven by growing disposable incomes and a desire for quicker travel options.Charter services, while a smaller segment, are gaining traction as travelers seek personalized and flexible travel arrangements, especially in the post-pandemic landscape. The Aviation Fuel Market revenue reflects a robust growth trajectory fueled by rising air traffic and the need for efficient fuel solutions.

    Additionally, sustainability initiatives and advancements in fuel technology represent emerging opportunities that could shape the future of the Aviation Fuel Market industry, transforming how aviation fuels are produced and consumed.Overall, the market growth highlights the essential role of these Applications within the aviation sector.

    Get more detailed insights about Aviation Fuel Market Research Report - Global Forecast till 2035

    Regional Insights

    The Aviation Fuel Market exhibits a significant variation across different regions, showcasing its diverse demand and utilization patterns. In 2024, North America leads the market with a valuation of 87.5 USD Billion, expected to reach 113.0 USD Billion by 2035, reflecting its dominance due to a high volume of air travel and well-established infrastructure.

    Europe follows closely with a valuation of 60.0 USD Billion in 2024, growing to 79.0 USD Billion in 2035, driven by increasing environmental regulations and a shift towards sustainable aviation fuels.

    South America occupies a smaller share at 14.0 USD Billion in 2024, projected to grow to 18.5 USD Billion by 2035, as economic development stimulates air travel.

    The Asia Pacific region, valued at 37.5 USD Billion in 2024 and expected to reach 50.0 USD Billion by 2035, showcases significant growth potential, fueled by rising disposable incomes and expanding air connectivity.

    Lastly, the Middle East and Africa represent the smallest market at 8.26 USD Billion in 2024, increasing to 14.5 USD Billion by 2035, influenced by the rapid development of tourism sectors and strategic investments in aviation.

    This regional segmentation illustrates the pivotal role each area plays within the Aviation Fuel Market, influenced by economic dynamics, governmental policies, and air traffic patterns.

    Aviation Fuel Market Regional Insights

    Source: Primary Research, Secondary Research, Market Research Future Database and Analyst Review

    Key Players and Competitive Insights

    The Aviation Fuel Market is characterized by a tight competitive landscape with several key players vying for market share amidst growing demand for air travel and a shift towards sustainable aviation fuels.

    The market is influenced by factors such as fluctuating crude oil prices, regulatory environments, advancements in fuel efficiency, and a rising emphasis on environmental sustainability.

    As airlines and airports work to reduce their carbon footprints, they increasingly seek innovative fuel solutions, presenting opportunities and challenges for existing companies.

    Competitive strategies in this market often revolve around product development, strategic partnerships, and geographic expansion, leading to a dynamic environment where companies must continuously adapt to changing market conditions and customer preferences.

    World Fuel Services stands out in the Aviation Fuel Market with significant strengths and a broad market presence. The company has positioned itself as a prominent fuel supplier and service provider, catering to the diverse needs of airlines, private operators, and fixed-base operators.

    Leveraging its extensive logistics capabilities, World Fuel Services offers efficient and reliable fuel supply solutions globally, making it a preferred partner for aviation entities.

    Furthermore, the company's focus on customer service and tailored solutions enhances its competitive advantage, allowing it to respond quickly to the needs of its clients. This customer-centric approach, combined with a robust global network, solidifies World Fuel Services' standing as a formidable player in the aviation fuel sector.ExxonMobil also holds a significant position in the Aviation Fuel Market, leveraging its extensive experience and resources to offer a range of high-quality aviation fuels and related services. The company's key products include aviation gasoline and jet fuel, which meet stringent quality standards.

    ExxonMobil's market presence is underscored by strategic partnerships and collaborations with airlines and airports, ensuring consistent supply and reliability.

    Additionally, the company's investments in refining capacity and technology innovations enhance its operational efficiencies and minimize environmental impact, bolstering its reputation in sustainability efforts.

    With a history of mergers and acquisitions, ExxonMobil has expanded its global footprint, enabling it to penetrate new markets and strengthen its service capabilities. This strategic growth not only enhances its competitive edge but also positions ExxonMobil to meet the evolving demands of the aviation industry on a global scale.

    Key Companies in the Aviation Fuel Market market include

    Industry Developments

    Recent developments in the Aviation Fuel Market include a notable rise in crude oil prices, which has directly influenced aviation fuel costs globally. This price increase, mainly driven by geopolitical tensions and production cuts by leading oil-producing nations, is impacting fuel suppliers like ExxonMobil, Shell, and Chevron, who are grappling with rising input costs.

    In September 2023, Petroleum companies reported that the demand for sustainable aviation fuel (SAF) is also increasing, with major players like TotalEnergies and British Petroleum investing in production facilities to cater to this growing market. On the mergers and acquisitions front, in August 2023, World Fuel Services acquired a regional fuel distribution company to expand its service capabilities and market share.

    The COVID-19 pandemic recovery has led to a surge in flight operations, boosting demand for aviation fuel, and major suppliers like AirBP and Phillips 66 are ramping up production.

    The Aviation Fuel Market is anticipated to grow steadily as environmental regulations drive the transition towards greener fuel alternatives. These changes reflect the industry's shift towards sustainability while accommodating rising demand levels.

    Future Outlook

    Aviation Fuel Market Future Outlook

    The Global Aviation Fuel Market is projected to grow at a 2.6% CAGR from 2024 to 2035, driven by increasing air travel demand, technological advancements, and sustainability initiatives.

    New opportunities lie in:

    • Invest in biofuels to meet rising sustainability regulations and consumer preferences.
    • Develop advanced logistics solutions to optimize fuel distribution efficiency.
    • Leverage digital technologies for predictive maintenance in fuel management systems.

    By 2035, the market is expected to be robust, driven by innovation and sustainability initiatives.

    Market Segmentation

    Aviation Fuel Market End Use Outlook

    • Direct Sales
    • Distributors
    • Retailers

    Aviation Fuel Market Regional Outlook

    • North America
    • Europe
    • South America
    • Asia Pacific
    • Middle East and Africa

    Aviation Fuel Market Fuel Type Outlook

    • Commercial Aviation
    • Military Aviation
    • General Aviation

    Aviation Fuel Market Application Outlook

    • North America
    • Europe
    • South America
    • Asia Pacific
    • Middle East and Africa

    Aviation Fuel Market Distribution Channel Outlook

    • Cargo Transportation
    • Passenger Flights
    • Charter Services

    Report Scope

    Report Attribute/Metric Details
    Market Size 2023 202.01(USD Billion)
    Market Size 2024 207.26(USD Billion)
    Market Size 2035 275.0(USD Billion)
    Compound Annual Growth Rate (CAGR) 2.6% (2025 - 2035)
    Report Coverage Revenue Forecast, Competitive Landscape, Growth Factors, and Trends
    Base Year 2024
    Market Forecast Period 2025 - 2035
    Historical Data 2019 - 2024
    Market Forecast Units USD Billion
    Key Companies Profiled World Fuel Services, ExxonMobil, Marathon Petroleum, PetroChina, Shell, AirBP, Chevron, Phillips 66, Valero Energy, Castrol, Energizer Holdings, Reliance Industries, TotalEnergies, British Petroleum, SABIC
    Segments Covered Fuel Type, End Use, Distribution Channel, Application, Regional
    Key Market Opportunities Sustainable aviation fuel adoption, Biofuel production advancements, Emerging markets demand growth, Technological innovations in fuel efficiency, Regulatory compliance and sustainability initiatives
    Key Market Dynamics Rising air travel demand, Fluctuating crude oil prices, Regulatory emissions standards, Biofuel adoption initiatives, Geopolitical uncertainties
    Countries Covered North America, Europe, APAC, South America, MEA

    Market Highlights

    Author

    Sejal Akre
    Senior Research Analyst

    She holds an experience of about 6+ years in market research and business consulting, working under the spectrum of information communication technology, telecommunications and semiconductor domains. aarti conceptualizes and implements a scalable business strategy and provides strategic leadership to the clients. her expertise lies in market estimation, competitive intelligence, pipeline analysis, customer assessment, etc.

    Leave a Comment

    Latest Comments

    John Doe
    john@example.com

    This is a great article! Really helped me understand the topic better.

    Posted on July 23, 2025, 10:15 AM
    Jane Smith
    jane@domain.com

    Thanks for sharing this. I’ve bookmarked it for later reference.

    Posted on July 22, 2025, 7:45 PM

    FAQs

    What was the market size of the Aviation Fuel Market in 2024?

    The Aviation Fuel Market was valued at 207.26 USD Billion in 2024.

    What will the market value reach by 2035?

    By 2035, the Aviation Fuel Market is projected to reach a valuation of 275.0 USD Billion.

    What is the anticipated CAGR for the Aviation Fuel Market from 2025 to 2035?

    The market is expected to witness a CAGR of 2.6% from 2025 to 2035.

    Which region held the largest market share in 2024?

    In 2024, North America was the largest region in the Aviation Fuel Market, valued at 85.0 USD Billion.

    What is the projected market size for Europe in 2035?

    By 2035, the European market for aviation fuel is anticipated to grow to 65.0 USD Billion.

    What is the expected market size for Sustainable Aviation Fuel by 2035?

    The Sustainable Aviation Fuel segment is expected to be valued at 25.0 USD Billion by 2035.

    How does the Jet A segment compare in value from 2024 to 2035?

    The Jet A segment is projected to increase from 80.0 USD Billion in 2024 to 105.0 USD Billion by 2035.

    Who are the key players in the Aviation Fuel Market?

    Major players include ExxonMobil, Shell, Chevron, and British Petroleum among others.

    What was the market size for the APAC region in 2024?

    The APAC region represented a market size of 55.0 USD Billion in 2024.

    What growth challenges does the aviation fuel market face?

    Challenges include fluctuating oil prices and regulatory constraints on emissions in the aviation sector.

    1. . EXECUTIVE SUMMARY
    2. . Market Overview
    3. . Key Findings
    4. . Market Segmentation
    5. . Competitive Landscape
    6. . Challenges and Opportunities
    7. . Future Outlook
    8. . MARKET INTRODUCTION
    9. . Definition
    10. . Scope of the study
    11. . Research Objective
    12. . Assumption
    13. . Limitations
    14. . RESEARCH METHODOLOGY
    15. . Overview
    16. . Data Mining
    17. . Secondary Research
    18. . Primary Research
    19. . Primary Interviews and Information Gathering Process
    20. . Breakdown of Primary Respondents
    21. . Forecasting Model
    22. . Market Size Estimation
    23. . Bottom-Up Approach
    24. . Top-Down Approach
    25. . Data Triangulation
    26. . Validation
    27. . MARKET DYNAMICS
    28. . Overview
    29. . Drivers
    30. . Restraints
    31. . Opportunities
    32. . MARKET FACTOR ANALYSIS
    33. . Value chain Analysis
    34. . Porter's Five Forces Analysis
    35. . Bargaining Power of Suppliers
    36. . Bargaining Power of Buyers
    37. . Threat of New Entrants
    38. . Threat of Substitutes
    39. . Intensity of Rivalry
    40. . COVID-19 Impact Analysis
    41. . Market Impact Analysis
    42. . Regional Impact
    43. . Opportunity and Threat Analysis
    44. . AVIATION FUEL MARKET, BY FUEL TYPE (USD BILLION)
    45. . Jet A
    46. . Jet A-1
    47. . Jet B
    48. . Avgas
    49. . Sustainable Aviation Fuel
    50. . AVIATION FUEL MARKET, BY END USE (USD BILLION)
    51. . Commercial Aviation
    52. . Military Aviation
    53. . General Aviation
    54. . AVIATION FUEL MARKET, BY DISTRIBUTION CHANNEL (USD BILLION)
    55. . Direct Sales
    56. . Distributors
    57. . Retailers
    58. . AVIATION FUEL MARKET, BY APPLICATION (USD BILLION)
    59. . Cargo Transportation
    60. . Passenger Flights
    61. . Charter Services
    62. . AVIATION FUEL MARKET, BY REGIONAL (USD BILLION)
    63. . North America
    64. . US
    65. . Canada
    66. . Europe
    67. . Germany
    68. . UK
    69. . France
    70. . Russia
    71. . Italy
    72. . Spain
    73. . Rest of Europe
    74. . APAC
    75. . China
    76. . India
    77. . Japan
    78. . South Korea
    79. . Malaysia
    80. . Thailand
    81. . Indonesia
    82. . Rest of APAC
    83. . South America
    84. . Brazil
    85. . Mexico
    86. . Argentina
    87. . Rest of South America
    88. . MEA
    89. . GCC Countries
    90. . South Africa
    91. . Rest of MEA
    92. . COMPETITIVE LANDSCAPE
    93. . Overview
    94. . Competitive Analysis
    95. . Market share Analysis
    96. . Major Growth Strategy in the Aviation Fuel Market
    97. . Competitive Benchmarking
    98. . Leading Players in Terms of Number of Developments in the Aviation Fuel Market
    99. . Key developments and growth strategies
    100. . New Product Launch/Service Deployment
    101. . Merger & Acquisitions
    102. . Joint Ventures
    103. . Major Players Financial Matrix
    104. . Sales and Operating Income
    105. . Major Players R&D Expenditure. 2023
    106. . COMPANY PROFILES
    107. . World Fuel Services
    108. . Financial Overview
    109. . Products Offered
    110. . Key Developments
    111. . SWOT Analysis
    112. . Key Strategies
    113. . ExxonMobil
    114. . Financial Overview
    115. . Products Offered
    116. . Key Developments
    117. . SWOT Analysis
    118. . Key Strategies
    119. . Marathon Petroleum
    120. . Financial Overview
    121. . Products Offered
    122. . Key Developments
    123. . SWOT Analysis
    124. . Key Strategies
    125. . PetroChina
    126. . Financial Overview
    127. . Products Offered
    128. . Key Developments
    129. . SWOT Analysis
    130. . Key Strategies
    131. . Shell
    132. . Financial Overview
    133. . Products Offered
    134. . Key Developments
    135. . SWOT Analysis
    136. . Key Strategies
    137. . AirBP
    138. . Financial Overview
    139. . Products Offered
    140. . Key Developments
    141. . SWOT Analysis
    142. . Key Strategies
    143. . Chevron
    144. . Financial Overview
    145. . Products Offered
    146. . Key Developments
    147. . SWOT Analysis
    148. . Key Strategies
    149. . Phillips 66
    150. . Financial Overview
    151. . Products Offered
    152. . Key Developments
    153. . SWOT Analysis
    154. . Key Strategies
    155. . Valero Energy
    156. . Financial Overview
    157. . Products Offered
    158. . Key Developments
    159. . SWOT Analysis
    160. . Key Strategies
    161. . Castrol
    162. . Financial Overview
    163. . Products Offered
    164. . Key Developments
    165. . SWOT Analysis
    166. . Key Strategies
    167. . Energizer Holdings
    168. . Financial Overview
    169. . Products Offered
    170. . Key Developments
    171. . SWOT Analysis
    172. . Key Strategies
    173. . Reliance Industries
    174. . Financial Overview
    175. . Products Offered
    176. . Key Developments
    177. . SWOT Analysis
    178. . Key Strategies
    179. . TotalEnergies
    180. . Financial Overview
    181. . Products Offered
    182. . Key Developments
    183. . SWOT Analysis
    184. . Key Strategies
    185. . British Petroleum
    186. . Financial Overview
    187. . Products Offered
    188. . Key Developments
    189. . SWOT Analysis
    190. . Key Strategies
    191. . SABIC
    192. . Financial Overview
    193. . Products Offered
    194. . Key Developments
    195. . SWOT Analysis
    196. . Key Strategies
    197. . APPENDIX
    198. . References
    199. . Related Reports LIST OF TABLES TABLE
    200. . LIST OF ASSUMPTIONS TABLE
    201. . NORTH AMERICA AVIATION FUEL MARKET SIZE ESTIMATES & FORECAST, BY FUEL TYPE, 2019-2035 (USD BILLIONS) TABLE
    202. . NORTH AMERICA AVIATION FUEL MARKET SIZE ESTIMATES & FORECAST, BY END USE, 2019-2035 (USD BILLIONS) TABLE
    203. . NORTH AMERICA AVIATION FUEL MARKET SIZE ESTIMATES & FORECAST, BY DISTRIBUTION CHANNEL, 2019-2035 (USD BILLIONS) TABLE
    204. . NORTH AMERICA AVIATION FUEL MARKET SIZE ESTIMATES & FORECAST, BY APPLICATION, 2019-2035 (USD BILLIONS) TABLE
    205. . NORTH AMERICA AVIATION FUEL MARKET SIZE ESTIMATES & FORECAST, BY REGIONAL, 2019-2035 (USD BILLIONS) TABLE
    206. . US AVIATION FUEL MARKET SIZE ESTIMATES & FORECAST, BY FUEL TYPE, 2019-2035 (USD BILLIONS) TABLE
    207. . US AVIATION FUEL MARKET SIZE ESTIMATES & FORECAST, BY END USE, 2019-2035 (USD BILLIONS) TABLE
    208. . US AVIATION FUEL MARKET SIZE ESTIMATES & FORECAST, BY DISTRIBUTION CHANNEL, 2019-2035 (USD BILLIONS) TABLE
    209. . US AVIATION FUEL MARKET SIZE ESTIMATES & FORECAST, BY APPLICATION, 2019-2035 (USD BILLIONS) TABLE
    210. . US AVIATION FUEL MARKET SIZE ESTIMATES & FORECAST, BY REGIONAL, 2019-2035 (USD BILLIONS) TABLE
    211. . CANADA AVIATION FUEL MARKET SIZE ESTIMATES & FORECAST, BY FUEL TYPE, 2019-2035 (USD BILLIONS) TABLE
    212. . CANADA AVIATION FUEL MARKET SIZE ESTIMATES & FORECAST, BY END USE, 2019-2035 (USD BILLIONS) TABLE
    213. . CANADA AVIATION FUEL MARKET SIZE ESTIMATES & FORECAST, BY DISTRIBUTION CHANNEL, 2019-2035 (USD BILLIONS) TABLE
    214. . CANADA AVIATION FUEL MARKET SIZE ESTIMATES & FORECAST, BY APPLICATION, 2019-2035 (USD BILLIONS) TABLE
    215. . CANADA AVIATION FUEL MARKET SIZE ESTIMATES & FORECAST, BY REGIONAL, 2019-2035 (USD BILLIONS) TABLE
    216. . EUROPE AVIATION FUEL MARKET SIZE ESTIMATES & FORECAST, BY FUEL TYPE, 2019-2035 (USD BILLIONS) TABLE
    217. . EUROPE AVIATION FUEL MARKET SIZE ESTIMATES & FORECAST, BY END USE, 2019-2035 (USD BILLIONS) TABLE
    218. . EUROPE AVIATION FUEL MARKET SIZE ESTIMATES & FORECAST, BY DISTRIBUTION CHANNEL, 2019-2035 (USD BILLIONS) TABLE
    219. . EUROPE AVIATION FUEL MARKET SIZE ESTIMATES & FORECAST, BY APPLICATION, 2019-2035 (USD BILLIONS) TABLE
    220. . EUROPE AVIATION FUEL MARKET SIZE ESTIMATES & FORECAST, BY REGIONAL, 2019-2035 (USD BILLIONS) TABLE
    221. . GERMANY AVIATION FUEL MARKET SIZE ESTIMATES & FORECAST, BY FUEL TYPE, 2019-2035 (USD BILLIONS) TABLE
    222. . GERMANY AVIATION FUEL MARKET SIZE ESTIMATES & FORECAST, BY END USE, 2019-2035 (USD BILLIONS) TABLE
    223. . GERMANY AVIATION FUEL MARKET SIZE ESTIMATES & FORECAST, BY DISTRIBUTION CHANNEL, 2019-2035 (USD BILLIONS) TABLE
    224. . GERMANY AVIATION FUEL MARKET SIZE ESTIMATES & FORECAST, BY APPLICATION, 2019-2035 (USD BILLIONS) TABLE
    225. . GERMANY AVIATION FUEL MARKET SIZE ESTIMATES & FORECAST, BY REGIONAL, 2019-2035 (USD BILLIONS) TABLE
    226. . UK AVIATION FUEL MARKET SIZE ESTIMATES & FORECAST, BY FUEL TYPE, 2019-2035 (USD BILLIONS) TABLE
    227. . UK AVIATION FUEL MARKET SIZE ESTIMATES & FORECAST, BY END USE, 2019-2035 (USD BILLIONS) TABLE
    228. . UK AVIATION FUEL MARKET SIZE ESTIMATES & FORECAST, BY DISTRIBUTION CHANNEL, 2019-2035 (USD BILLIONS) TABLE
    229. . UK AVIATION FUEL MARKET SIZE ESTIMATES & FORECAST, BY APPLICATION, 2019-2035 (USD BILLIONS) TABLE
    230. . UK AVIATION FUEL MARKET SIZE ESTIMATES & FORECAST, BY REGIONAL, 2019-2035 (USD BILLIONS) TABLE
    231. . FRANCE AVIATION FUEL MARKET SIZE ESTIMATES & FORECAST, BY FUEL TYPE, 2019-2035 (USD BILLIONS) TABLE
    232. . FRANCE AVIATION FUEL MARKET SIZE ESTIMATES & FORECAST, BY END USE, 2019-2035 (USD BILLIONS) TABLE
    233. . FRANCE AVIATION FUEL MARKET SIZE ESTIMATES & FORECAST, BY DISTRIBUTION CHANNEL, 2019-2035 (USD BILLIONS) TABLE
    234. . FRANCE AVIATION FUEL MARKET SIZE ESTIMATES & FORECAST, BY APPLICATION, 2019-2035 (USD BILLIONS) TABLE
    235. . FRANCE AVIATION FUEL MARKET SIZE ESTIMATES & FORECAST, BY REGIONAL, 2019-2035 (USD BILLIONS) TABLE
    236. . RUSSIA AVIATION FUEL MARKET SIZE ESTIMATES & FORECAST, BY FUEL TYPE, 2019-2035 (USD BILLIONS) TABLE
    237. . RUSSIA AVIATION FUEL MARKET SIZE ESTIMATES & FORECAST, BY END USE, 2019-2035 (USD BILLIONS) TABLE
    238. . RUSSIA AVIATION FUEL MARKET SIZE ESTIMATES & FORECAST, BY DISTRIBUTION CHANNEL, 2019-2035 (USD BILLIONS) TABLE
    239. . RUSSIA AVIATION FUEL MARKET SIZE ESTIMATES & FORECAST, BY APPLICATION, 2019-2035 (USD BILLIONS) TABLE
    240. . RUSSIA AVIATION FUEL MARKET SIZE ESTIMATES & FORECAST, BY REGIONAL, 2019-2035 (USD BILLIONS) TABLE
    241. . ITALY AVIATION FUEL MARKET SIZE ESTIMATES & FORECAST, BY FUEL TYPE, 2019-2035 (USD BILLIONS) TABLE
    242. . ITALY AVIATION FUEL MARKET SIZE ESTIMATES & FORECAST, BY END USE, 2019-2035 (USD BILLIONS) TABLE
    243. . ITALY AVIATION FUEL MARKET SIZE ESTIMATES & FORECAST, BY DISTRIBUTION CHANNEL, 2019-2035 (USD BILLIONS) TABLE
    244. . ITALY AVIATION FUEL MARKET SIZE ESTIMATES & FORECAST, BY APPLICATION, 2019-2035 (USD BILLIONS) TABLE
    245. . ITALY AVIATION FUEL MARKET SIZE ESTIMATES & FORECAST, BY REGIONAL, 2019-2035 (USD BILLIONS) TABLE
    246. . SPAIN AVIATION FUEL MARKET SIZE ESTIMATES & FORECAST, BY FUEL TYPE, 2019-2035 (USD BILLIONS) TABLE
    247. . SPAIN AVIATION FUEL MARKET SIZE ESTIMATES & FORECAST, BY END USE, 2019-2035 (USD BILLIONS) TABLE
    248. . SPAIN AVIATION FUEL MARKET SIZE ESTIMATES & FORECAST, BY DISTRIBUTION CHANNEL, 2019-2035 (USD BILLIONS) TABLE
    249. . SPAIN AVIATION FUEL MARKET SIZE ESTIMATES & FORECAST, BY APPLICATION, 2019-2035 (USD BILLIONS) TABLE
    250. . SPAIN AVIATION FUEL MARKET SIZE ESTIMATES & FORECAST, BY REGIONAL, 2019-2035 (USD BILLIONS) TABLE
    251. . REST OF EUROPE AVIATION FUEL MARKET SIZE ESTIMATES & FORECAST, BY FUEL TYPE, 2019-2035 (USD BILLIONS) TABLE
    252. . REST OF EUROPE AVIATION FUEL MARKET SIZE ESTIMATES & FORECAST, BY END USE, 2019-2035 (USD BILLIONS) TABLE
    253. . REST OF EUROPE AVIATION FUEL MARKET SIZE ESTIMATES & FORECAST, BY DISTRIBUTION CHANNEL, 2019-2035 (USD BILLIONS) TABLE
    254. . REST OF EUROPE AVIATION FUEL MARKET SIZE ESTIMATES & FORECAST, BY APPLICATION, 2019-2035 (USD BILLIONS) TABLE
    255. . REST OF EUROPE AVIATION FUEL MARKET SIZE ESTIMATES & FORECAST, BY REGIONAL, 2019-2035 (USD BILLIONS) TABLE
    256. . APAC AVIATION FUEL MARKET SIZE ESTIMATES & FORECAST, BY FUEL TYPE, 2019-2035 (USD BILLIONS) TABLE
    257. . APAC AVIATION FUEL MARKET SIZE ESTIMATES & FORECAST, BY END USE, 2019-2035 (USD BILLIONS) TABLE
    258. . APAC AVIATION FUEL MARKET SIZE ESTIMATES & FORECAST, BY DISTRIBUTION CHANNEL, 2019-2035 (USD BILLIONS) TABLE
    259. . APAC AVIATION FUEL MARKET SIZE ESTIMATES & FORECAST, BY APPLICATION, 2019-2035 (USD BILLIONS) TABLE
    260. . APAC AVIATION FUEL MARKET SIZE ESTIMATES & FORECAST, BY REGIONAL, 2019-2035 (USD BILLIONS) TABLE
    261. . CHINA AVIATION FUEL MARKET SIZE ESTIMATES & FORECAST, BY FUEL TYPE, 2019-2035 (USD BILLIONS) TABLE
    262. . CHINA AVIATION FUEL MARKET SIZE ESTIMATES & FORECAST, BY END USE, 2019-2035 (USD BILLIONS) TABLE
    263. . CHINA AVIATION FUEL MARKET SIZE ESTIMATES & FORECAST, BY DISTRIBUTION CHANNEL, 2019-2035 (USD BILLIONS) TABLE
    264. . CHINA AVIATION FUEL MARKET SIZE ESTIMATES & FORECAST, BY APPLICATION, 2019-2035 (USD BILLIONS) TABLE
    265. . CHINA AVIATION FUEL MARKET SIZE ESTIMATES & FORECAST, BY REGIONAL, 2019-2035 (USD BILLIONS) TABLE
    266. . INDIA AVIATION FUEL MARKET SIZE ESTIMATES & FORECAST, BY FUEL TYPE, 2019-2035 (USD BILLIONS) TABLE
    267. . INDIA AVIATION FUEL MARKET SIZE ESTIMATES & FORECAST, BY END USE, 2019-2035 (USD BILLIONS) TABLE
    268. . INDIA AVIATION FUEL MARKET SIZE ESTIMATES & FORECAST, BY DISTRIBUTION CHANNEL, 2019-2035 (USD BILLIONS) TABLE
    269. . INDIA AVIATION FUEL MARKET SIZE ESTIMATES & FORECAST, BY APPLICATION, 2019-2035 (USD BILLIONS) TABLE
    270. . INDIA AVIATION FUEL MARKET SIZE ESTIMATES & FORECAST, BY REGIONAL, 2019-2035 (USD BILLIONS) TABLE
    271. . JAPAN AVIATION FUEL MARKET SIZE ESTIMATES & FORECAST, BY FUEL TYPE, 2019-2035 (USD BILLIONS) TABLE
    272. . JAPAN AVIATION FUEL MARKET SIZE ESTIMATES & FORECAST, BY END USE, 2019-2035 (USD BILLIONS) TABLE
    273. . JAPAN AVIATION FUEL MARKET SIZE ESTIMATES & FORECAST, BY DISTRIBUTION CHANNEL, 2019-2035 (USD BILLIONS) TABLE
    274. . JAPAN AVIATION FUEL MARKET SIZE ESTIMATES & FORECAST, BY APPLICATION, 2019-2035 (USD BILLIONS) TABLE
    275. . JAPAN AVIATION FUEL MARKET SIZE ESTIMATES & FORECAST, BY REGIONAL, 2019-2035 (USD BILLIONS) TABLE
    276. . SOUTH KOREA AVIATION FUEL MARKET SIZE ESTIMATES & FORECAST, BY FUEL TYPE, 2019-2035 (USD BILLIONS) TABLE
    277. . SOUTH KOREA AVIATION FUEL MARKET SIZE ESTIMATES & FORECAST, BY END USE, 2019-2035 (USD BILLIONS) TABLE
    278. . SOUTH KOREA AVIATION FUEL MARKET SIZE ESTIMATES & FORECAST, BY DISTRIBUTION CHANNEL, 2019-2035 (USD BILLIONS) TABLE
    279. . SOUTH KOREA AVIATION FUEL MARKET SIZE ESTIMATES & FORECAST, BY APPLICATION, 2019-2035 (USD BILLIONS) TABLE
    280. . SOUTH KOREA AVIATION FUEL MARKET SIZE ESTIMATES & FORECAST, BY REGIONAL, 2019-2035 (USD BILLIONS) TABLE
    281. . MALAYSIA AVIATION FUEL MARKET SIZE ESTIMATES & FORECAST, BY FUEL TYPE, 2019-2035 (USD BILLIONS) TABLE
    282. . MALAYSIA AVIATION FUEL MARKET SIZE ESTIMATES & FORECAST, BY END USE, 2019-2035 (USD BILLIONS) TABLE
    283. . MALAYSIA AVIATION FUEL MARKET SIZE ESTIMATES & FORECAST, BY DISTRIBUTION CHANNEL, 2019-2035 (USD BILLIONS) TABLE
    284. . MALAYSIA AVIATION FUEL MARKET SIZE ESTIMATES & FORECAST, BY APPLICATION, 2019-2035 (USD BILLIONS) TABLE
    285. . MALAYSIA AVIATION FUEL MARKET SIZE ESTIMATES & FORECAST, BY REGIONAL, 2019-2035 (USD BILLIONS) TABLE
    286. . THAILAND AVIATION FUEL MARKET SIZE ESTIMATES & FORECAST, BY FUEL TYPE, 2019-2035 (USD BILLIONS) TABLE
    287. . THAILAND AVIATION FUEL MARKET SIZE ESTIMATES & FORECAST, BY END USE, 2019-2035 (USD BILLIONS) TABLE
    288. . THAILAND AVIATION FUEL MARKET SIZE ESTIMATES & FORECAST, BY DISTRIBUTION CHANNEL, 2019-2035 (USD BILLIONS) TABLE
    289. . THAILAND AVIATION FUEL MARKET SIZE ESTIMATES & FORECAST, BY APPLICATION, 2019-2035 (USD BILLIONS) TABLE
    290. . THAILAND AVIATION FUEL MARKET SIZE ESTIMATES & FORECAST, BY REGIONAL, 2019-2035 (USD BILLIONS) TABLE
    291. . INDONESIA AVIATION FUEL MARKET SIZE ESTIMATES & FORECAST, BY FUEL TYPE, 2019-2035 (USD BILLIONS) TABLE
    292. . INDONESIA AVIATION FUEL MARKET SIZE ESTIMATES & FORECAST, BY END USE, 2019-2035 (USD BILLIONS) TABLE
    293. . INDONESIA AVIATION FUEL MARKET SIZE ESTIMATES & FORECAST, BY DISTRIBUTION CHANNEL, 2019-2035 (USD BILLIONS) TABLE
    294. . INDONESIA AVIATION FUEL MARKET SIZE ESTIMATES & FORECAST, BY APPLICATION, 2019-2035 (USD BILLIONS) TABLE
    295. . INDONESIA AVIATION FUEL MARKET SIZE ESTIMATES & FORECAST, BY REGIONAL, 2019-2035 (USD BILLIONS) TABLE
    296. . REST OF APAC AVIATION FUEL MARKET SIZE ESTIMATES & FORECAST, BY FUEL TYPE, 2019-2035 (USD BILLIONS) TABLE
    297. . REST OF APAC AVIATION FUEL MARKET SIZE ESTIMATES & FORECAST, BY END USE, 2019-2035 (USD BILLIONS) TABLE
    298. . REST OF APAC AVIATION FUEL MARKET SIZE ESTIMATES & FORECAST, BY DISTRIBUTION CHANNEL, 2019-2035 (USD BILLIONS) TABLE
    299. . REST OF APAC AVIATION FUEL MARKET SIZE ESTIMATES & FORECAST, BY APPLICATION, 2019-2035 (USD BILLIONS) TABLE
    300. . REST OF APAC AVIATION FUEL MARKET SIZE ESTIMATES & FORECAST, BY REGIONAL, 2019-2035 (USD BILLIONS) TABLE
    301. . SOUTH AMERICA AVIATION FUEL MARKET SIZE ESTIMATES & FORECAST, BY FUEL TYPE, 2019-2035 (USD BILLIONS) TABLE
    302. . SOUTH AMERICA AVIATION FUEL MARKET SIZE ESTIMATES & FORECAST, BY END USE, 2019-2035 (USD BILLIONS) TABLE
    303. . SOUTH AMERICA AVIATION FUEL MARKET SIZE ESTIMATES & FORECAST, BY DISTRIBUTION CHANNEL, 2019-2035 (USD BILLIONS) TABLE
    304. . SOUTH AMERICA AVIATION FUEL MARKET SIZE ESTIMATES & FORECAST, BY APPLICATION, 2019-2035 (USD BILLIONS) TABLE
    305. . SOUTH AMERICA AVIATION FUEL MARKET SIZE ESTIMATES & FORECAST, BY REGIONAL, 2019-2035 (USD BILLIONS) TABLE
    306. . BRAZIL AVIATION FUEL MARKET SIZE ESTIMATES & FORECAST, BY FUEL TYPE, 2019-2035 (USD BILLIONS) TABLE
    307. . BRAZIL AVIATION FUEL MARKET SIZE ESTIMATES & FORECAST, BY END USE, 2019-2035 (USD BILLIONS) TABLE
    308. . BRAZIL AVIATION FUEL MARKET SIZE ESTIMATES & FORECAST, BY DISTRIBUTION CHANNEL, 2019-2035 (USD BILLIONS) TABLE
    309. . BRAZIL AVIATION FUEL MARKET SIZE ESTIMATES & FORECAST, BY APPLICATION, 2019-2035 (USD BILLIONS) TABLE
    310. . BRAZIL AVIATION FUEL MARKET SIZE ESTIMATES & FORECAST, BY REGIONAL, 2019-2035 (USD BILLIONS) TABLE
    311. . MEXICO AVIATION FUEL MARKET SIZE ESTIMATES & FORECAST, BY FUEL TYPE, 2019-2035 (USD BILLIONS) TABLE
    312. . MEXICO AVIATION FUEL MARKET SIZE ESTIMATES & FORECAST, BY END USE, 2019-2035 (USD BILLIONS) TABLE
    313. . MEXICO AVIATION FUEL MARKET SIZE ESTIMATES & FORECAST, BY DISTRIBUTION CHANNEL, 2019-2035 (USD BILLIONS) TABLE
    314. . MEXICO AVIATION FUEL MARKET SIZE ESTIMATES & FORECAST, BY APPLICATION, 2019-2035 (USD BILLIONS) TABLE
    315. . MEXICO AVIATION FUEL MARKET SIZE ESTIMATES & FORECAST, BY REGIONAL, 2019-2035 (USD BILLIONS) TABLE
    316. . ARGENTINA AVIATION FUEL MARKET SIZE ESTIMATES & FORECAST, BY FUEL TYPE, 2019-2035 (USD BILLIONS) TABLE
    317. . ARGENTINA AVIATION FUEL MARKET SIZE ESTIMATES & FORECAST, BY END USE, 2019-2035 (USD BILLIONS) TABLE
    318. . ARGENTINA AVIATION FUEL MARKET SIZE ESTIMATES & FORECAST, BY DISTRIBUTION CHANNEL, 2019-2035 (USD BILLIONS) TABLE
    319. . ARGENTINA AVIATION FUEL MARKET SIZE ESTIMATES & FORECAST, BY APPLICATION, 2019-2035 (USD BILLIONS) TABLE
    320. . ARGENTINA AVIATION FUEL MARKET SIZE ESTIMATES & FORECAST, BY REGIONAL, 2019-2035 (USD BILLIONS) TABLE
    321. . REST OF SOUTH AMERICA AVIATION FUEL MARKET SIZE ESTIMATES & FORECAST, BY FUEL TYPE, 2019-2035 (USD BILLIONS) TABLE
    322. . REST OF SOUTH AMERICA AVIATION FUEL MARKET SIZE ESTIMATES & FORECAST, BY END USE, 2019-2035 (USD BILLIONS) TABLE
    323. . REST OF SOUTH AMERICA AVIATION FUEL MARKET SIZE ESTIMATES & FORECAST, BY DISTRIBUTION CHANNEL, 2019-2035 (USD BILLIONS) TABLE
    324. . REST OF SOUTH AMERICA AVIATION FUEL MARKET SIZE ESTIMATES & FORECAST, BY APPLICATION, 2019-2035 (USD BILLIONS) TABLE
    325. . REST OF SOUTH AMERICA AVIATION FUEL MARKET SIZE ESTIMATES & FORECAST, BY REGIONAL, 2019-2035 (USD BILLIONS) TABLE
    326. . MEA AVIATION FUEL MARKET SIZE ESTIMATES & FORECAST, BY FUEL TYPE, 2019-2035 (USD BILLIONS) TABLE
    327. . MEA AVIATION FUEL MARKET SIZE ESTIMATES & FORECAST, BY END USE, 2019-2035 (USD BILLIONS) TABLE
    328. . MEA AVIATION FUEL MARKET SIZE ESTIMATES & FORECAST, BY DISTRIBUTION CHANNEL, 2019-2035 (USD BILLIONS) TABLE
    329. . MEA AVIATION FUEL MARKET SIZE ESTIMATES & FORECAST, BY APPLICATION, 2019-2035 (USD BILLIONS) TABLE
    330. . MEA AVIATION FUEL MARKET SIZE ESTIMATES & FORECAST, BY REGIONAL, 2019-2035 (USD BILLIONS) TABLE
    331. . GCC COUNTRIES AVIATION FUEL MARKET SIZE ESTIMATES & FORECAST, BY FUEL TYPE, 2019-2035 (USD BILLIONS) TABLE
    332. . GCC COUNTRIES AVIATION FUEL MARKET SIZE ESTIMATES & FORECAST, BY END USE, 2019-2035 (USD BILLIONS) TABLE
    333. . GCC COUNTRIES AVIATION FUEL MARKET SIZE ESTIMATES & FORECAST, BY DISTRIBUTION CHANNEL, 2019-2035 (USD BILLIONS) TABLE
    334. . GCC COUNTRIES AVIATION FUEL MARKET SIZE ESTIMATES & FORECAST, BY APPLICATION, 2019-2035 (USD BILLIONS) TABLE
    335. . GCC COUNTRIES AVIATION FUEL MARKET SIZE ESTIMATES & FORECAST, BY REGIONAL, 2019-2035 (USD BILLIONS) TABLE
    336. . SOUTH AFRICA AVIATION FUEL MARKET SIZE ESTIMATES & FORECAST, BY FUEL TYPE, 2019-2035 (USD BILLIONS) TABLE
    337. . SOUTH AFRICA AVIATION FUEL MARKET SIZE ESTIMATES & FORECAST, BY END USE, 2019-2035 (USD BILLIONS) TABLE
    338. . SOUTH AFRICA AVIATION FUEL MARKET SIZE ESTIMATES & FORECAST, BY DISTRIBUTION CHANNEL, 2019-2035 (USD BILLIONS) TABLE
    339. . SOUTH AFRICA AVIATION FUEL MARKET SIZE ESTIMATES & FORECAST, BY APPLICATION, 2019-2035 (USD BILLIONS) TABLE
    340. . SOUTH AFRICA AVIATION FUEL MARKET SIZE ESTIMATES & FORECAST, BY REGIONAL, 2019-2035 (USD BILLIONS) TABLE
    341. . REST OF MEA AVIATION FUEL MARKET SIZE ESTIMATES & FORECAST, BY FUEL TYPE, 2019-2035 (USD BILLIONS) TABLE
    342. . REST OF MEA AVIATION FUEL MARKET SIZE ESTIMATES & FORECAST, BY END USE, 2019-2035 (USD BILLIONS) TABLE
    343. . REST OF MEA AVIATION FUEL MARKET SIZE ESTIMATES & FORECAST, BY DISTRIBUTION CHANNEL, 2019-2035 (USD BILLIONS) TABLE
    344. . REST OF MEA AVIATION FUEL MARKET SIZE ESTIMATES & FORECAST, BY APPLICATION, 2019-2035 (USD BILLIONS) TABLE
    345. . REST OF MEA AVIATION FUEL MARKET SIZE ESTIMATES & FORECAST, BY REGIONAL, 2019-2035 (USD BILLIONS) TABLE
    346. . PRODUCT LAUNCH/PRODUCT DEVELOPMENT/APPROVAL TABLE
    347. . ACQUISITION/PARTNERSHIP   LIST OF FIGURES FIGURE
    348. . MARKET SYNOPSIS FIGURE
    349. . NORTH AMERICA AVIATION FUEL MARKET ANALYSIS FIGURE
    350. . US AVIATION FUEL MARKET ANALYSIS BY FUEL TYPE FIGURE
    351. . US AVIATION FUEL MARKET ANALYSIS BY END USE FIGURE
    352. . US AVIATION FUEL MARKET ANALYSIS BY DISTRIBUTION CHANNEL FIGURE
    353. . US AVIATION FUEL MARKET ANALYSIS BY APPLICATION FIGURE
    354. . US AVIATION FUEL MARKET ANALYSIS BY REGIONAL FIGURE
    355. . CANADA AVIATION FUEL MARKET ANALYSIS BY FUEL TYPE FIGURE
    356. . CANADA AVIATION FUEL MARKET ANALYSIS BY END USE FIGURE
    357. . CANADA AVIATION FUEL MARKET ANALYSIS BY DISTRIBUTION CHANNEL FIGURE
    358. . CANADA AVIATION FUEL MARKET ANALYSIS BY APPLICATION FIGURE
    359. . CANADA AVIATION FUEL MARKET ANALYSIS BY REGIONAL FIGURE
    360. . EUROPE AVIATION FUEL MARKET ANALYSIS FIGURE
    361. . GERMANY AVIATION FUEL MARKET ANALYSIS BY FUEL TYPE FIGURE
    362. . GERMANY AVIATION FUEL MARKET ANALYSIS BY END USE FIGURE
    363. . GERMANY AVIATION FUEL MARKET ANALYSIS BY DISTRIBUTION CHANNEL FIGURE
    364. . GERMANY AVIATION FUEL MARKET ANALYSIS BY APPLICATION FIGURE
    365. . GERMANY AVIATION FUEL MARKET ANALYSIS BY REGIONAL FIGURE
    366. . UK AVIATION FUEL MARKET ANALYSIS BY FUEL TYPE FIGURE
    367. . UK AVIATION FUEL MARKET ANALYSIS BY END USE FIGURE
    368. . UK AVIATION FUEL MARKET ANALYSIS BY DISTRIBUTION CHANNEL FIGURE
    369. . UK AVIATION FUEL MARKET ANALYSIS BY APPLICATION FIGURE
    370. . UK AVIATION FUEL MARKET ANALYSIS BY REGIONAL FIGURE
    371. . FRANCE AVIATION FUEL MARKET ANALYSIS BY FUEL TYPE FIGURE
    372. . FRANCE AVIATION FUEL MARKET ANALYSIS BY END USE FIGURE
    373. . FRANCE AVIATION FUEL MARKET ANALYSIS BY DISTRIBUTION CHANNEL FIGURE
    374. . FRANCE AVIATION FUEL MARKET ANALYSIS BY APPLICATION FIGURE
    375. . FRANCE AVIATION FUEL MARKET ANALYSIS BY REGIONAL FIGURE
    376. . RUSSIA AVIATION FUEL MARKET ANALYSIS BY FUEL TYPE FIGURE
    377. . RUSSIA AVIATION FUEL MARKET ANALYSIS BY END USE FIGURE
    378. . RUSSIA AVIATION FUEL MARKET ANALYSIS BY DISTRIBUTION CHANNEL FIGURE
    379. . RUSSIA AVIATION FUEL MARKET ANALYSIS BY APPLICATION FIGURE
    380. . RUSSIA AVIATION FUEL MARKET ANALYSIS BY REGIONAL FIGURE
    381. . ITALY AVIATION FUEL MARKET ANALYSIS BY FUEL TYPE FIGURE
    382. . ITALY AVIATION FUEL MARKET ANALYSIS BY END USE FIGURE
    383. . ITALY AVIATION FUEL MARKET ANALYSIS BY DISTRIBUTION CHANNEL FIGURE
    384. . ITALY AVIATION FUEL MARKET ANALYSIS BY APPLICATION FIGURE
    385. . ITALY AVIATION FUEL MARKET ANALYSIS BY REGIONAL FIGURE
    386. . SPAIN AVIATION FUEL MARKET ANALYSIS BY FUEL TYPE FIGURE
    387. . SPAIN AVIATION FUEL MARKET ANALYSIS BY END USE FIGURE
    388. . SPAIN AVIATION FUEL MARKET ANALYSIS BY DISTRIBUTION CHANNEL FIGURE
    389. . SPAIN AVIATION FUEL MARKET ANALYSIS BY APPLICATION FIGURE
    390. . SPAIN AVIATION FUEL MARKET ANALYSIS BY REGIONAL FIGURE
    391. . REST OF EUROPE AVIATION FUEL MARKET ANALYSIS BY FUEL TYPE FIGURE
    392. . REST OF EUROPE AVIATION FUEL MARKET ANALYSIS BY END USE FIGURE
    393. . REST OF EUROPE AVIATION FUEL MARKET ANALYSIS BY DISTRIBUTION CHANNEL FIGURE
    394. . REST OF EUROPE AVIATION FUEL MARKET ANALYSIS BY APPLICATION FIGURE
    395. . REST OF EUROPE AVIATION FUEL MARKET ANALYSIS BY REGIONAL FIGURE
    396. . APAC AVIATION FUEL MARKET ANALYSIS FIGURE
    397. . CHINA AVIATION FUEL MARKET ANALYSIS BY FUEL TYPE FIGURE
    398. . CHINA AVIATION FUEL MARKET ANALYSIS BY END USE FIGURE
    399. . CHINA AVIATION FUEL MARKET ANALYSIS BY DISTRIBUTION CHANNEL FIGURE
    400. . CHINA AVIATION FUEL MARKET ANALYSIS BY APPLICATION FIGURE
    401. . CHINA AVIATION FUEL MARKET ANALYSIS BY REGIONAL FIGURE
    402. . INDIA AVIATION FUEL MARKET ANALYSIS BY FUEL TYPE FIGURE
    403. . INDIA AVIATION FUEL MARKET ANALYSIS BY END USE FIGURE
    404. . INDIA AVIATION FUEL MARKET ANALYSIS BY DISTRIBUTION CHANNEL FIGURE
    405. . INDIA AVIATION FUEL MARKET ANALYSIS BY APPLICATION FIGURE
    406. . INDIA AVIATION FUEL MARKET ANALYSIS BY REGIONAL FIGURE
    407. . JAPAN AVIATION FUEL MARKET ANALYSIS BY FUEL TYPE FIGURE
    408. . JAPAN AVIATION FUEL MARKET ANALYSIS BY END USE FIGURE
    409. . JAPAN AVIATION FUEL MARKET ANALYSIS BY DISTRIBUTION CHANNEL FIGURE
    410. . JAPAN AVIATION FUEL MARKET ANALYSIS BY APPLICATION FIGURE
    411. . JAPAN AVIATION FUEL MARKET ANALYSIS BY REGIONAL FIGURE
    412. . SOUTH KOREA AVIATION FUEL MARKET ANALYSIS BY FUEL TYPE FIGURE
    413. . SOUTH KOREA AVIATION FUEL MARKET ANALYSIS BY END USE FIGURE
    414. . SOUTH KOREA AVIATION FUEL MARKET ANALYSIS BY DISTRIBUTION CHANNEL FIGURE
    415. . SOUTH KOREA AVIATION FUEL MARKET ANALYSIS BY APPLICATION FIGURE
    416. . SOUTH KOREA AVIATION FUEL MARKET ANALYSIS BY REGIONAL FIGURE
    417. . MALAYSIA AVIATION FUEL MARKET ANALYSIS BY FUEL TYPE FIGURE
    418. . MALAYSIA AVIATION FUEL MARKET ANALYSIS BY END USE FIGURE
    419. . MALAYSIA AVIATION FUEL MARKET ANALYSIS BY DISTRIBUTION CHANNEL FIGURE
    420. . MALAYSIA AVIATION FUEL MARKET ANALYSIS BY APPLICATION FIGURE
    421. . MALAYSIA AVIATION FUEL MARKET ANALYSIS BY REGIONAL FIGURE
    422. . THAILAND AVIATION FUEL MARKET ANALYSIS BY FUEL TYPE FIGURE
    423. . THAILAND AVIATION FUEL MARKET ANALYSIS BY END USE FIGURE
    424. . THAILAND AVIATION FUEL MARKET ANALYSIS BY DISTRIBUTION CHANNEL FIGURE
    425. . THAILAND AVIATION FUEL MARKET ANALYSIS BY APPLICATION FIGURE
    426. . THAILAND AVIATION FUEL MARKET ANALYSIS BY REGIONAL FIGURE
    427. . INDONESIA AVIATION FUEL MARKET ANALYSIS BY FUEL TYPE FIGURE
    428. . INDONESIA AVIATION FUEL MARKET ANALYSIS BY END USE FIGURE
    429. . INDONESIA AVIATION FUEL MARKET ANALYSIS BY DISTRIBUTION CHANNEL FIGURE
    430. . INDONESIA AVIATION FUEL MARKET ANALYSIS BY APPLICATION FIGURE
    431. . INDONESIA AVIATION FUEL MARKET ANALYSIS BY REGIONAL FIGURE
    432. . REST OF APAC AVIATION FUEL MARKET ANALYSIS BY FUEL TYPE FIGURE
    433. . REST OF APAC AVIATION FUEL MARKET ANALYSIS BY END USE FIGURE
    434. . REST OF APAC AVIATION FUEL MARKET ANALYSIS BY DISTRIBUTION CHANNEL FIGURE
    435. . REST OF APAC AVIATION FUEL MARKET ANALYSIS BY APPLICATION FIGURE
    436. . REST OF APAC AVIATION FUEL MARKET ANALYSIS BY REGIONAL FIGURE
    437. . SOUTH AMERICA AVIATION FUEL MARKET ANALYSIS FIGURE
    438. . BRAZIL AVIATION FUEL MARKET ANALYSIS BY FUEL TYPE FIGURE
    439. . BRAZIL AVIATION FUEL MARKET ANALYSIS BY END USE FIGURE
    440. . BRAZIL AVIATION FUEL MARKET ANALYSIS BY DISTRIBUTION CHANNEL FIGURE
    441. . BRAZIL AVIATION FUEL MARKET ANALYSIS BY APPLICATION FIGURE
    442. . BRAZIL AVIATION FUEL MARKET ANALYSIS BY REGIONAL FIGURE
    443. . MEXICO AVIATION FUEL MARKET ANALYSIS BY FUEL TYPE FIGURE
    444. . MEXICO AVIATION FUEL MARKET ANALYSIS BY END USE FIGURE
    445. . MEXICO AVIATION FUEL MARKET ANALYSIS BY DISTRIBUTION CHANNEL FIGURE
    446. . MEXICO AVIATION FUEL MARKET ANALYSIS BY APPLICATION FIGURE
    447. . MEXICO AVIATION FUEL MARKET ANALYSIS BY REGIONAL FIGURE
    448. . ARGENTINA AVIATION FUEL MARKET ANALYSIS BY FUEL TYPE FIGURE
    449. . ARGENTINA AVIATION FUEL MARKET ANALYSIS BY END USE FIGURE
    450. . ARGENTINA AVIATION FUEL MARKET ANALYSIS BY DISTRIBUTION CHANNEL FIGURE
    451. . ARGENTINA AVIATION FUEL MARKET ANALYSIS BY APPLICATION FIGURE
    452. . ARGENTINA AVIATION FUEL MARKET ANALYSIS BY REGIONAL FIGURE
    453. . REST OF SOUTH AMERICA AVIATION FUEL MARKET ANALYSIS BY FUEL TYPE FIGURE
    454. . REST OF SOUTH AMERICA AVIATION FUEL MARKET ANALYSIS BY END USE FIGURE
    455. . REST OF SOUTH AMERICA AVIATION FUEL MARKET ANALYSIS BY DISTRIBUTION CHANNEL FIGURE
    456. . REST OF SOUTH AMERICA AVIATION FUEL MARKET ANALYSIS BY APPLICATION FIGURE
    457. . REST OF SOUTH AMERICA AVIATION FUEL MARKET ANALYSIS BY REGIONAL FIGURE
    458. . MEA AVIATION FUEL MARKET ANALYSIS FIGURE
    459. . GCC COUNTRIES AVIATION FUEL MARKET ANALYSIS BY FUEL TYPE FIGURE
    460. . GCC COUNTRIES AVIATION FUEL MARKET ANALYSIS BY END USE FIGURE
    461. . GCC COUNTRIES AVIATION FUEL MARKET ANALYSIS BY DISTRIBUTION CHANNEL FIGURE
    462. . GCC COUNTRIES AVIATION FUEL MARKET ANALYSIS BY APPLICATION FIGURE
    463. . GCC COUNTRIES AVIATION FUEL MARKET ANALYSIS BY REGIONAL FIGURE
    464. . SOUTH AFRICA AVIATION FUEL MARKET ANALYSIS BY FUEL TYPE FIGURE
    465. . SOUTH AFRICA AVIATION FUEL MARKET ANALYSIS BY END USE FIGURE
    466. . SOUTH AFRICA AVIATION FUEL MARKET ANALYSIS BY DISTRIBUTION CHANNEL FIGURE
    467. . SOUTH AFRICA AVIATION FUEL MARKET ANALYSIS BY APPLICATION FIGURE
    468. . SOUTH AFRICA AVIATION FUEL MARKET ANALYSIS BY REGIONAL FIGURE
    469. . REST OF MEA AVIATION FUEL MARKET ANALYSIS BY FUEL TYPE FIGURE
    470. . REST OF MEA AVIATION FUEL MARKET ANALYSIS BY END USE FIGURE
    471. . REST OF MEA AVIATION FUEL MARKET ANALYSIS BY DISTRIBUTION CHANNEL FIGURE
    472. . REST OF MEA AVIATION FUEL MARKET ANALYSIS BY APPLICATION FIGURE
    473. . REST OF MEA AVIATION FUEL MARKET ANALYSIS BY REGIONAL FIGURE
    474. . KEY BUYING CRITERIA OF AVIATION FUEL MARKET FIGURE
    475. . RESEARCH PROCESS OF MRFR FIGURE
    476. . DRO ANALYSIS OF AVIATION FUEL MARKET FIGURE
    477. . DRIVERS IMPACT ANALYSIS: AVIATION FUEL MARKET FIGURE
    478. . RESTRAINTS IMPACT ANALYSIS: AVIATION FUEL MARKET FIGURE
    479. . SUPPLY / VALUE CHAIN: AVIATION FUEL MARKET FIGURE
    480. . AVIATION FUEL MARKET, BY FUEL TYPE, 2025 (% SHARE) FIGURE
    481. . AVIATION FUEL MARKET, BY FUEL TYPE, 2019 TO 2035 (USD Billions) FIGURE
    482. . AVIATION FUEL MARKET, BY END USE, 2025 (% SHARE) FIGURE
    483. . AVIATION FUEL MARKET, BY END USE, 2019 TO 2035 (USD Billions) FIGURE
    484. . AVIATION FUEL MARKET, BY DISTRIBUTION CHANNEL, 2025 (% SHARE) FIGURE
    485. . AVIATION FUEL MARKET, BY DISTRIBUTION CHANNEL, 2019 TO 2035 (USD Billions) FIGURE
    486. . AVIATION FUEL MARKET, BY APPLICATION, 2025 (% SHARE) FIGURE
    487. . AVIATION FUEL MARKET, BY APPLICATION, 2019 TO 2035 (USD Billions) FIGURE
    488. . AVIATION FUEL MARKET, BY REGIONAL, 2025 (% SHARE) FIGURE
    489. . AVIATION FUEL MARKET, BY REGIONAL, 2019 TO 2035 (USD Billions) FIGURE
    490. . BENCHMARKING OF MAJOR COMPETITORS
    491. List of Tables and Figures
      1. Table FIGURE 1. MARKET SYNOPSIS FIGURE 2. NORTH AMERICA AVIATION FUEL MARKET ANALYSIS FIGURE 3. US AVIATION FUEL MARKET ANALYSIS BY FUEL TYPE FIGURE 4. US AVIATION FUEL MARKET ANALYSIS BY END USE FIGURE 5. US AVIATION FUEL MARKET ANALYSIS BY DISTRIBUTION CHANNEL FIGURE 6. US AVIATION FUEL MARKET ANALYSIS BY APPLICATION FIGURE 7. US AVIATION FUEL MARKET ANALYSIS BY REGIONAL FIGURE 8. CANADA AVIATION FUEL MARKET ANALYSIS BY FUEL TYPE FIGURE 9. CANADA AVIATION FUEL MARKET ANALYSIS BY END USE FIGURE 10. CANADA AVIATION FUEL MARKET ANALYSIS BY DISTRIBUTION CHANNEL FIGURE 11. CANADA AVIATION FUEL MARKET ANALYSIS BY APPLICATION FIGURE 12. CANADA AVIATION FUEL MARKET ANALYSIS BY REGIONAL FIGURE 13. EUROPE AVIATION FUEL MARKET ANALYSIS FIGURE 14. GERMANY AVIATION FUEL MARKET ANALYSIS BY FUEL TYPE FIGURE 15. GERMANY AVIATION FUEL MARKET ANALYSIS BY END USE FIGURE 16. GERMANY AVIATION FUEL MARKET ANALYSIS BY DISTRIBUTION CHANNEL FIGURE 17. GERMANY AVIATION FUEL MARKET ANALYSIS BY APPLICATION FIGURE 18. GERMANY AVIATION FUEL MARKET ANALYSIS BY REGIONAL FIGURE 19. UK AVIATION FUEL MARKET ANALYSIS BY FUEL TYPE FIGURE 20. UK AVIATION FUEL MARKET ANALYSIS BY END USE FIGURE 21. UK AVIATION FUEL MARKET ANALYSIS BY DISTRIBUTION CHANNEL FIGURE 22. UK AVIATION FUEL MARKET ANALYSIS BY APPLICATION FIGURE 23. UK AVIATION FUEL MARKET ANALYSIS BY REGIONAL FIGURE 24. FRANCE AVIATION FUEL MARKET ANALYSIS BY FUEL TYPE FIGURE 25. FRANCE AVIATION FUEL MARKET ANALYSIS BY END USE FIGURE 26. FRANCE AVIATION FUEL MARKET ANALYSIS BY DISTRIBUTION CHANNEL FIGURE 27. FRANCE AVIATION FUEL MARKET ANALYSIS BY APPLICATION FIGURE 28. FRANCE AVIATION FUEL MARKET ANALYSIS BY REGIONAL FIGURE 29. RUSSIA AVIATION FUEL MARKET ANALYSIS BY FUEL TYPE FIGURE 30. RUSSIA AVIATION FUEL MARKET ANALYSIS BY END USE FIGURE 31. RUSSIA AVIATION FUEL MARKET ANALYSIS BY DISTRIBUTION CHANNEL FIGURE 32. RUSSIA AVIATION FUEL MARKET ANALYSIS BY APPLICATION FIGURE 33. RUSSIA AVIATION FUEL MARKET ANALYSIS BY REGIONAL FIGURE 34. ITALY AVIATION FUEL MARKET ANALYSIS BY FUEL TYPE FIGURE 35. ITALY AVIATION FUEL MARKET ANALYSIS BY END USE FIGURE 36. ITALY AVIATION FUEL MARKET ANALYSIS BY DISTRIBUTION CHANNEL FIGURE 37. ITALY AVIATION FUEL MARKET ANALYSIS BY APPLICATION FIGURE 38. ITALY AVIATION FUEL MARKET ANALYSIS BY REGIONAL FIGURE 39. SPAIN AVIATION FUEL MARKET ANALYSIS BY FUEL TYPE FIGURE 40. SPAIN AVIATION FUEL MARKET ANALYSIS BY END USE FIGURE 41. SPAIN AVIATION FUEL MARKET ANALYSIS BY DISTRIBUTION CHANNEL FIGURE 42. SPAIN AVIATION FUEL MARKET ANALYSIS BY APPLICATION FIGURE 43. SPAIN AVIATION FUEL MARKET ANALYSIS BY REGIONAL FIGURE 44. REST OF EUROPE AVIATION FUEL MARKET ANALYSIS BY FUEL TYPE FIGURE 45. REST OF EUROPE AVIATION FUEL MARKET ANALYSIS BY END USE FIGURE 46. REST OF EUROPE AVIATION FUEL MARKET ANALYSIS BY DISTRIBUTION CHANNEL FIGURE 47. REST OF EUROPE AVIATION FUEL MARKET ANALYSIS BY APPLICATION FIGURE 48. REST OF EUROPE AVIATION FUEL MARKET ANALYSIS BY REGIONAL FIGURE 49. APAC AVIATION FUEL MARKET ANALYSIS FIGURE 50. CHINA AVIATION FUEL MARKET ANALYSIS BY FUEL TYPE FIGURE 51. CHINA AVIATION FUEL MARKET ANALYSIS BY END USE FIGURE 52. CHINA AVIATION FUEL MARKET ANALYSIS BY DISTRIBUTION CHANNEL FIGURE 53. CHINA AVIATION FUEL MARKET ANALYSIS BY APPLICATION FIGURE 54. CHINA AVIATION FUEL MARKET ANALYSIS BY REGIONAL FIGURE 55. INDIA AVIATION FUEL MARKET ANALYSIS BY FUEL TYPE FIGURE 56. INDIA AVIATION FUEL MARKET ANALYSIS BY END USE FIGURE 57. INDIA AVIATION FUEL MARKET ANALYSIS BY DISTRIBUTION CHANNEL FIGURE 58. INDIA AVIATION FUEL MARKET ANALYSIS BY APPLICATION FIGURE 59. INDIA AVIATION FUEL MARKET ANALYSIS BY REGIONAL FIGURE 60. JAPAN AVIATION FUEL MARKET ANALYSIS BY FUEL TYPE FIGURE 61. JAPAN AVIATION FUEL MARKET ANALYSIS BY END USE FIGURE 62. JAPAN AVIATION FUEL MARKET ANALYSIS BY DISTRIBUTION CHANNEL FIGURE 63. JAPAN AVIATION FUEL MARKET ANALYSIS BY APPLICATION FIGURE 64. JAPAN AVIATION FUEL MARKET ANALYSIS BY REGIONAL FIGURE 65. SOUTH KOREA AVIATION FUEL MARKET ANALYSIS BY FUEL TYPE FIGURE 66. SOUTH KOREA AVIATION FUEL MARKET ANALYSIS BY END USE FIGURE 67. SOUTH KOREA AVIATION FUEL MARKET ANALYSIS BY DISTRIBUTION CHANNEL FIGURE 68. SOUTH KOREA AVIATION FUEL MARKET ANALYSIS BY APPLICATION FIGURE 69. SOUTH KOREA AVIATION FUEL MARKET ANALYSIS BY REGIONAL FIGURE 70. MALAYSIA AVIATION FUEL MARKET ANALYSIS BY FUEL TYPE FIGURE 71. MALAYSIA AVIATION FUEL MARKET ANALYSIS BY END USE FIGURE 72. MALAYSIA AVIATION FUEL MARKET ANALYSIS BY DISTRIBUTION CHANNEL FIGURE 73. MALAYSIA AVIATION FUEL MARKET ANALYSIS BY APPLICATION FIGURE 74. MALAYSIA AVIATION FUEL MARKET ANALYSIS BY REGIONAL FIGURE 75. THAILAND AVIATION FUEL MARKET ANALYSIS BY FUEL TYPE FIGURE 76. THAILAND AVIATION FUEL MARKET ANALYSIS BY END USE FIGURE 77. THAILAND AVIATION FUEL MARKET ANALYSIS BY DISTRIBUTION CHANNEL FIGURE 78. THAILAND AVIATION FUEL MARKET ANALYSIS BY APPLICATION FIGURE 79. THAILAND AVIATION FUEL MARKET ANALYSIS BY REGIONAL FIGURE 80. INDONESIA AVIATION FUEL MARKET ANALYSIS BY FUEL TYPE FIGURE 81. INDONESIA AVIATION FUEL MARKET ANALYSIS BY END USE FIGURE 82. INDONESIA AVIATION FUEL MARKET ANALYSIS BY DISTRIBUTION CHANNEL FIGURE 83. INDONESIA AVIATION FUEL MARKET ANALYSIS BY APPLICATION FIGURE 84. INDONESIA AVIATION FUEL MARKET ANALYSIS BY REGIONAL FIGURE 85. REST OF APAC AVIATION FUEL MARKET ANALYSIS BY FUEL TYPE FIGURE 86. REST OF APAC AVIATION FUEL MARKET ANALYSIS BY END USE FIGURE 87. REST OF APAC AVIATION FUEL MARKET ANALYSIS BY DISTRIBUTION CHANNEL FIGURE 88. REST OF APAC AVIATION FUEL MARKET ANALYSIS BY APPLICATION FIGURE 89. REST OF APAC AVIATION FUEL MARKET ANALYSIS BY REGIONAL FIGURE 90. SOUTH AMERICA AVIATION FUEL MARKET ANALYSIS FIGURE 91. BRAZIL AVIATION FUEL MARKET ANALYSIS BY FUEL TYPE FIGURE 92. BRAZIL AVIATION FUEL MARKET ANALYSIS BY END USE FIGURE 93. BRAZIL AVIATION FUEL MARKET ANALYSIS BY DISTRIBUTION CHANNEL FIGURE 94. BRAZIL AVIATION FUEL MARKET ANALYSIS BY APPLICATION FIGURE 95. BRAZIL AVIATION FUEL MARKET ANALYSIS BY REGIONAL FIGURE 96. MEXICO AVIATION FUEL MARKET ANALYSIS BY FUEL TYPE FIGURE 97. MEXICO AVIATION FUEL MARKET ANALYSIS BY END USE FIGURE 98. MEXICO AVIATION FUEL MARKET ANALYSIS BY DISTRIBUTION CHANNEL FIGURE 99. MEXICO AVIATION FUEL MARKET ANALYSIS BY APPLICATION FIGURE 100. MEXICO AVIATION FUEL MARKET ANALYSIS BY REGIONAL FIGURE 101. ARGENTINA AVIATION FUEL MARKET ANALYSIS BY FUEL TYPE FIGURE 102. ARGENTINA AVIATION FUEL MARKET ANALYSIS BY END USE FIGURE 103. ARGENTINA AVIATION FUEL MARKET ANALYSIS BY DISTRIBUTION CHANNEL FIGURE 104. ARGENTINA AVIATION FUEL MARKET ANALYSIS BY APPLICATION FIGURE 105. ARGENTINA AVIATION FUEL MARKET ANALYSIS BY REGIONAL FIGURE 106. REST OF SOUTH AMERICA AVIATION FUEL MARKET ANALYSIS BY FUEL TYPE FIGURE 107. REST OF SOUTH AMERICA AVIATION FUEL MARKET ANALYSIS BY END USE FIGURE 108. REST OF SOUTH AMERICA AVIATION FUEL MARKET ANALYSIS BY DISTRIBUTION CHANNEL FIGURE 109. REST OF SOUTH AMERICA AVIATION FUEL MARKET ANALYSIS BY APPLICATION FIGURE 110. REST OF SOUTH AMERICA AVIATION FUEL MARKET ANALYSIS BY REGIONAL FIGURE 111. MEA AVIATION FUEL MARKET ANALYSIS FIGURE 112. GCC COUNTRIES AVIATION FUEL MARKET ANALYSIS BY FUEL TYPE FIGURE 113. GCC COUNTRIES AVIATION FUEL MARKET ANALYSIS BY END USE FIGURE 114. GCC COUNTRIES AVIATION FUEL MARKET ANALYSIS BY DISTRIBUTION CHANNEL FIGURE 115. GCC COUNTRIES AVIATION FUEL MARKET ANALYSIS BY APPLICATION FIGURE 116. GCC COUNTRIES AVIATION FUEL MARKET ANALYSIS BY REGIONAL FIGURE 117. SOUTH AFRICA AVIATION FUEL MARKET ANALYSIS BY FUEL TYPE FIGURE 118. SOUTH AFRICA AVIATION FUEL MARKET ANALYSIS BY END USE FIGURE 119. SOUTH AFRICA AVIATION FUEL MARKET ANALYSIS BY DISTRIBUTION CHANNEL FIGURE 120. SOUTH AFRICA AVIATION FUEL MARKET ANALYSIS BY APPLICATION FIGURE 121. SOUTH AFRICA AVIATION FUEL MARKET ANALYSIS BY REGIONAL FIGURE 122. REST OF MEA AVIATION FUEL MARKET ANALYSIS BY FUEL TYPE FIGURE 123. REST OF MEA AVIATION FUEL MARKET ANALYSIS BY END USE FIGURE 124. REST OF MEA AVIATION FUEL MARKET ANALYSIS BY DISTRIBUTION CHANNEL FIGURE 125. REST OF MEA AVIATION FUEL MARKET ANALYSIS BY APPLICATION FIGURE 126. REST OF MEA AVIATION FUEL MARKET ANALYSIS BY REGIONAL FIGURE 127. KEY BUYING CRITERIA OF AVIATION FUEL MARKET FIGURE 128. RESEARCH PROCESS OF MRFR FIGURE 129. DRO ANALYSIS OF AVIATION FUEL MARKET FIGURE 130. DRIVERS IMPACT ANALYSIS: AVIATION FUEL MARKET FIGURE 131. RESTRAINTS IMPACT ANALYSIS: AVIATION FUEL MARKET FIGURE 132. SUPPLY / VALUE CHAIN: AVIATION FUEL MARKET FIGURE 133. AVIATION FUEL MARKET, BY FUEL TYPE, 2025 (% SHARE) FIGURE 134. AVIATION FUEL MARKET, BY FUEL TYPE, 2019 TO 2035 (USD Billions) FIGURE 135. AVIATION FUEL MARKET, BY END USE, 2025 (% SHARE) FIGURE 136. AVIATION FUEL MARKET, BY END USE, 2019 TO 2035 (USD Billions) FIGURE 137. AVIATION FUEL MARKET, BY DISTRIBUTION CHANNEL, 2025 (% SHARE) FIGURE 138. AVIATION FUEL MARKET, BY DISTRIBUTION CHANNEL, 2019 TO 2035 (USD Billions) FIGURE 139. AVIATION FUEL MARKET, BY APPLICATION, 2025 (% SHARE) FIGURE 140. AVIATION FUEL MARKET, BY APPLICATION, 2019 TO 2035 (USD Billions) FIGURE 141. AVIATION FUEL MARKET, BY REGIONAL, 2025 (% SHARE) FIGURE 142. AVIATION FUEL MARKET, BY REGIONAL, 2019 TO 2035 (USD Billions) FIGURE 143. BENCHMARKING OF MAJOR COMPETITORS
    492. Table FIGURE 1. MARKET SYNOPSIS FIGURE 2. NORTH AMERICA AVIATION FUEL MARKET ANALYSIS FIGURE 3. US AVIATION FUEL MARKET ANALYSIS BY FUEL TYPE FIGURE 4. US AVIATION FUEL MARKET ANALYSIS BY END USE FIGURE 5. US AVIATION FUEL MARKET ANALYSIS BY DISTRIBUTION CHANNEL FIGURE 6. US AVIATION FUEL MARKET ANALYSIS BY APPLICATION FIGURE 7. US AVIATION FUEL MARKET ANALYSIS BY REGIONAL FIGURE 8. CANADA AVIATION FUEL MARKET ANALYSIS BY FUEL TYPE FIGURE 9. CANADA AVIATION FUEL MARKET ANALYSIS BY END USE FIGURE 10. CANADA AVIATION FUEL MARKET ANALYSIS BY DISTRIBUTION CHANNEL FIGURE 11. CANADA AVIATION FUEL MARKET ANALYSIS BY APPLICATION FIGURE 12. CANADA AVIATION FUEL MARKET ANALYSIS BY REGIONAL FIGURE 13. EUROPE AVIATION FUEL MARKET ANALYSIS FIGURE 14. GERMANY AVIATION FUEL MARKET ANALYSIS BY FUEL TYPE FIGURE 15. GERMANY AVIATION FUEL MARKET ANALYSIS BY END USE FIGURE 16. GERMANY AVIATION FUEL MARKET ANALYSIS BY DISTRIBUTION CHANNEL FIGURE 17. GERMANY AVIATION FUEL MARKET ANALYSIS BY APPLICATION FIGURE 18. GERMANY AVIATION FUEL MARKET ANALYSIS BY REGIONAL FIGURE 19. UK AVIATION FUEL MARKET ANALYSIS BY FUEL TYPE FIGURE 20. UK AVIATION FUEL MARKET ANALYSIS BY END USE FIGURE 21. UK AVIATION FUEL MARKET ANALYSIS BY DISTRIBUTION CHANNEL FIGURE 22. UK AVIATION FUEL MARKET ANALYSIS BY APPLICATION FIGURE 23. UK AVIATION FUEL MARKET ANALYSIS BY REGIONAL FIGURE 24. FRANCE AVIATION FUEL MARKET ANALYSIS BY FUEL TYPE FIGURE 25. FRANCE AVIATION FUEL MARKET ANALYSIS BY END USE FIGURE 26. FRANCE AVIATION FUEL MARKET ANALYSIS BY DISTRIBUTION CHANNEL FIGURE 27. FRANCE AVIATION FUEL MARKET ANALYSIS BY APPLICATION FIGURE 28. FRANCE AVIATION FUEL MARKET ANALYSIS BY REGIONAL FIGURE 29. RUSSIA AVIATION FUEL MARKET ANALYSIS BY FUEL TYPE FIGURE 30. RUSSIA AVIATION FUEL MARKET ANALYSIS BY END USE FIGURE 31. RUSSIA AVIATION FUEL MARKET ANALYSIS BY DISTRIBUTION CHANNEL FIGURE 32. RUSSIA AVIATION FUEL MARKET ANALYSIS BY APPLICATION FIGURE 33. RUSSIA AVIATION FUEL MARKET ANALYSIS BY REGIONAL FIGURE 34. ITALY AVIATION FUEL MARKET ANALYSIS BY FUEL TYPE FIGURE 35. ITALY AVIATION FUEL MARKET ANALYSIS BY END USE FIGURE 36. ITALY AVIATION FUEL MARKET ANALYSIS BY DISTRIBUTION CHANNEL FIGURE 37. ITALY AVIATION FUEL MARKET ANALYSIS BY APPLICATION FIGURE 38. ITALY AVIATION FUEL MARKET ANALYSIS BY REGIONAL FIGURE 39. SPAIN AVIATION FUEL MARKET ANALYSIS BY FUEL TYPE FIGURE 40. SPAIN AVIATION FUEL MARKET ANALYSIS BY END USE FIGURE 41. SPAIN AVIATION FUEL MARKET ANALYSIS BY DISTRIBUTION CHANNEL FIGURE 42. SPAIN AVIATION FUEL MARKET ANALYSIS BY APPLICATION FIGURE 43. SPAIN AVIATION FUEL MARKET ANALYSIS BY REGIONAL FIGURE 44. REST OF EUROPE AVIATION FUEL MARKET ANALYSIS BY FUEL TYPE FIGURE 45. REST OF EUROPE AVIATION FUEL MARKET ANALYSIS BY END USE FIGURE 46. REST OF EUROPE AVIATION FUEL MARKET ANALYSIS BY DISTRIBUTION CHANNEL FIGURE 47. REST OF EUROPE AVIATION FUEL MARKET ANALYSIS BY APPLICATION FIGURE 48. REST OF EUROPE AVIATION FUEL MARKET ANALYSIS BY REGIONAL FIGURE 49. APAC AVIATION FUEL MARKET ANALYSIS FIGURE 50. CHINA AVIATION FUEL MARKET ANALYSIS BY FUEL TYPE FIGURE 51. CHINA AVIATION FUEL MARKET ANALYSIS BY END USE FIGURE 52. CHINA AVIATION FUEL MARKET ANALYSIS BY DISTRIBUTION CHANNEL FIGURE 53. CHINA AVIATION FUEL MARKET ANALYSIS BY APPLICATION FIGURE 54. CHINA AVIATION FUEL MARKET ANALYSIS BY REGIONAL FIGURE 55. INDIA AVIATION FUEL MARKET ANALYSIS BY FUEL TYPE FIGURE 56. INDIA AVIATION FUEL MARKET ANALYSIS BY END USE FIGURE 57. INDIA AVIATION FUEL MARKET ANALYSIS BY DISTRIBUTION CHANNEL FIGURE 58. INDIA AVIATION FUEL MARKET ANALYSIS BY APPLICATION FIGURE 59. INDIA AVIATION FUEL MARKET ANALYSIS BY REGIONAL FIGURE 60. JAPAN AVIATION FUEL MARKET ANALYSIS BY FUEL TYPE FIGURE 61. JAPAN AVIATION FUEL MARKET ANALYSIS BY END USE FIGURE 62. JAPAN AVIATION FUEL MARKET ANALYSIS BY DISTRIBUTION CHANNEL FIGURE 63. JAPAN AVIATION FUEL MARKET ANALYSIS BY APPLICATION FIGURE 64. JAPAN AVIATION FUEL MARKET ANALYSIS BY REGIONAL FIGURE 65. SOUTH KOREA AVIATION FUEL MARKET ANALYSIS BY FUEL TYPE FIGURE 66. SOUTH KOREA AVIATION FUEL MARKET ANALYSIS BY END USE FIGURE 67. SOUTH KOREA AVIATION FUEL MARKET ANALYSIS BY DISTRIBUTION CHANNEL FIGURE 68. SOUTH KOREA AVIATION FUEL MARKET ANALYSIS BY APPLICATION FIGURE 69. SOUTH KOREA AVIATION FUEL MARKET ANALYSIS BY REGIONAL FIGURE 70. MALAYSIA AVIATION FUEL MARKET ANALYSIS BY FUEL TYPE FIGURE 71. MALAYSIA AVIATION FUEL MARKET ANALYSIS BY END USE FIGURE 72. MALAYSIA AVIATION FUEL MARKET ANALYSIS BY DISTRIBUTION CHANNEL FIGURE 73. MALAYSIA AVIATION FUEL MARKET ANALYSIS BY APPLICATION FIGURE 74. MALAYSIA AVIATION FUEL MARKET ANALYSIS BY REGIONAL FIGURE 75. THAILAND AVIATION FUEL MARKET ANALYSIS BY FUEL TYPE FIGURE 76. THAILAND AVIATION FUEL MARKET ANALYSIS BY END USE FIGURE 77. THAILAND AVIATION FUEL MARKET ANALYSIS BY DISTRIBUTION CHANNEL FIGURE 78. THAILAND AVIATION FUEL MARKET ANALYSIS BY APPLICATION FIGURE 79. THAILAND AVIATION FUEL MARKET ANALYSIS BY REGIONAL FIGURE 80. INDONESIA AVIATION FUEL MARKET ANALYSIS BY FUEL TYPE FIGURE 81. INDONESIA AVIATION FUEL MARKET ANALYSIS BY END USE FIGURE 82. INDONESIA AVIATION FUEL MARKET ANALYSIS BY DISTRIBUTION CHANNEL FIGURE 83. INDONESIA AVIATION FUEL MARKET ANALYSIS BY APPLICATION FIGURE 84. INDONESIA AVIATION FUEL MARKET ANALYSIS BY REGIONAL FIGURE 85. REST OF APAC AVIATION FUEL MARKET ANALYSIS BY FUEL TYPE FIGURE 86. REST OF APAC AVIATION FUEL MARKET ANALYSIS BY END USE FIGURE 87. REST OF APAC AVIATION FUEL MARKET ANALYSIS BY DISTRIBUTION CHANNEL FIGURE 88. REST OF APAC AVIATION FUEL MARKET ANALYSIS BY APPLICATION FIGURE 89. REST OF APAC AVIATION FUEL MARKET ANALYSIS BY REGIONAL FIGURE 90. SOUTH AMERICA AVIATION FUEL MARKET ANALYSIS FIGURE 91. BRAZIL AVIATION FUEL MARKET ANALYSIS BY FUEL TYPE FIGURE 92. BRAZIL AVIATION FUEL MARKET ANALYSIS BY END USE FIGURE 93. BRAZIL AVIATION FUEL MARKET ANALYSIS BY DISTRIBUTION CHANNEL FIGURE 94. BRAZIL AVIATION FUEL MARKET ANALYSIS BY APPLICATION FIGURE 95. BRAZIL AVIATION FUEL MARKET ANALYSIS BY REGIONAL FIGURE 96. MEXICO AVIATION FUEL MARKET ANALYSIS BY FUEL TYPE FIGURE 97. MEXICO AVIATION FUEL MARKET ANALYSIS BY END USE FIGURE 98. MEXICO AVIATION FUEL MARKET ANALYSIS BY DISTRIBUTION CHANNEL FIGURE 99. MEXICO AVIATION FUEL MARKET ANALYSIS BY APPLICATION FIGURE 100. MEXICO AVIATION FUEL MARKET ANALYSIS BY REGIONAL FIGURE 101. ARGENTINA AVIATION FUEL MARKET ANALYSIS BY FUEL TYPE FIGURE 102. ARGENTINA AVIATION FUEL MARKET ANALYSIS BY END USE FIGURE 103. ARGENTINA AVIATION FUEL MARKET ANALYSIS BY DISTRIBUTION CHANNEL FIGURE 104. ARGENTINA AVIATION FUEL MARKET ANALYSIS BY APPLICATION FIGURE 105. ARGENTINA AVIATION FUEL MARKET ANALYSIS BY REGIONAL FIGURE 106. REST OF SOUTH AMERICA AVIATION FUEL MARKET ANALYSIS BY FUEL TYPE FIGURE 107. REST OF SOUTH AMERICA AVIATION FUEL MARKET ANALYSIS BY END USE FIGURE 108. REST OF SOUTH AMERICA AVIATION FUEL MARKET ANALYSIS BY DISTRIBUTION CHANNEL FIGURE 109. REST OF SOUTH AMERICA AVIATION FUEL MARKET ANALYSIS BY APPLICATION FIGURE 110. REST OF SOUTH AMERICA AVIATION FUEL MARKET ANALYSIS BY REGIONAL FIGURE 111. MEA AVIATION FUEL MARKET ANALYSIS FIGURE 112. GCC COUNTRIES AVIATION FUEL MARKET ANALYSIS BY FUEL TYPE FIGURE 113. GCC COUNTRIES AVIATION FUEL MARKET ANALYSIS BY END USE FIGURE 114. GCC COUNTRIES AVIATION FUEL MARKET ANALYSIS BY DISTRIBUTION CHANNEL FIGURE 115. GCC COUNTRIES AVIATION FUEL MARKET ANALYSIS BY APPLICATION FIGURE 116. GCC COUNTRIES AVIATION FUEL MARKET ANALYSIS BY REGIONAL FIGURE 117. SOUTH AFRICA AVIATION FUEL MARKET ANALYSIS BY FUEL TYPE FIGURE 118. SOUTH AFRICA AVIATION FUEL MARKET ANALYSIS BY END USE FIGURE 119. SOUTH AFRICA AVIATION FUEL MARKET ANALYSIS BY DISTRIBUTION CHANNEL FIGURE 120. SOUTH AFRICA AVIATION FUEL MARKET ANALYSIS BY APPLICATION FIGURE 121. SOUTH AFRICA AVIATION FUEL MARKET ANALYSIS BY REGIONAL FIGURE 122. REST OF MEA AVIATION FUEL MARKET ANALYSIS BY FUEL TYPE FIGURE 123. REST OF MEA AVIATION FUEL MARKET ANALYSIS BY END USE FIGURE 124. REST OF MEA AVIATION FUEL MARKET ANALYSIS BY DISTRIBUTION CHANNEL FIGURE 125. REST OF MEA AVIATION FUEL MARKET ANALYSIS BY APPLICATION FIGURE 126. REST OF MEA AVIATION FUEL MARKET ANALYSIS BY REGIONAL FIGURE 127. KEY BUYING CRITERIA OF AVIATION FUEL MARKET FIGURE 128. RESEARCH PROCESS OF MRFR FIGURE 129. DRO ANALYSIS OF AVIATION FUEL MARKET FIGURE 130. DRIVERS IMPACT ANALYSIS: AVIATION FUEL MARKET FIGURE 131. RESTRAINTS IMPACT ANALYSIS: AVIATION FUEL MARKET FIGURE 132. SUPPLY / VALUE CHAIN: AVIATION FUEL MARKET FIGURE 133. AVIATION FUEL MARKET, BY FUEL TYPE, 2025 (% SHARE) FIGURE 134. AVIATION FUEL MARKET, BY FUEL TYPE, 2019 TO 2035 (USD Billions) FIGURE 135. AVIATION FUEL MARKET, BY END USE, 2025 (% SHARE) FIGURE 136. AVIATION FUEL MARKET, BY END USE, 2019 TO 2035 (USD Billions) FIGURE 137. AVIATION FUEL MARKET, BY DISTRIBUTION CHANNEL, 2025 (% SHARE) FIGURE 138. AVIATION FUEL MARKET, BY DISTRIBUTION CHANNEL, 2019 TO 2035 (USD Billions) FIGURE 139. AVIATION FUEL MARKET, BY APPLICATION, 2025 (% SHARE) FIGURE 140. AVIATION FUEL MARKET, BY APPLICATION, 2019 TO 2035 (USD Billions) FIGURE 141. AVIATION FUEL MARKET, BY REGIONAL, 2025 (% SHARE) FIGURE 142. AVIATION FUEL MARKET, BY REGIONAL, 2019 TO 2035 (USD Billions) FIGURE 143. BENCHMARKING OF MAJOR COMPETITORS

    Aviation Fuel Market Segmentation

    • Aviation Fuel Market By Fuel Type (USD Billion, 2019-2035)

      • Jet A

      • Jet A-1

      • Jet B

      • Avgas

      • Sustainable Aviation Fuel

    • Aviation Fuel Market By End Use (USD Billion, 2019-2035)

      • Commercial Aviation

      • Military Aviation

      • General Aviation

    • Aviation Fuel Market By Distribution Channel (USD Billion, 2019-2035)

      • Direct Sales

      • Distributors

      • Retailers

    • Aviation Fuel Market By Application (USD Billion, 2019-2035)

      • Cargo Transportation

      • Passenger Flights

      • Charter Services

    • Aviation Fuel Market By Regional (USD Billion, 2019-2035)

      • North America

      • Europe

      • South America

      • Asia Pacific

      • Middle East and Africa

    Aviation Fuel Market Regional Outlook (USD Billion, 2019-2035)

    • North America Outlook (USD Billion, 2019-2035)

      • North America Aviation Fuel Market by Fuel Type

        • Jet A

        • Jet A-1

        • Jet B

        • Avgas

        • Sustainable Aviation Fuel

      • North America Aviation Fuel Market by End Use Type

        • Commercial Aviation

        • Military Aviation

        • General Aviation

      • North America Aviation Fuel Market by Distribution Channel Type

        • Direct Sales

        • Distributors

        • Retailers

      • North America Aviation Fuel Market by Application Type

        • Cargo Transportation

        • Passenger Flights

        • Charter Services

      • North America Aviation Fuel Market by Regional Type

        • US

        • Canada

      • US Outlook (USD Billion, 2019-2035)

      • US Aviation Fuel Market by Fuel Type

        • Jet A

        • Jet A-1

        • Jet B

        • Avgas

        • Sustainable Aviation Fuel

      • US Aviation Fuel Market by End Use Type

        • Commercial Aviation

        • Military Aviation

        • General Aviation

      • US Aviation Fuel Market by Distribution Channel Type

        • Direct Sales

        • Distributors

        • Retailers

      • US Aviation Fuel Market by Application Type

        • Cargo Transportation

        • Passenger Flights

        • Charter Services

      • CANADA Outlook (USD Billion, 2019-2035)

      • CANADA Aviation Fuel Market by Fuel Type

        • Jet A

        • Jet A-1

        • Jet B

        • Avgas

        • Sustainable Aviation Fuel

      • CANADA Aviation Fuel Market by End Use Type

        • Commercial Aviation

        • Military Aviation

        • General Aviation

      • CANADA Aviation Fuel Market by Distribution Channel Type

        • Direct Sales

        • Distributors

        • Retailers

      • CANADA Aviation Fuel Market by Application Type

        • Cargo Transportation

        • Passenger Flights

        • Charter Services

    • Europe Outlook (USD Billion, 2019-2035)

      • Europe Aviation Fuel Market by Fuel Type

        • Jet A

        • Jet A-1

        • Jet B

        • Avgas

        • Sustainable Aviation Fuel

      • Europe Aviation Fuel Market by End Use Type

        • Commercial Aviation

        • Military Aviation

        • General Aviation

      • Europe Aviation Fuel Market by Distribution Channel Type

        • Direct Sales

        • Distributors

        • Retailers

      • Europe Aviation Fuel Market by Application Type

        • Cargo Transportation

        • Passenger Flights

        • Charter Services

      • Europe Aviation Fuel Market by Regional Type

        • Germany

        • UK

        • France

        • Russia

        • Italy

        • Spain

        • Rest of Europe

      • GERMANY Outlook (USD Billion, 2019-2035)

      • GERMANY Aviation Fuel Market by Fuel Type

        • Jet A

        • Jet A-1

        • Jet B

        • Avgas

        • Sustainable Aviation Fuel

      • GERMANY Aviation Fuel Market by End Use Type

        • Commercial Aviation

        • Military Aviation

        • General Aviation

      • GERMANY Aviation Fuel Market by Distribution Channel Type

        • Direct Sales

        • Distributors

        • Retailers

      • GERMANY Aviation Fuel Market by Application Type

        • Cargo Transportation

        • Passenger Flights

        • Charter Services

      • UK Outlook (USD Billion, 2019-2035)

      • UK Aviation Fuel Market by Fuel Type

        • Jet A

        • Jet A-1

        • Jet B

        • Avgas

        • Sustainable Aviation Fuel

      • UK Aviation Fuel Market by End Use Type

        • Commercial Aviation

        • Military Aviation

        • General Aviation

      • UK Aviation Fuel Market by Distribution Channel Type

        • Direct Sales

        • Distributors

        • Retailers

      • UK Aviation Fuel Market by Application Type

        • Cargo Transportation

        • Passenger Flights

        • Charter Services

      • FRANCE Outlook (USD Billion, 2019-2035)

      • FRANCE Aviation Fuel Market by Fuel Type

        • Jet A

        • Jet A-1

        • Jet B

        • Avgas

        • Sustainable Aviation Fuel

      • FRANCE Aviation Fuel Market by End Use Type

        • Commercial Aviation

        • Military Aviation

        • General Aviation

      • FRANCE Aviation Fuel Market by Distribution Channel Type

        • Direct Sales

        • Distributors

        • Retailers

      • FRANCE Aviation Fuel Market by Application Type

        • Cargo Transportation

        • Passenger Flights

        • Charter Services

      • RUSSIA Outlook (USD Billion, 2019-2035)

      • RUSSIA Aviation Fuel Market by Fuel Type

        • Jet A

        • Jet A-1

        • Jet B

        • Avgas

        • Sustainable Aviation Fuel

      • RUSSIA Aviation Fuel Market by End Use Type

        • Commercial Aviation

        • Military Aviation

        • General Aviation

      • RUSSIA Aviation Fuel Market by Distribution Channel Type

        • Direct Sales

        • Distributors

        • Retailers

      • RUSSIA Aviation Fuel Market by Application Type

        • Cargo Transportation

        • Passenger Flights

        • Charter Services

      • ITALY Outlook (USD Billion, 2019-2035)

      • ITALY Aviation Fuel Market by Fuel Type

        • Jet A

        • Jet A-1

        • Jet B

        • Avgas

        • Sustainable Aviation Fuel

      • ITALY Aviation Fuel Market by End Use Type

        • Commercial Aviation

        • Military Aviation

        • General Aviation

      • ITALY Aviation Fuel Market by Distribution Channel Type

        • Direct Sales

        • Distributors

        • Retailers

      • ITALY Aviation Fuel Market by Application Type

        • Cargo Transportation

        • Passenger Flights

        • Charter Services

      • SPAIN Outlook (USD Billion, 2019-2035)

      • SPAIN Aviation Fuel Market by Fuel Type

        • Jet A

        • Jet A-1

        • Jet B

        • Avgas

        • Sustainable Aviation Fuel

      • SPAIN Aviation Fuel Market by End Use Type

        • Commercial Aviation

        • Military Aviation

        • General Aviation

      • SPAIN Aviation Fuel Market by Distribution Channel Type

        • Direct Sales

        • Distributors

        • Retailers

      • SPAIN Aviation Fuel Market by Application Type

        • Cargo Transportation

        • Passenger Flights

        • Charter Services

      • REST OF EUROPE Outlook (USD Billion, 2019-2035)

      • REST OF EUROPE Aviation Fuel Market by Fuel Type

        • Jet A

        • Jet A-1

        • Jet B

        • Avgas

        • Sustainable Aviation Fuel

      • REST OF EUROPE Aviation Fuel Market by End Use Type

        • Commercial Aviation

        • Military Aviation

        • General Aviation

      • REST OF EUROPE Aviation Fuel Market by Distribution Channel Type

        • Direct Sales

        • Distributors

        • Retailers

      • REST OF EUROPE Aviation Fuel Market by Application Type

        • Cargo Transportation

        • Passenger Flights

        • Charter Services

    • APAC Outlook (USD Billion, 2019-2035)

      • APAC Aviation Fuel Market by Fuel Type

        • Jet A

        • Jet A-1

        • Jet B

        • Avgas

        • Sustainable Aviation Fuel

      • APAC Aviation Fuel Market by End Use Type

        • Commercial Aviation

        • Military Aviation

        • General Aviation

      • APAC Aviation Fuel Market by Distribution Channel Type

        • Direct Sales

        • Distributors

        • Retailers

      • APAC Aviation Fuel Market by Application Type

        • Cargo Transportation

        • Passenger Flights

        • Charter Services

      • APAC Aviation Fuel Market by Regional Type

        • China

        • India

        • Japan

        • South Korea

        • Malaysia

        • Thailand

        • Indonesia

        • Rest of APAC

      • CHINA Outlook (USD Billion, 2019-2035)

      • CHINA Aviation Fuel Market by Fuel Type

        • Jet A

        • Jet A-1

        • Jet B

        • Avgas

        • Sustainable Aviation Fuel

      • CHINA Aviation Fuel Market by End Use Type

        • Commercial Aviation

        • Military Aviation

        • General Aviation

      • CHINA Aviation Fuel Market by Distribution Channel Type

        • Direct Sales

        • Distributors

        • Retailers

      • CHINA Aviation Fuel Market by Application Type

        • Cargo Transportation

        • Passenger Flights

        • Charter Services

      • INDIA Outlook (USD Billion, 2019-2035)

      • INDIA Aviation Fuel Market by Fuel Type

        • Jet A

        • Jet A-1

        • Jet B

        • Avgas

        • Sustainable Aviation Fuel

      • INDIA Aviation Fuel Market by End Use Type

        • Commercial Aviation

        • Military Aviation

        • General Aviation

      • INDIA Aviation Fuel Market by Distribution Channel Type

        • Direct Sales

        • Distributors

        • Retailers

      • INDIA Aviation Fuel Market by Application Type

        • Cargo Transportation

        • Passenger Flights

        • Charter Services

      • JAPAN Outlook (USD Billion, 2019-2035)

      • JAPAN Aviation Fuel Market by Fuel Type

        • Jet A

        • Jet A-1

        • Jet B

        • Avgas

        • Sustainable Aviation Fuel

      • JAPAN Aviation Fuel Market by End Use Type

        • Commercial Aviation

        • Military Aviation

        • General Aviation

      • JAPAN Aviation Fuel Market by Distribution Channel Type

        • Direct Sales

        • Distributors

        • Retailers

      • JAPAN Aviation Fuel Market by Application Type

        • Cargo Transportation

        • Passenger Flights

        • Charter Services

      • SOUTH KOREA Outlook (USD Billion, 2019-2035)

      • SOUTH KOREA Aviation Fuel Market by Fuel Type

        • Jet A

        • Jet A-1

        • Jet B

        • Avgas

        • Sustainable Aviation Fuel

      • SOUTH KOREA Aviation Fuel Market by End Use Type

        • Commercial Aviation

        • Military Aviation

        • General Aviation

      • SOUTH KOREA Aviation Fuel Market by Distribution Channel Type

        • Direct Sales

        • Distributors

        • Retailers

      • SOUTH KOREA Aviation Fuel Market by Application Type

        • Cargo Transportation

        • Passenger Flights

        • Charter Services

      • MALAYSIA Outlook (USD Billion, 2019-2035)

      • MALAYSIA Aviation Fuel Market by Fuel Type

        • Jet A

        • Jet A-1

        • Jet B

        • Avgas

        • Sustainable Aviation Fuel

      • MALAYSIA Aviation Fuel Market by End Use Type

        • Commercial Aviation

        • Military Aviation

        • General Aviation

      • MALAYSIA Aviation Fuel Market by Distribution Channel Type

        • Direct Sales

        • Distributors

        • Retailers

      • MALAYSIA Aviation Fuel Market by Application Type

        • Cargo Transportation

        • Passenger Flights

        • Charter Services

      • THAILAND Outlook (USD Billion, 2019-2035)

      • THAILAND Aviation Fuel Market by Fuel Type

        • Jet A

        • Jet A-1

        • Jet B

        • Avgas

        • Sustainable Aviation Fuel

      • THAILAND Aviation Fuel Market by End Use Type

        • Commercial Aviation

        • Military Aviation

        • General Aviation

      • THAILAND Aviation Fuel Market by Distribution Channel Type

        • Direct Sales

        • Distributors

        • Retailers

      • THAILAND Aviation Fuel Market by Application Type

        • Cargo Transportation

        • Passenger Flights

        • Charter Services

      • INDONESIA Outlook (USD Billion, 2019-2035)

      • INDONESIA Aviation Fuel Market by Fuel Type

        • Jet A

        • Jet A-1

        • Jet B

        • Avgas

        • Sustainable Aviation Fuel

      • INDONESIA Aviation Fuel Market by End Use Type

        • Commercial Aviation

        • Military Aviation

        • General Aviation

      • INDONESIA Aviation Fuel Market by Distribution Channel Type

        • Direct Sales

        • Distributors

        • Retailers

      • INDONESIA Aviation Fuel Market by Application Type

        • Cargo Transportation

        • Passenger Flights

        • Charter Services

      • REST OF APAC Outlook (USD Billion, 2019-2035)

      • REST OF APAC Aviation Fuel Market by Fuel Type

        • Jet A

        • Jet A-1

        • Jet B

        • Avgas

        • Sustainable Aviation Fuel

      • REST OF APAC Aviation Fuel Market by End Use Type

        • Commercial Aviation

        • Military Aviation

        • General Aviation

      • REST OF APAC Aviation Fuel Market by Distribution Channel Type

        • Direct Sales

        • Distributors

        • Retailers

      • REST OF APAC Aviation Fuel Market by Application Type

        • Cargo Transportation

        • Passenger Flights

        • Charter Services

    • South America Outlook (USD Billion, 2019-2035)

      • South America Aviation Fuel Market by Fuel Type

        • Jet A

        • Jet A-1

        • Jet B

        • Avgas

        • Sustainable Aviation Fuel

      • South America Aviation Fuel Market by End Use Type

        • Commercial Aviation

        • Military Aviation

        • General Aviation

      • South America Aviation Fuel Market by Distribution Channel Type

        • Direct Sales

        • Distributors

        • Retailers

      • South America Aviation Fuel Market by Application Type

        • Cargo Transportation

        • Passenger Flights

        • Charter Services

      • South America Aviation Fuel Market by Regional Type

        • Brazil

        • Mexico

        • Argentina

        • Rest of South America

      • BRAZIL Outlook (USD Billion, 2019-2035)

      • BRAZIL Aviation Fuel Market by Fuel Type

        • Jet A

        • Jet A-1

        • Jet B

        • Avgas

        • Sustainable Aviation Fuel

      • BRAZIL Aviation Fuel Market by End Use Type

        • Commercial Aviation

        • Military Aviation

        • General Aviation

      • BRAZIL Aviation Fuel Market by Distribution Channel Type

        • Direct Sales

        • Distributors

        • Retailers

      • BRAZIL Aviation Fuel Market by Application Type

        • Cargo Transportation

        • Passenger Flights

        • Charter Services

      • MEXICO Outlook (USD Billion, 2019-2035)

      • MEXICO Aviation Fuel Market by Fuel Type

        • Jet A

        • Jet A-1

        • Jet B

        • Avgas

        • Sustainable Aviation Fuel

      • MEXICO Aviation Fuel Market by End Use Type

        • Commercial Aviation

        • Military Aviation

        • General Aviation

      • MEXICO Aviation Fuel Market by Distribution Channel Type

        • Direct Sales

        • Distributors

        • Retailers

      • MEXICO Aviation Fuel Market by Application Type

        • Cargo Transportation

        • Passenger Flights

        • Charter Services

      • ARGENTINA Outlook (USD Billion, 2019-2035)

      • ARGENTINA Aviation Fuel Market by Fuel Type

        • Jet A

        • Jet A-1

        • Jet B

        • Avgas

        • Sustainable Aviation Fuel

      • ARGENTINA Aviation Fuel Market by End Use Type

        • Commercial Aviation

        • Military Aviation

        • General Aviation

      • ARGENTINA Aviation Fuel Market by Distribution Channel Type

        • Direct Sales

        • Distributors

        • Retailers

      • ARGENTINA Aviation Fuel Market by Application Type

        • Cargo Transportation

        • Passenger Flights

        • Charter Services

      • REST OF SOUTH AMERICA Outlook (USD Billion, 2019-2035)

      • REST OF SOUTH AMERICA Aviation Fuel Market by Fuel Type

        • Jet A

        • Jet A-1

        • Jet B

        • Avgas

        • Sustainable Aviation Fuel

      • REST OF SOUTH AMERICA Aviation Fuel Market by End Use Type

        • Commercial Aviation

        • Military Aviation

        • General Aviation

      • REST OF SOUTH AMERICA Aviation Fuel Market by Distribution Channel Type

        • Direct Sales

        • Distributors

        • Retailers

      • REST OF SOUTH AMERICA Aviation Fuel Market by Application Type

        • Cargo Transportation

        • Passenger Flights

        • Charter Services

    • MEA Outlook (USD Billion, 2019-2035)

      • MEA Aviation Fuel Market by Fuel Type

        • Jet A

        • Jet A-1

        • Jet B

        • Avgas

        • Sustainable Aviation Fuel

      • MEA Aviation Fuel Market by End Use Type

        • Commercial Aviation

        • Military Aviation

        • General Aviation

      • MEA Aviation Fuel Market by Distribution Channel Type

        • Direct Sales

        • Distributors

        • Retailers

      • MEA Aviation Fuel Market by Application Type

        • Cargo Transportation

        • Passenger Flights

        • Charter Services

      • MEA Aviation Fuel Market by Regional Type

        • GCC Countries

        • South Africa

        • Rest of MEA

      • GCC COUNTRIES Outlook (USD Billion, 2019-2035)

      • GCC COUNTRIES Aviation Fuel Market by Fuel Type

        • Jet A

        • Jet A-1

        • Jet B

        • Avgas

        • Sustainable Aviation Fuel

      • GCC COUNTRIES Aviation Fuel Market by End Use Type

        • Commercial Aviation

        • Military Aviation

        • General Aviation

      • GCC COUNTRIES Aviation Fuel Market by Distribution Channel Type

        • Direct Sales

        • Distributors

        • Retailers

      • GCC COUNTRIES Aviation Fuel Market by Application Type

        • Cargo Transportation

        • Passenger Flights

        • Charter Services

      • SOUTH AFRICA Outlook (USD Billion, 2019-2035)

      • SOUTH AFRICA Aviation Fuel Market by Fuel Type

        • Jet A

        • Jet A-1

        • Jet B

        • Avgas

        • Sustainable Aviation Fuel

      • SOUTH AFRICA Aviation Fuel Market by End Use Type

        • Commercial Aviation

        • Military Aviation

        • General Aviation

      • SOUTH AFRICA Aviation Fuel Market by Distribution Channel Type

        • Direct Sales

        • Distributors

        • Retailers

      • SOUTH AFRICA Aviation Fuel Market by Application Type

        • Cargo Transportation

        • Passenger Flights

        • Charter Services

      • REST OF MEA Outlook (USD Billion, 2019-2035)

      • REST OF MEA Aviation Fuel Market by Fuel Type

        • Jet A

        • Jet A-1

        • Jet B

        • Avgas

        • Sustainable Aviation Fuel

      • REST OF MEA Aviation Fuel Market by End Use Type

        • Commercial Aviation

        • Military Aviation

        • General Aviation

      • REST OF MEA Aviation Fuel Market by Distribution Channel Type

        • Direct Sales

        • Distributors

        • Retailers

      • REST OF MEA Aviation Fuel Market by Application Type

        • Cargo Transportation

        • Passenger Flights

        • Charter Services

    Infographic

    Free Sample Request

    Kindly complete the form below to receive a free sample of this Report

    Get Free Sample

    Customer Strories

    “I am very pleased with how market segments have been defined in a relevant way for my purposes (such as "Portable Freezers & refrigerators" and "last-mile"). In general the report is well structured. Thanks very much for your efforts.”

    Victoria Milne

    Founder
    Case Study
    Chemicals and Materials