• Cat-intel
  • MedIntelliX
  • Resources
  • About Us
  • Hero Background
    English
    Chinese
    French
    Japanese
    Korean
    German
    Spanish

    Augmented Reality Market Analysis

    ID: MRFR/ICT/0637-HCR
    100 Pages
    Ankit Gupta
    October 2025

    Augmented Reality Market Research Report: Information By Device Type (Head Mounted Display, Head-up Display), By Vertical (Consumer Electronics, Commercial, Aerospace & Defense, Medical), By Technology (Marker Based, Marker Less), And By Region (North America, Europe, Asia-Pacific, And Rest Of The World) –Market Forecast Till 2035.

    Share:
    Download PDF ×

    We do not share your information with anyone. However, we may send you emails based on your report interest from time to time. You may contact us at any time to opt-out.

    Augmented Reality Market Infographic
    $ 4,950.0
    $ 5,950.0
    $ 7,250.0

    Market Analysis

    In-depth Analysis of Augmented Reality Market Industry Landscape

    Due to the growing need for immersive experiences in a variety of industries and technical improvements, the market dynamics of the Augmented Reality (AR) business have experienced considerable changes. The integration of digital content into the user's physical surroundings, or augmented reality, has become increasingly popular and widely used. The increasing use of smartphones and other smart devices, which provide accessible platforms for augmented reality applications, is one of the major factors propelling this market. These gadgets' ubiquity and simplicity of use have helped democratize augmented reality (AR), opening it up to more users and enterprises.

    The corporate sector has embraced augmented reality (AR) due to its potential to improve efficiency and productivity, in addition to its consumer uses. AR technology have been utilized by several industries, including manufacturing, healthcare, and education, to enhance training programs, optimize workflows, and facilitate more informed decision-making. Corporate expenditures in augmented reality (AR) solutions have increased as a result of growing knowledge of the advantages of AR in improving operational procedures. Market dynamics also take into account the impact of shifting customer tastes and habits. The adoption of AR has been significantly influenced by the gaming and entertainment sector, as seen by the immense success of apps like Pokémon GO. Content producers and artists are exploring augmented reality (AR) as a narrative and entertainment medium in response to the growing need for interactive and engaging content.

    Because of this, the augmented reality industry has developed into a dynamic ecosystem that constantly welcomes fresh, cutting-edge applications that satisfy a wide range of customer needs. Standardization and interoperability are essential components of the dynamics of the AR business. The requirement for smooth integration of augmented reality experiences across many platforms and devices is becoming more and more apparent as the industry develops. In order to promote a more unified and integrated AR environment, standardization efforts are being made to guarantee compatibility and seamless collaboration across hardware and software components.

    The laws and policies of the government also have a big impact on how the AR industry develops. Regulatory agencies have created frameworks and rules in response to concerns about privacy, data security, and ethical issues in AR applications. Market participants must abide by these rules in order to foster user confidence and guarantee the ethical development and application of augmented reality technology.

    Market Summary

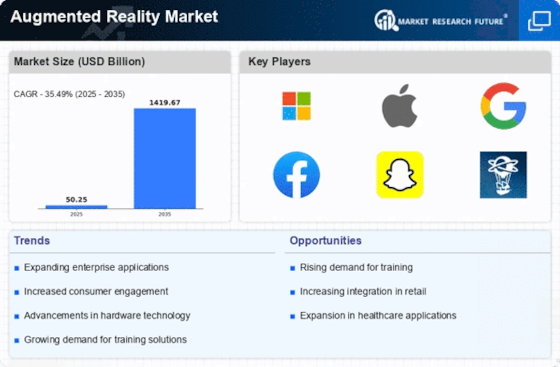
    As per Market Research Future Analysis, the Augmented Reality (AR) market is set to experience substantial growth, with a projected increase from USD 50.25 Billion in 2024 to USD 1419.67 Billion by 2035, reflecting a compound annual growth rate (CAGR) of 35.49% during the forecast period. The market was valued at USD 50.25 Billion in 2024, driven by the rising adoption of smartphones and the demand for 3D visualization in healthcare. Key industries such as consumer electronics, aerospace & defense, and healthcare are increasingly integrating AR technology, enhancing user experiences and operational efficiencies.

    Key Market Trends & Highlights

    The augmented reality market is witnessing transformative trends fueled by significant investments and technological advancements.

    • Market Size in 2024: USD 50.25 Billion; projected to reach USD 1419.67 Billion by 2035. North America holds the largest market share due to high investment in immersive technologies. Head Mounted Displays (HMDs) dominate the device type segment, enhancing user interaction. Marker-based AR technology leads the market, widely utilized in advertising and education.

    Market Size & Forecast

    2024 Market Size USD 50.25 Billion
    2035 Market Size USD 1419.67 Billion
    CAGR 35.49%

    Major Players

    <p>Key players include Blippar, Google Inc., Microsoft Corporation, PTC, Wikitude GmbH, Samsung Electronics Co. Ltd., DAQRI, and Upskill.</p>

    Market Trends

    Rising investments in AR are driving the market growth

    The augmented reality market has experienced significant growth in recent years, attracting investments from notable companies such as Facebook, Intel, Qualcomm, Alphabet, Comcast Ventures, and Samsung. Research institutes are also actively exploring AR applications across various industries, with funding from private firms, venture capitalists, and governments. Industries like consumer, aerospace & defense, healthcare, enterprises, retail, and marketing are embracing the advantages of AR technology.

    For example, Boeing Company has established HorizonX, an investment fund focused on external partnerships, including investments in Upskill, a leading enterprise software company for industrial AR devices, and Zunum Aero, a startup aircraft manufacturer based in Kirkland, Washington.

    Additionally, Information plays a vital role in the thriving tourism market worldwide. Augmented reality (AR) is poised to revolutionize the industry by offering travelers enriched Information and immersive experiences. Cultural institutions can employ AR to captivate visitors through real-time navigation and interactive exhibits. Similarly, AR applications can enhance outdoor locations, enabling tourists to use their smartphones or handheld devices for real-time access to Information about physical objects. For instance, users can instantly access reviews and menus by pointing their devices at restaurants or learning about the history of landmarks by aiming their tablets at them.

    This integration of AR in tourism will significantly elevate the overall visitor experience. This can greatly enhance the Augmented Reality (AR) market revenue.

    <p>The Global Augmented Reality Market is poised for transformative growth, driven by advancements in technology and increasing applications across various sectors, including education, healthcare, and retail.</p>

    U.S. Department of Commerce

    Augmented Reality Market Market Drivers

    Market Growth Projections

    The Global Augmented Reality Market Industry is poised for remarkable growth, with projections indicating a rise from 50.2 USD Billion in 2024 to an astounding 1419.7 USD Billion by 2035. This trajectory suggests a compound annual growth rate (CAGR) of 35.49% from 2025 to 2035, reflecting the increasing integration of AR technologies across various sectors. The anticipated growth is driven by factors such as technological advancements, increased adoption in retail, and the expansion of healthcare applications. As industries continue to explore the potential of AR, the market is likely to witness unprecedented expansion in the coming years.

    Technological Advancements

    The Global Augmented Reality Market Industry is propelled by rapid technological advancements in hardware and software. Innovations in mobile devices, such as smartphones and tablets, have enhanced AR capabilities, making them more accessible to consumers. For instance, the integration of AR features in popular applications like Snapchat and Instagram has significantly increased user engagement. Furthermore, advancements in computer vision and machine learning algorithms have improved the accuracy and responsiveness of AR applications. As a result, the market is projected to reach 50.2 USD Billion in 2024, indicating a robust growth trajectory fueled by these technological developments.

    Increased Adoption in Retail

    The Global Augmented Reality Market Industry experiences a surge in adoption within the retail sector, as businesses leverage AR to enhance customer experiences. Retailers utilize AR applications to allow customers to visualize products in their own environments before making a purchase. For example, furniture retailers like IKEA have implemented AR solutions that enable users to see how furniture fits in their homes. This trend not only improves customer satisfaction but also reduces return rates. As the retail sector increasingly embraces AR, the market is expected to expand significantly, contributing to the anticipated growth to 1419.7 USD Billion by 2035.

    Rise of Gaming and Entertainment

    The Global Augmented Reality Market Industry is significantly influenced by the rise of gaming and entertainment applications. The success of AR games, such as Pokémon GO, has demonstrated the potential of AR to engage users in immersive experiences. This trend is further supported by the increasing availability of AR-enabled devices and platforms. As gaming companies continue to innovate and develop new AR experiences, the market is expected to flourish. The entertainment sector's embrace of AR technologies not only enhances user engagement but also attracts investment, contributing to the overall growth of the market, which is projected to reach 50.2 USD Billion in 2024.

    Expansion in Healthcare Applications

    The Global Augmented Reality Market Industry is increasingly expanding into healthcare applications, where AR technologies are utilized for training, surgery, and patient care. Medical professionals are employing AR to visualize complex anatomical structures during surgeries, enhancing precision and outcomes. For example, AR systems can overlay critical information onto a surgeon's field of view, improving decision-making during procedures. Additionally, AR is being used in medical training, allowing students to practice in simulated environments. This growing integration of AR in healthcare is likely to contribute to the market's expansion, aligning with the projected growth to 1419.7 USD Billion by 2035.

    Growing Demand for Remote Collaboration

    The Global Augmented Reality Market Industry is witnessing a growing demand for remote collaboration tools, particularly in professional settings. AR technologies facilitate real-time collaboration among teams, regardless of geographical barriers. For instance, companies like Microsoft have developed AR platforms that allow remote workers to interact with 3D models and share insights seamlessly. This capability is particularly valuable in industries such as engineering and architecture, where visualizing complex designs is crucial. As remote work continues to evolve, the market is likely to benefit from this trend, potentially driving growth rates of 35.49% CAGR from 2025 to 2035.

    Market Segment Insights

    Augmented Reality (AR) Device Type Insights

    <p>Based on device type, the global Augmented Reality (AR) market segmentation includes Head Mounted Displays and Head-up Displays. The head-mounted display segment dominated the market; HMDs provide an immersive and interactive AR experience by overlaying virtual elements onto the real world, enhancing the user's perception and interaction with the environment. This makes HMDs well-suited for various applications such as gaming, education, healthcare, and industrial training, and advancements in HMD technology have led to the development of more sophisticated and user-friendly devices.</p>

    Augmented Reality (AR) Device Vertical Insights

    <p>Based on vertical, the global Augmented Reality (AR) market segmentation includes consumer electronics, commercial, aerospace &amp; defense, and medical. The consumer electronics segment dominated the market; the widespread adoption of smartphones and tablets has made AR technology more accessible to consumers. Many popular smartphone models have AR capabilities, allowing users to experience AR applications and content without needing additional devices or hardware.</p>

    Augmented Reality (AR) Device Technology Insights

    <p>The global Augmented Reality (AR) market segmentation, based on Technology, includes Marker-based and Markerless. The marker-based held the largest category in the market. Marker-based AR is widely used in advertising, marketing, gaming, education, and training. It offers a user-friendly and intuitive AR experience, requiring users to simply scan or point their devices at the markers to activate the augmented content.</p>

    <p>Figure 2: Augmented Reality (AR) Market, by Technology, 2022 &amp; 2032 (USD billion)</p>

    <p>Source: Secondary Research, Primary Research, Market Research Future Database, and Analyst Review</p>

    Get more detailed insights about Augmented Reality Market Research Report – Forecast till 2032

    Regional Insights

    By Region, the study provides market insights into North America, Europe, Asia-Pacific, and Rest of the World. The North American augmented reality (AR) market will dominate this market, owing to immersive technologies becoming more popular in the Region due to continued investment, which will boost the market growth in this Region.

    Further, the major countries studied in the market report are The U.S., Canada, German, France, the UK, Italy, Spain, China, Japan, India, Australia, South Korea, and Brazil.

    Figure 3: AUGMENTED REALITY (AR) MARKET SHARE BY REGION 2022 (%)

    AUGMENTED REALITY (AR) MARKET SHARE BY REGION

    Source: Secondary Research, Primary Research, Market Research Future Database, and Analyst Review

    Europe's Augmented Reality (AR) market accounts for the second-largest market share due to the snowballing adoption of digital media and an upsurge in demand for 3-D visualization in the healthcare sector. Further, the German Augmented Reality (AR) market held the largest market share, and the UK Augmented Reality (AR) market was the fastest-growing market in the European Region.

    The Asia-Pacific Augmented Reality (AR) Market is expected to grow fastest from 2023 to 2032. This is because the increasing adoption of AR technology in India's manufacturing and healthcare industries is driving market growth in this Region. Moreover, China’s Augmented Reality (AR) market held the largest market share, and the Indian Augmented Reality (AR) market was the fastest-growing market in the Asia-Pacific region.

    Key Players and Competitive Insights

    Leading market players are investing heavily in research and development to expand their product lines, which will help the Augmented Reality (AR) market grow even more. Market participants are also undertaking various strategic activities to expand their global footprint, with important market developments including new product launches, contractual agreements, mergers and acquisitions, higher investments, and collaboration with other organizations. To expand and survive in a more competitive and rising market climate, Augmented Reality (AR) industry must offer cost-effective items.

    Manufacturing locally to minimize operational costs is one of the key business tactics manufacturers use in the global Augmented Reality (AR) industry to benefit clients and increase the market sector. In recent years, the Augmented Reality (AR) industry has offered some of the most significant advantages to medicine. Major players in the Augmented Reality (AR) market, including Blippar, Google Inc., Microsoft Corporation, PTC, Wikitude GmbH, Samsung Electronics Co. Ltd., Zugara, DAQRI, and Upskill., and others, are attempting to increase market demand by investing in research and development operations.

    Microsoft Corporation is a renowned multinational technology corporation. The company is widely recognized for its flagship software products, including the Windows operating system, Microsoft Office suite, and web browsers like Internet Explorer and Edge. Recently, Microsoft introduced a new application called Microsoft Mesh. This innovative app enables users to engage with others and 3D content in AR/VR meeting spaces, simplifying sharing of immersive multi-player experiences over the web by managing the technical complexities.

    Magic Leap, Inc. is a technology company based in the United States that introduced a head-mounted display named Magic Leap One. This display overlays computer-generated 3D imagery onto real-world objects, creating an augmented reality experience. Notably, Magic Leap has collaborated with Google Cloud to introduce Magic Leap enterprise solutions available on the Google Cloud Marketplace. Through this partnership, they aim to explore cutting-edge cloud-based spatial computing solutions driven by Google Cloud's capabilities.

    Key Companies in the Augmented Reality Market market include

    Industry Developments

    • Q2 2024: Apple launches Vision Pro mixed reality headset Apple officially launched its Vision Pro mixed reality headset in the United States, marking its entry into the augmented reality hardware market with a device that blends AR and VR capabilities.
    • Q2 2024: Snap partners with Live Nation to bring AR experiences to concerts Snap Inc. announced a partnership with Live Nation to integrate augmented reality features into live concerts, allowing attendees to access immersive AR experiences through the Snapchat app.
    • Q2 2024: Meta unveils new AR glasses in partnership with Ray-Ban Meta Platforms, Inc. launched a new generation of AR smart glasses in collaboration with Ray-Ban, featuring enhanced display technology and hands-free social media integration.
    • Q3 2024: Microsoft expands HoloLens 2 availability to new markets Microsoft announced the expansion of its HoloLens 2 augmented reality headset to additional international markets, aiming to increase enterprise adoption in manufacturing and healthcare sectors.
    • Q3 2024: Niantic acquires 8th Wall to boost AR development platform Niantic, the developer behind Pokémon Go, acquired AR development platform 8th Wall to strengthen its capabilities in web-based augmented reality experiences.
    • Q3 2024: Magic Leap raises $590 million in new funding round Magic Leap secured $590 million in a new funding round to accelerate the development and commercialization of its next-generation augmented reality headset.
    • Q4 2024: Meta and BMW announce partnership for in-car AR experiences Meta and BMW announced a partnership to develop augmented reality features for future BMW vehicles, aiming to enhance navigation and driver assistance systems.
    • Q4 2024: Google launches ARCore 3.0 with advanced spatial mapping Google released ARCore 3.0, the latest version of its augmented reality development platform, introducing advanced spatial mapping and improved object recognition for Android devices.
    • Q1 2025: Sony opens new AR R&D center in Tokyo Sony Corporation inaugurated a new research and development center in Tokyo dedicated to advancing augmented reality hardware and software technologies.
    • Q1 2025: Unity appoints new CEO to accelerate AR and VR strategy Unity Technologies appointed a new CEO with a mandate to drive the company's growth in augmented and virtual reality development tools.
    • Q2 2025: Vuzix wins contract to supply AR smart glasses to US Department of Defense Vuzix Corporation announced it has secured a contract to provide its augmented reality smart glasses to the US Department of Defense for use in field operations.
    • Q2 2025: Meta acquires AR startup WaveOptics to enhance display technology Meta acquired WaveOptics, a UK-based augmented reality display technology startup, to strengthen its hardware capabilities for future AR devices.

    Future Outlook

    Augmented Reality Market Future Outlook

    <p>The Global Augmented Reality Market is poised for remarkable growth at a 35.49% CAGR from 2025 to 2035, driven by advancements in technology and increasing applications across various sectors.</p>

    New opportunities lie in:

    • <p>Develop AR solutions for remote collaboration in industries like manufacturing and healthcare. Create immersive AR marketing campaigns for retail to enhance customer engagement. Invest in AR training programs for workforce development in technical fields.</p>

    <p>By 2035, the market is expected to exhibit robust expansion, solidifying its role in diverse applications.</p>

    Market Segmentation

    Augmented Reality (AR) Regional Outlook

    North America
    • US
    • Canada

    Augmented Reality (AR) Vertical Outlook

    • Consumer Electronics
    • Commercial
    • Aerospace & Defense
    • Medical

    Augmented Reality (AR) Technology Outlook

    • Marker Based
    • Marker Less

    Augmented Reality (AR) Device Type Outlook

    • Head Mounted Display
    • Head up Display

    Report Scope

    Attribute/Metric Details
    Market Size 2024 USD 50.25 Billion
    Market Size 2035 1419.67 (Value (USD Billion))
    Compound Annual Growth Rate (CAGR) 35.49% (2025 - 2035)
    Base Year 2024
    Market Forecast Period 2025 - 2035
    Historical Data 2018- 2022
    Market Forecast Units Value (USD Billion)
    Report Coverage Revenue Forecast, Market Competitive Landscape, Growth Factors, and Trends
    Segments Covered DeviceType, Vertical,Technology, and Region
    Geographies Covered North America, Europe, AsiaPacific, and the Rest of the World
    Countries Covered The U.S., Canada, German, France, UK, Italy, Spain, China, Japan, India, Australia, South Korea, and Brazil
    Key Companies Profiled  Blippar, Google Inc., Microsoft Corporation, PTC, Wikitude GmbH, Samsung Electronics Co. Ltd., Zugara, DAQRI, and Upskill
    Key Market Opportunities Augmented reality (AR) technology presents a significant business opportunity for companies to enhance their products and drive financial growth.
    Key Market Dynamics The major players driving the market growth are the high adoption of smartphones, snowballing adoption of digital media, and an upsurge in demand for 3-D visualization in the healthcare sector.
    Market Size 2025 68.08 (Value (USD Billion))

    Market Highlights

    Author

    Ankit Gupta
    Senior Research Analyst

    She holds an experience of about 6+ years in market research and business consulting, working under the spectrum of information communication technology, telecommunications and semiconductor domains. aarti conceptualizes and implements a scalable business strategy and provides strategic leadership to the clients. her expertise lies in market estimation, competitive intelligence, pipeline analysis, customer assessment, etc.

    Leave a Comment

    Latest Comments

    John Doe
    john@example.com

    This is a great article! Really helped me understand the topic better.

    Posted on July 23, 2025, 10:15 AM
    Jane Smith
    jane@domain.com

    Thanks for sharing this. I’ve bookmarked it for later reference.

    Posted on July 22, 2025, 7:45 PM

    FAQs

    How much is the Augmented Reality (AR) market?

    The global Augmented Reality (AR) market size was valued at USD 35.51 Billion in 2023.

    What is the growth rate of the Augmented Reality (AR) market?

    The global market is projected to grow at a CAGR of 35.49% during the forecast period, 2024-2032.

    Which Region held the largest market share in the Augmented Reality (AR) market?

    North America had the largest share of the global market.

    Who are the key players in the Augmented Reality (AR) market?

    The key players in the market areBlippar, Google Inc., Microsoft Corporation, PTC, Wikitude GmbH, Samsung Electronics Co. Ltd., Zugara, DAQRI, and Upskill.

    Which Device type led the Augmented Reality (AR) market?

    The Head Mounted Display Augmented Reality (AR) category dominated the market in 2023.

    Which Technology had the largest market share in the Augmented Reality (AR) market?

    The Marker Based had the largest share in the global market.

    1. . Global Augmented Reality Market by Component
      1. Introduction
      2. Hardware
      3. Market Estimates & Forecast, 2022-2030
      4. Market Estimates & Forecast by Region, 2022-2030
      5. Software
      6. Market Estimates & Forecast, 2022-2030
      7. Market Estimates & Forecast by Region, 2022-2030
    2. Introduction
    3. Hardware
    4. Market Estimates & Forecast, 2022-2030
    5. Market Estimates & Forecast by Region, 2022-2030
    6. Software
    7. Market Estimates & Forecast, 2022-2030
    8. Market Estimates & Forecast by Region, 2022-2030
    9. . Global Augmented Reality Market by Technology
      1. Introduction
      2. Monitor Based Technology
      3. Market Estimates & Forecast, 2022-2030
      4. Market Estimates & Forecast by Region, 2022-2030
      5. Near Eye Based Technology
      6. Market Estimates & Forecast, 2022-2030
      7. Market Estimates & Forecast by Region, 2022-2030
    10. Introduction
    11. Monitor Based Technology
    12. Market Estimates & Forecast, 2022-2030
    13. Market Estimates & Forecast by Region, 2022-2030
    14. Near Eye Based Technology
    15. Market Estimates & Forecast, 2022-2030
    16. Market Estimates & Forecast by Region, 2022-2030
    17. . Global Augmented Reality Market by Type
      1. Introduction
      2. Head Mounted Display
      3. Market Estimates & Forecast, 2022-2030
      4. Market Estimates & Forecast by Region, 2022-2030
      5. Head up Display
      6. Market Estimates & Forecast, 2022-2030
      7. Market Estimates & Forecast by Region, 2022-2030
      8. Handheld Device
      9. Market Estimates & Forecast, 2022-2030
      10. Market Estimates & Forecast by Region, 2022-2030
    18. Introduction
    19. Head Mounted Display
    20. Market Estimates & Forecast, 2022-2030
    21. Market Estimates & Forecast by Region, 2022-2030
    22. Head up Display
    23. Market Estimates & Forecast, 2022-2030
    24. Market Estimates & Forecast by Region, 2022-2030
    25. Handheld Device
    26. Market Estimates & Forecast, 2022-2030
    27. Market Estimates & Forecast by Region, 2022-2030
    28. . Global Augmented Reality Market by Application
      1. Introduction
      2. Commercial
      3. Market Estimates & Forecast, 2022-2030
      4. Market Estimates & Forecast by Region, 2022-2030
      5. Enterprise
      6. Market Estimates & Forecast, 2022-2030
      7. Market Estimates & Forecast by Region, 2022-2030
      8. Medical
      9. Market Estimates & Forecast, 2022-2030
      10. Market Estimates & Forecast by Region, 2022-2030
      11. Aerospace & Defense
      12. Market Estimates & Forecast, 2022-2030
      13. Market Estimates & Forecast by Region, 2022-2030
      14. Energy
      15. Market Estimates & Forecast, 2022-2030
      16. Market Estimates & Forecast by Region, 2022-2030
      17. Automotive
      18. Market Estimates & Forecast, 2022-2030
      19. Market Estimates & Forecast by Region, 2022-2030
      20. Consumer Electronics
      21. Market Estimates & Forecast, 2022-2030
      22. Market Estimates & Forecast by Region, 2022-2030
      23. Others
      24. Market Estimates & Forecast, 2022-2030
      25. Market Estimates & Forecast by Region, 2022-2030
    29. Introduction
    30. Commercial
    31. Market Estimates & Forecast, 2022-2030
    32. Market Estimates & Forecast by Region, 2022-2030
    33. Enterprise
    34. Market Estimates & Forecast, 2022-2030
    35. Market Estimates & Forecast by Region, 2022-2030
    36. Medical
    37. Market Estimates & Forecast, 2022-2030
    38. Market Estimates & Forecast by Region, 2022-2030
    39. Aerospace & Defense
    40. Market Estimates & Forecast, 2022-2030
    41. Market Estimates & Forecast by Region, 2022-2030
    42. Energy
    43. Market Estimates & Forecast, 2022-2030
    44. Market Estimates & Forecast by Region, 2022-2030
    45. Automotive
    46. Market Estimates & Forecast, 2022-2030
    47. Market Estimates & Forecast by Region, 2022-2030
    48. Consumer Electronics
    49. Market Estimates & Forecast, 2022-2030
    50. Market Estimates & Forecast by Region, 2022-2030
    51. Others
    52. Market Estimates & Forecast, 2022-2030
    53. Market Estimates & Forecast by Region, 2022-2030
    54. . Global Augmented Reality Market by Region
      1. Introduction
      2. North America
      3. Market Estimates & Forecast, 2022-2030
      4. Market Estimates & Forecast by Component, 2022-2030
      5. Market Estimates & Forecast by Technology, 2022-2030
      6. Market Estimates & Forecast by Type, 2022-2030
      7. Market Estimates & Forecast by Application, 2022-2030
      8. U.S.A
      9. Market Estimates & Forecast, 2022-2030
      10. Market Estimates & Forecast by Component, 2022-2030
      11. Market Estimates & Forecast by Technology, 2022-2030
      12. Market Estimates & Forecast by Type, 2022-2030
      13. Market Estimates & Forecast by Application, 2022-2030
      14. Mexico
      15. Market Estimates & Forecast, 2022-2030
      16. Market Estimates & Forecast by Component, 2022-2030
      17. Market Estimates & Forecast by Technology, 2022-2030
      18. Market Estimates & Forecast by Type, 2022-2030
      19. Market Estimates & Forecast by Application, 2022-2030
      20. Canada
      21. Market Estimates & Forecast, 2022-2030
      22. Market Estimates & Forecast by Component, 2022-2030
      23. Market Estimates & Forecast by Technology, 2022-2030
      24. Market Estimates & Forecast by Type, 2022-2030
      25. Market Estimates & Forecast by Application, 2022-2030
      26. Europe
      27. Market Estimates & Forecast, 2022-2030
      28. Market Estimates & Forecast by Component, 2022-2030
      29. Market Estimates & Forecast by Technology, 2022-2030
      30. Market Estimates & Forecast by Type, 2022-2030
      31. Market Estimates & Forecast by Application, 2022-2030
      32. Germany
      33. Market Estimates & Forecast, 2022-2030
      34. Market Estimates & Forecast by Component, 2022-2030
      35. Market Estimates & Forecast by Technology, 2022-2030
      36. Market Estimates & Forecast by Type, 2022-2030
      37. Market Estimates & Forecast by Application, 2022-2030
    55. Introduction
    56. North America
    57. Market Estimates & Forecast, 2022-2030
    58. Market Estimates & Forecast by Component, 2022-2030
    59. Market Estimates & Forecast by Technology, 2022-2030
    60. Market Estimates & Forecast by Type, 2022-2030
    61. Market Estimates & Forecast by Application, 2022-2030
    62. U.S.A
    63. Market Estimates & Forecast, 2022-2030
    64. Market Estimates & Forecast by Component, 2022-2030
    65. Market Estimates & Forecast by Technology, 2022-2030
    66. Market Estimates & Forecast by Type, 2022-2030
    67. Market Estimates & Forecast by Application, 2022-2030
    68. Mexico
    69. Market Estimates & Forecast, 2022-2030
    70. Market Estimates & Forecast by Component, 2022-2030
    71. Market Estimates & Forecast by Technology, 2022-2030
    72. Market Estimates & Forecast by Type, 2022-2030
    73. Market Estimates & Forecast by Application, 2022-2030
    74. Canada
    75. Market Estimates & Forecast, 2022-2030
    76. Market Estimates & Forecast by Component, 2022-2030
    77. Market Estimates & Forecast by Technology, 2022-2030
    78. Market Estimates & Forecast by Type, 2022-2030
    79. Market Estimates & Forecast by Application, 2022-2030
    80. Europe
    81. Market Estimates & Forecast, 2022-2030
    82. Market Estimates & Forecast by Component, 2022-2030
    83. Market Estimates & Forecast by Technology, 2022-2030
    84. Market Estimates & Forecast by Type, 2022-2030
    85. Market Estimates & Forecast by Application, 2022-2030
    86. Germany
    87. Market Estimates & Forecast, 2022-2030
    88. Market Estimates & Forecast by Component, 2022-2030
    89. Market Estimates & Forecast by Technology, 2022-2030
    90. Market Estimates & Forecast by Type, 2022-2030
    91. Market Estimates & Forecast by Application, 2022-2030
    92. . France
      1. Market Estimates & Forecast, 2022-2030
      2. Market Estimates & Forecast by Component, 2022-2030
      3. Market Estimates & Forecast by Technology, 2022-2030
      4. Market Estimates & Forecast by Type, 2022-2030
      5. Market Estimates & Forecast by Application, 2022-2030
      6. Italy
      7. Market Estimates & Forecast, 2022-2030
      8. Market Estimates & Forecast by Component, 2022-2030
      9. Market Estimates & Forecast by Technology, 2022-2030
      10. Market Estimates & Forecast by Type, 2022-2030
      11. Market Estimates & Forecast by Application, 2022-2030
      12. Spain
      13. Market Estimates & Forecast, 2022-2030
      14. Market Estimates & Forecast by Component, 2022-2030
      15. Market Estimates & Forecast by Technology 2022-2030
      16. Market Estimates & Forecast by Type, 2022-2030
      17. Market Estimates & Forecast by Application, 2022-2030
      18. UK
      19. Market Estimates & Forecast, 2022-2030
      20. Market Estimates & Forecast by Component, 2022-2030
      21. Market Estimates & Forecast by Technology, 2022-2030
      22. Market Estimates & Forecast by Type, 2022-2030
      23. Market Estimates & Forecast by Application, 2022-2030
      24. Asia Pacific
      25. Market Estimates & Forecast, 2022-2030
      26. Market Estimates & Forecast by Component, 2022-2030
      27. Market Estimates & Forecast by Technology, 2022-2030
      28. Market Estimates & Forecast by Type, 2022-2030
      29. Market Estimates & Forecast by Application, 2022-2030
      30. China
      31. Market Estimates & Forecast, 2022-2030
      32. Market Estimates & Forecast by Component, 2022-2030
      33. Market Estimates & Forecast by Technology, 2022-2030
      34. Market Estimates & Forecast by Type, 2022-2030
      35. Market Estimates & Forecast by Application, 2022-2030
      36. India
      37. Market Estimates & Forecast, 2022-2030
      38. Market Estimates & Forecast by Component, 2022-2030
      39. Market Estimates & Forecast by Technology, 2022-2030
      40. Market Estimates & Forecast by Type, 2022-2030
      41. Market Estimates & Forecast by Application, 2022-2030
      42. Japan
      43. Market Estimates & Forecast, 2022-2030
      44. Market Estimates & Forecast by Component, 2022-2030
      45. Market Estimates & Forecast by Technology, 2022-2030
      46. Market Estimates & Forecast by Type, 2022-2030
      47. Market Estimates & Forecast by Application, 2022-2030
      48. South Korea
      49. Market Estimates & Forecast, 2022-2030
      50. Market Estimates & Forecast by Component, 2022-2030
      51. Market Estimates & Forecast by Technology, 2022-2030
      52. Market Estimates & Forecast by Type, 2022-2030
      53. Market Estimates & Forecast by Application, 2022-2030
      54. Rest of Asia Pacific
      55. Market Estimates & Forecast, 2022-2030
      56. Market Estimates & Forecast by Component, 2022-2030
      57. Market Estimates & Forecast by Technology, 2022-2030
      58. Market Estimates & Forecast by Type, 2022-2030
      59. Market Estimates & Forecast by Application, 2022-2030
      60. Middle East & Africa
      61. Market Estimates & Forecast, 2022-2030
      62. Market Estimates & Forecast by Component, 2022-2030
      63. Market Estimates & Forecast by Technology, 2022-2030
      64. Market Estimates & Forecast by Type, 2022-2030
      65. Market Estimates & Forecast by Application, 2022-2030
      66. Latin America
      67. Market Estimates & Forecast, 2022-2030
      68. Market Estimates & Forecast by Component, 2022-2030
      69. Market Estimates & Forecast by Technology, 2022-2030
      70. Market Estimates & Forecast by Type, 2022-2030
      71. Market Estimates & Forecast by Application, 2022-2030
    93. Market Estimates & Forecast, 2022-2030
    94. Market Estimates & Forecast by Component, 2022-2030
    95. Market Estimates & Forecast by Technology, 2022-2030
    96. Market Estimates & Forecast by Type, 2022-2030
    97. Market Estimates & Forecast by Application, 2022-2030
    98. Italy
    99. Market Estimates & Forecast, 2022-2030
    100. Market Estimates & Forecast by Component, 2022-2030
    101. Market Estimates & Forecast by Technology, 2022-2030
    102. Market Estimates & Forecast by Type, 2022-2030
    103. Market Estimates & Forecast by Application, 2022-2030
    104. Spain
    105. Market Estimates & Forecast, 2022-2030
    106. Market Estimates & Forecast by Component, 2022-2030
    107. Market Estimates & Forecast by Technology 2022-2030
    108. Market Estimates & Forecast by Type, 2022-2030
    109. Market Estimates & Forecast by Application, 2022-2030
    110. UK
    111. Market Estimates & Forecast, 2022-2030
    112. Market Estimates & Forecast by Component, 2022-2030
    113. Market Estimates & Forecast by Technology, 2022-2030
    114. Market Estimates & Forecast by Type, 2022-2030
    115. Market Estimates & Forecast by Application, 2022-2030
    116. Asia Pacific
    117. Market Estimates & Forecast, 2022-2030
    118. Market Estimates & Forecast by Component, 2022-2030
    119. Market Estimates & Forecast by Technology, 2022-2030
    120. Market Estimates & Forecast by Type, 2022-2030
    121. Market Estimates & Forecast by Application, 2022-2030
    122. China
    123. Market Estimates & Forecast, 2022-2030
    124. Market Estimates & Forecast by Component, 2022-2030
    125. Market Estimates & Forecast by Technology, 2022-2030
    126. Market Estimates & Forecast by Type, 2022-2030
    127. Market Estimates & Forecast by Application, 2022-2030
    128. India
    129. Market Estimates & Forecast, 2022-2030
    130. Market Estimates & Forecast by Component, 2022-2030
    131. Market Estimates & Forecast by Technology, 2022-2030
    132. Market Estimates & Forecast by Type, 2022-2030
    133. Market Estimates & Forecast by Application, 2022-2030
    134. Japan
    135. Market Estimates & Forecast, 2022-2030
    136. Market Estimates & Forecast by Component, 2022-2030
    137. Market Estimates & Forecast by Technology, 2022-2030
    138. Market Estimates & Forecast by Type, 2022-2030
    139. Market Estimates & Forecast by Application, 2022-2030
    140. South Korea
    141. Market Estimates & Forecast, 2022-2030
    142. Market Estimates & Forecast by Component, 2022-2030
    143. Market Estimates & Forecast by Technology, 2022-2030
    144. Market Estimates & Forecast by Type, 2022-2030
    145. Market Estimates & Forecast by Application, 2022-2030
    146. Rest of Asia Pacific
    147. Market Estimates & Forecast, 2022-2030
    148. Market Estimates & Forecast by Component, 2022-2030
    149. Market Estimates & Forecast by Technology, 2022-2030
    150. Market Estimates & Forecast by Type, 2022-2030
    151. Market Estimates & Forecast by Application, 2022-2030
    152. Middle East & Africa
    153. Market Estimates & Forecast, 2022-2030
    154. Market Estimates & Forecast by Component, 2022-2030
    155. Market Estimates & Forecast by Technology, 2022-2030
    156. Market Estimates & Forecast by Type, 2022-2030
    157. Market Estimates & Forecast by Application, 2022-2030
    158. Latin America
    159. Market Estimates & Forecast, 2022-2030
    160. Market Estimates & Forecast by Component, 2022-2030
    161. Market Estimates & Forecast by Technology, 2022-2030
    162. Market Estimates & Forecast by Type, 2022-2030
    163. Market Estimates & Forecast by Application, 2022-2030
    164. . Company Landscape
    165. . Company Profiles
      1. Google, Inc.
      2. Company Overview
      3. Product/Business Segment Overview
      4. Financial Updates
      5. Key Developments
      6. Microsoft Corporation
      7. Company Overview
      8. Product/Business Segment Overview
      9. Financial Updates
      10. Key Developments
      11. PTC
      12. Company Overview
      13. Product/Business Segment Overview
      14. Financial Updates
      15. Key Developments
      16. Wikitude GmbH
      17. Company Overview
      18. Product/Business Segment Overview
      19. Financial Updates
      20. Key Developments
      21. DAQRI
      22. Company Overview
      23. Product/Business Segment Overview
      24. Financial Updates
      25. Key Developments
      26. Zugara, Inc.
      27. Company Overview
      28. Product/Business Segment Overview
      29. Financial Updates
      30. Key Developments
      31. Blippar
      32. Company Overview
      33. Product/Business Segment Overview
      34. Financial Updates
      35. Key Developments
      36. Upskill
      37. Company Overview
      38. Product/Business Segment Overview
      39. Financial Updates
      40. Key Developments
      41. Magic Leap
      42. Company Overview
      43. Product/Business Segment Overview
      44. Financial Updates
      45. Key Developments
      46. Osterhout Design Group
      47. Company Overview
      48. Product/Business Segment Overview
      49. Financial Updates
      50. Key Developments
      51. Infinity Augmented Reality, Inc.
      52. Company Overview
      53. Product/Business Segment Overview
      54. Financial Updates
      55. Key Developments
      56. Samsung Electronics Co. Ltd.
      57. Company Overview
      58. Product/Business Segment Overview
      59. Financial Updates
      60. Key Developments
      61. Atheer, Inc.
      62. Company Overview
      63. Product/Business Segment Overview
      64. Financial Updates
      65. Key Developments
      66. Apple, Inc.
      67. Company Overview
      68. Product/Business Segment Overview
      69. Financial Updates
      70. Key Developments
      71. Facebook Corporation
      72. Company Overview
      73. Product/Business Segment Overview
      74. Financial Updates
      75. Key Developments
      76. Scope AR
      77. Company Overview
      78. Product/Business Segment Overview
      79. Financial Updates
      80. Key Developments
      81. Inglobe Technologies
      82. Company Overview
      83. Product/Business Segment Overview
      84. Financial Updates
      85. Key Developments
      86. Embitel Technologies
      87. Company Overview
      88. Product/Business Segment Overview
      89. Financial Updates
      90. Key Developments
      91. Seiko Epson Corporation
      92. Company Overview
      93. Product/Business Segment Overview
      94. Financial Updates
      95. Key Developments
      96. Marxent Labs LLC
      97. Company Overview
      98. Product/Business Segment Overview
      99. Financial Updates
      100. Key Developments
      101. Catchoom Technologies
      102. Company Overview
      103. Product/Business Segment Overview
      104. Financial Updates
      105. Key Developments
      106. HTC Corporation
      107. Company Overview
      108. Product/Business Segment Overview
      109. Financial Updates
      110. Key Developments
      111. Qualcomm
      112. Company Overview
      113. Product/Business Segment Overview
      114. Financial Updates
      115. Key Developments
      116. Rockwell Collins
      117. Company Overview
      118. Product/Business Segment Overview
      119. Financial Updates
      120. Key Developments 13 Conclusion LIST OF TABLES Table 1 Global Augmented Reality Market: By Region, 2022-2030 Table 2 North America Augmented Reality Market: By Country, 2022-2030 Table 3 Europe Augmented Reality Market: By Country, 2022-2030 Table 4 Asia-Pacific Augmented Reality Market: By Country, 2022-2030 Table 5 Middle East & Africa Augmented Reality Market: By Country, 2022-2030 Table 6 Latin America Augmented Reality Market: By Country, 2022-2030 Table 7 Global Augmented Reality by Component Market: By Regions, 2022-2030 Table 8 North America Augmented Reality by Component Market: By Country, 2022-2030 Table9 Europe Augmented Reality by Component Market: By Country, 2022-2030 Table10 Asia-Pacific Augmented Reality by Component Market: By Country, 2022-2030 Table11 Middle East & Africa Augmented Reality by Component Market: By Country, 2022-2030 Table12 Latin America Augmented Reality by Component Market: By Country, 2022-2030 Table13 Global Augmented Reality by Application Market: By Regions, 2022-2030 Table14 North America Augmented Reality by Application Market: By Country, 2022-2030 Table15 Europe Augmented Reality by Application Market: By Country, 2022-2030 Table16 Asia-Pacific Augmented Reality by Application Market: By Country, 2022-2030 Table17 Middle East & Africa Augmented Reality by Application Market: By Country, 2022-2030 Table18 Latin America Augmented Reality by Application Market: By Country, 2022-2030 Table19 North America Augmented Reality for Type Market: By Country, 2022-2030 Table20 Europe Augmented Reality for Type Market: By Country, 2022-2030 Table21 Asia-Pacific Augmented Reality for Type Market: By Country, 2022-2030 Table22 Middle East & Africa Augmented Reality for Type Market: By Country, 2022-2030 Table23 Latin America Augmented Reality for Type Market: By Country, 2022-2030 Table24 Global Component Market: By Region, 2022-2030 Table25 Global Type Market: By Region, 2022-2030 Table26 Global Type Market: By Region, 2022-2030 Table27 North America Augmented Reality Market, By Country Table28 North America Augmented Reality Market, By Component Table29 North America Augmented Reality Market, By Technology Table30 North America Augmented Reality Market, By Type Table31 North America Augmented Reality Market, By Application Table32 Europe: Augmented Reality Market, By Country Table33 Europe: Augmented Reality Market, By Component Table34 Europe: Augmented Reality Market, By Technology Table35 Europe: Augmented Reality Market, By Type Table 36 Europe: Augmented Reality Market, By Application Table37 Asia-Pacific: Augmented Reality Market, By Country Table38 Asia-Pacific: Augmented Reality Market, By Component Table39 Asia-Pacific: Augmented Reality Market, By Technology Table40 Asia-Pacific: Augmented Reality Market, By Type Table 41 Asia-Pacific: Augmented Reality Market, By Application Table42 Middle East & Africa: Augmented Reality Market, By Country Table43 Middle East & Africa Augmented Reality Market, By Component Table44 Middle East & Africa Augmented Reality Market, By Technology Table45 Middle East & Africa: Augmented Reality Market, By Type Table46 Middle East & Africa: Augmented Reality Market, By Application Table47 Latin America: Augmented Reality Market, By Country Table48 Latin America Augmented Reality Market, By Component Table49 Latin America Augmented Reality Market, By Technology Table50 Latin America: Augmented Reality Market, By Type Table51 Latin America: Augmented Reality Market, By Application LIST OF FIGURES FIGURE 1 Global Augmented Reality market segmentation FIGURE 2 Forecast Methodology FIGURE 3 Five Forces Analysis of Global Augmented Reality Market FIGURE 4 Value Chain of Global Augmented Reality Market FIGURE 5 Share of Global Augmented Reality Market in 2020, by country (in %) FIGURE 6 Global Augmented Reality Market, 2022-2030, FIGURE 7 Sub segments of Component FIGURE 10 Global Augmented Reality Market size by Component, 2020 FIGURE 11 Share of Global Augmented Reality Market by Component, 2022 TO 2030 FIGURE 12 Global Augmented Reality Market size by Technology, 2020 FIGURE 13 Share of Global Augmented Reality Market by Technology, 2022 TO 2030 FIGURE 14 Global Augmented Reality Market size by Type, 2020 FIGURE 15 Share of Global Augmented Reality Market by Type, 2022 TO 2030 FIGURE 16 Global Augmented Reality Market size by Application, 2022 TO 2030 FIGURE 17 Share of Global Augmented Reality Market by Application, 2022 TO 2030
    166. Google, Inc.
    167. Company Overview
    168. Product/Business Segment Overview
    169. Financial Updates
    170. Key Developments
    171. Microsoft Corporation
    172. Company Overview
    173. Product/Business Segment Overview
    174. Financial Updates
    175. Key Developments
    176. PTC
    177. Company Overview
    178. Product/Business Segment Overview
    179. Financial Updates
    180. Key Developments
    181. Wikitude GmbH
    182. Company Overview
    183. Product/Business Segment Overview
    184. Financial Updates
    185. Key Developments
    186. DAQRI
    187. Company Overview
    188. Product/Business Segment Overview
    189. Financial Updates
    190. Key Developments
    191. Zugara, Inc.
    192. Company Overview
    193. Product/Business Segment Overview
    194. Financial Updates
    195. Key Developments
    196. Blippar
    197. Company Overview
    198. Product/Business Segment Overview
    199. Financial Updates
    200. Key Developments
    201. Upskill
    202. Company Overview
    203. Product/Business Segment Overview
    204. Financial Updates
    205. Key Developments
    206. Magic Leap
    207. Company Overview
    208. Product/Business Segment Overview
    209. Financial Updates
    210. Key Developments
    211. Osterhout Design Group
    212. Company Overview
    213. Product/Business Segment Overview
    214. Financial Updates
    215. Key Developments
    216. Infinity Augmented Reality, Inc.
    217. Company Overview
    218. Product/Business Segment Overview
    219. Financial Updates
    220. Key Developments
    221. Samsung Electronics Co. Ltd.
    222. Company Overview
    223. Product/Business Segment Overview
    224. Financial Updates
    225. Key Developments
    226. Atheer, Inc.
    227. Company Overview
    228. Product/Business Segment Overview
    229. Financial Updates
    230. Key Developments
    231. Apple, Inc.
    232. Company Overview
    233. Product/Business Segment Overview
    234. Financial Updates
    235. Key Developments
    236. Facebook Corporation
    237. Company Overview
    238. Product/Business Segment Overview
    239. Financial Updates
    240. Key Developments
    241. Scope AR
    242. Company Overview
    243. Product/Business Segment Overview
    244. Financial Updates
    245. Key Developments
    246. Inglobe Technologies
    247. Company Overview
    248. Product/Business Segment Overview
    249. Financial Updates
    250. Key Developments
    251. Embitel Technologies
    252. Company Overview
    253. Product/Business Segment Overview
    254. Financial Updates
    255. Key Developments
    256. Seiko Epson Corporation
    257. Company Overview
    258. Product/Business Segment Overview
    259. Financial Updates
    260. Key Developments
    261. Marxent Labs LLC
    262. Company Overview
    263. Product/Business Segment Overview
    264. Financial Updates
    265. Key Developments
    266. Catchoom Technologies
    267. Company Overview
    268. Product/Business Segment Overview
    269. Financial Updates
    270. Key Developments
    271. HTC Corporation
    272. Company Overview
    273. Product/Business Segment Overview
    274. Financial Updates
    275. Key Developments
    276. Qualcomm
    277. Company Overview
    278. Product/Business Segment Overview
    279. Financial Updates
    280. Key Developments
    281. Rockwell Collins
    282. Company Overview
    283. Product/Business Segment Overview
    284. Financial Updates
    285. Key Developments 13 Conclusion LIST OF TABLES Table 1 Global Augmented Reality Market: By Region, 2022-2030 Table 2 North America Augmented Reality Market: By Country, 2022-2030 Table 3 Europe Augmented Reality Market: By Country, 2022-2030 Table 4 Asia-Pacific Augmented Reality Market: By Country, 2022-2030 Table 5 Middle East & Africa Augmented Reality Market: By Country, 2022-2030 Table 6 Latin America Augmented Reality Market: By Country, 2022-2030 Table 7 Global Augmented Reality by Component Market: By Regions, 2022-2030 Table 8 North America Augmented Reality by Component Market: By Country, 2022-2030 Table9 Europe Augmented Reality by Component Market: By Country, 2022-2030 Table10 Asia-Pacific Augmented Reality by Component Market: By Country, 2022-2030 Table11 Middle East & Africa Augmented Reality by Component Market: By Country, 2022-2030 Table12 Latin America Augmented Reality by Component Market: By Country, 2022-2030 Table13 Global Augmented Reality by Application Market: By Regions, 2022-2030 Table14 North America Augmented Reality by Application Market: By Country, 2022-2030 Table15 Europe Augmented Reality by Application Market: By Country, 2022-2030 Table16 Asia-Pacific Augmented Reality by Application Market: By Country, 2022-2030 Table17 Middle East & Africa Augmented Reality by Application Market: By Country, 2022-2030 Table18 Latin America Augmented Reality by Application Market: By Country, 2022-2030 Table19 North America Augmented Reality for Type Market: By Country, 2022-2030 Table20 Europe Augmented Reality for Type Market: By Country, 2022-2030 Table21 Asia-Pacific Augmented Reality for Type Market: By Country, 2022-2030 Table22 Middle East & Africa Augmented Reality for Type Market: By Country, 2022-2030 Table23 Latin America Augmented Reality for Type Market: By Country, 2022-2030 Table24 Global Component Market: By Region, 2022-2030 Table25 Global Type Market: By Region, 2022-2030 Table26 Global Type Market: By Region, 2022-2030 Table27 North America Augmented Reality Market, By Country Table28 North America Augmented Reality Market, By Component Table29 North America Augmented Reality Market, By Technology Table30 North America Augmented Reality Market, By Type Table31 North America Augmented Reality Market, By Application Table32 Europe: Augmented Reality Market, By Country Table33 Europe: Augmented Reality Market, By Component Table34 Europe: Augmented Reality Market, By Technology Table35 Europe: Augmented Reality Market, By Type Table 36 Europe: Augmented Reality Market, By Application Table37 Asia-Pacific: Augmented Reality Market, By Country Table38 Asia-Pacific: Augmented Reality Market, By Component Table39 Asia-Pacific: Augmented Reality Market, By Technology Table40 Asia-Pacific: Augmented Reality Market, By Type Table 41 Asia-Pacific: Augmented Reality Market, By Application Table42 Middle East & Africa: Augmented Reality Market, By Country Table43 Middle East & Africa Augmented Reality Market, By Component Table44 Middle East & Africa Augmented Reality Market, By Technology Table45 Middle East & Africa: Augmented Reality Market, By Type Table46 Middle East & Africa: Augmented Reality Market, By Application Table47 Latin America: Augmented Reality Market, By Country Table48 Latin America Augmented Reality Market, By Component Table49 Latin America Augmented Reality Market, By Technology Table50 Latin America: Augmented Reality Market, By Type Table51 Latin America: Augmented Reality Market, By Application LIST OF FIGURES FIGURE 1 Global Augmented Reality market segmentation FIGURE 2 Forecast Methodology FIGURE 3 Five Forces Analysis of Global Augmented Reality Market FIGURE 4 Value Chain of Global Augmented Reality Market FIGURE 5 Share of Global Augmented Reality Market in 2020, by country (in %) FIGURE 6 Global Augmented Reality Market, 2022-2030, FIGURE 7 Sub segments of Component FIGURE 10 Global Augmented Reality Market size by Component, 2020 FIGURE 11 Share of Global Augmented Reality Market by Component, 2022 TO 2030 FIGURE 12 Global Augmented Reality Market size by Technology, 2020 FIGURE 13 Share of Global Augmented Reality Market by Technology, 2022 TO 2030 FIGURE 14 Global Augmented Reality Market size by Type, 2020 FIGURE 15 Share of Global Augmented Reality Market by Type, 2022 TO 2030 FIGURE 16 Global Augmented Reality Market size by Application, 2022 TO 2030 FIGURE 17 Share of Global Augmented Reality Market by Application, 2022 TO 2030
    286. List of Tables and Figures
      1. Table FIGURE 1 Global Augmented Reality market segmentation FIGURE 2 Forecast Methodology FIGURE 3 Five Forces Analysis of Global Augmented Reality Market FIGURE 4 Value Chain of Global Augmented Reality Market FIGURE 5 Share of Global Augmented Reality Market in 2020, by country (in %) FIGURE 6 Global Augmented Reality Market, 2022-2030, FIGURE 7 Sub segments of Component FIGURE 10 Global Augmented Reality Market size by Component, 2020 FIGURE 11 Share of Global Augmented Reality Market by Component, 2022 TO 2030 FIGURE 12 Global Augmented Reality Market size by Technology, 2020 FIGURE 13 Share of Global Augmented Reality Market by Technology, 2022 TO 2030 FIGURE 14 Global Augmented Reality Market size by Type, 2020 FIGURE 15 Share of Global Augmented Reality Market by Type, 2022 TO 2030 FIGURE 16 Global Augmented Reality Market size by Application, 2022 TO 2030 FIGURE 17 Share of Global Augmented Reality Market by Application, 2022 TO 2030
    287. Table FIGURE 1 Global Augmented Reality market segmentation FIGURE 2 Forecast Methodology FIGURE 3 Five Forces Analysis of Global Augmented Reality Market FIGURE 4 Value Chain of Global Augmented Reality Market FIGURE 5 Share of Global Augmented Reality Market in 2020, by country (in %) FIGURE 6 Global Augmented Reality Market, 2022-2030, FIGURE 7 Sub segments of Component FIGURE 10 Global Augmented Reality Market size by Component, 2020 FIGURE 11 Share of Global Augmented Reality Market by Component, 2022 TO 2030 FIGURE 12 Global Augmented Reality Market size by Technology, 2020 FIGURE 13 Share of Global Augmented Reality Market by Technology, 2022 TO 2030 FIGURE 14 Global Augmented Reality Market size by Type, 2020 FIGURE 15 Share of Global Augmented Reality Market by Type, 2022 TO 2030 FIGURE 16 Global Augmented Reality Market size by Application, 2022 TO 2030 FIGURE 17 Share of Global Augmented Reality Market by Application, 2022 TO 2030

    Augmented Reality (AR) Market Segmentation

    Augmented Reality (AR) Device Type Outlook (USD Billion, 2018-2032)

    Head Mounted Display

    Head up Display

    Augmented Reality (AR) Vertical Outlook (USD Billion, 2018-2032)

    Consumer Electronics

    Commercial

    Aerospace & Defense

    Medical

    Augmented Reality (AR) Technology Outlook (USD Billion, 2018-2032)

    Marker Based

    Marker Less

    Augmented Reality (AR) Regional Outlook (USD Billion, 2018-2032)

    North AmericaOutlook (USD Billion, 2018-2032)

    North America Augmented Reality (AR) by Device Type

    Head Mounted Display

    Head up Display

    North America Augmented Reality (AR) by Vertical

    Consumer Electronics

    Commercial

    Bio-PET

    Medical

    North America Augmented Reality (AR) by Technology
    •  
      •  

    Marker Based

    Marker Less

    US Outlook (USD Billion, 2018-2032)

    US Augmented Reality (AR) by Device Type

    Head Mounted Display

    Head up Display

    US Augmented Reality (AR) by Vertical

    Consumer Electronics

    Commercial

    Aerospace & Defense

    Medical

    US Augmented Reality (AR) by Technology
    •  
      •  

    Marker Based

    Marker Less

    CANADA Outlook (USD Billion, 2018-2032)

    CANADA Augmented Reality (AR) by Device Type

    Head Mounted Display

    Head up Display

    CANADA Augmented Reality (AR) by Vertical

    Consumer Electronics

    Commercial

    Aerospace & Defense

    CANADA Augmented Reality (AR) by Technology
    •  
      •  

    Marker Based

    Marker Less

    Europe Outlook (USD Billion, 2018-2032)

    Europe Augmented Reality (AR) by Device Type

    Head Mounted Display

    Head up Display

    Europe Augmented Reality (AR) by Vertical

    Consumer Electronics

    Commercial

    Aerospace & Defense

    Medical

    Europe Augmented Reality (AR) by Technology
    •  
      •  

    Marker Based

    Marker Less

    Germany Outlook (USD Billion, 2018-2032)

    Germany Augmented Reality (AR) by Device Type

    Head Mounted Display

    Head up Display

    Germany Augmented Reality (AR) Vertical

    Consumer Electronics

    Commercial

    Aerospace & Defense

    Medical

    Germany Augmented Reality (AR) by Technology
    •  
      •  

    Marker Based

    Marker Less

    France Outlook (USD Billion, 2018-2032)

    France Augmented Reality (AR) by Device Type

    Head Mounted Display

    Head up Display

    France Augmented Reality (AR) by Vertical

    Consumer Electronics

    Bio-PA

    Aerospace & Defense

    Medical

    France Augmented Reality (AR) by Technology
    •  
      •  

    Marker Based

    Marker Less

    UK Outlook (USD Billion, 2018-2032)

    UK Augmented Reality (AR) by Device Type

    Head Mounted Display

    Head up Display

    UK Augmented Reality (AR) by Vertical

    Consumer Electronics

    Commercial

    Aerospace & Defense

    Medical

    UK Augmented Reality (AR) by Technology
    •  
      •  

    Marker Based

    Marker Less

    ITALY Outlook (USD Billion, 2018-2032)

    ITALY Augmented Reality (AR) by Device Type

    Head Mounted Display

    Head up Display

    ITALY Augmented Reality (AR) by Vertical

    Consumer Electronics

    Commercial

    Aerospace & Defense

    Medical

    ITALY Augmented Reality (AR) by Technology
    •  
      •  

    Marker Based

    Marker Less

    SPAIN Outlook (USD Billion, 2018-2032)

    Spain Augmented Reality (AR) by Device Type

    Head Mounted Display

    Head up Display

    Spain Augmented Reality (AR) by Vertical

    Consumer Electronics

    Bio-PA

    Aerospace & Defense

    Medical

    Spain Augmented Reality (AR) by Technology
    •  
      •  

    Marker Based

    Marker Less

    Rest Of Europe Outlook (USD Billion, 2018-2032)

    Rest Of Europe Augmented Reality (AR) by Device Type

    Head Mounted Display

    Head up Display

    REST OF EUROPE Augmented Reality (AR) by Vertical

    Consumer Electronics

    Commercial

    Aerospace & Defense

    Medical

    REST OF EUROPE Augmented Reality (AR) by Technology
    •  
      •  

    Marker Based

    Marker Less

    Asia-Pacific Outlook (USD Billion, 2018-2032)

    Asia-Pacific Augmented Reality (AR) by Device Type

    Head Mounted Display

    Head up Display

    Asia-Pacific Augmented Reality (AR) by Vertical

    Consumer Electronics

    Commercial

    Aerospace & Defense

    Medical

    Asia-Pacific Augmented Reality (AR) by Technology
    •  
      •  

    Marker Based

    Marker Less

    China Outlook (USD Billion, 2018-2032)

    China Augmented Reality (AR) by Device Type

    Head Mounted Display

    Head up Display

    China Augmented Reality (AR) by Vertical

    Consumer Electronics

    Commercial

    Aerospace & Defense

    Medical

    China Augmented Reality (AR) by Technology
    •  
      •  

    Marker Based

    Marker Less

    Japan Outlook (USD Billion, 2018-2032)

    Japan Augmented Reality (AR) by Device Type

    Head Mounted Display

    Head up Display

    Japan Augmented Reality (AR) by Vertical

    Consumer Electronics

    Commercial

    Aerospace & Defense

    Medical

    Japan Augmented Reality (AR) by Technology
    •  
      •  

    Marker Based

    Marker Less

    India Outlook (USD Billion, 2018-2032)

    India Augmented Reality (AR) by Device Type

    Head Mounted Display

    Head up Display

    India Augmented Reality (AR) by Vertical

    Consumer Electronics

    Commercial

    Aerospace & Defense

    Medical

    India Augmented Reality (AR) by Technology
    •  
      •  

    Marker Based

    Marker Less

    Australia Outlook (USD Billion, 2018-2032)

    Australia Augmented Reality (AR) by Device Type

    Head Mounted Display

    Head up Display

    Australia Augmented Reality (AR) by Vertical

    Consumer Electronics

    Bio-PA

    Aerospace & Defense

    Medical

    Australia Augmented Reality (AR) by Technology
    •  
      •  

    Marker Based

    Marker Less

    Rest of Asia-Pacific Outlook (USD Billion, 2018-2032)

    Rest of Asia-Pacific Augmented Reality (AR) by Device Type

    Head Mounted Display

    Head up Display

    Rest of Asia-Pacific Augmented Reality (AR) by Vertical

    Consumer Electronics

    Commercial

    Aerospace & Defense

    Medical

    Rest of Asia-Pacific Augmented Reality (AR) by Technology
    •  
      •  

    Marker Based

    Marker Less

    Rest of the World Outlook (USD Billion, 2018-2032)

    Rest of the World Augmented Reality (AR) by Device Type

    Head Mounted Display

    Head up Display

    Rest of the World Augmented Reality (AR) by Vertical

    Consumer Electronics

    Commercial

    Aerospace & Defense

    Medical

    Rest of the World Augmented Reality (AR) by Technology
    •  
      •  

    Marker Based

    Marker Less

    Middle East Outlook (USD Billion, 2018-2032)

    Middle East Augmented Reality (AR) by Device Type

    Head Mounted Display

    Head up Display

    Middle East Augmented Reality (AR) by Vertical

    Consumer Electronics

    Commercial

    Aerospace & Defense

    Medical

    Middle East Augmented Reality (AR) by Technology
    •  
      •  

    Marker Based

    Marker Less

    Africa Outlook (USD Billion, 2018-2032)

    Africa Augmented Reality (AR) by Device Type

    Head Mounted Display

    Head up Display

    Africa Augmented Reality (AR) by Vertical

    Consumer Electronics

    Commercial

    Aerospace & Defense

    Medical

    Africa Augmented Reality (AR) by Technology
    •  
      •  

    Marker Based

    Marker Less

    Latin America Outlook (USD Billion, 2018-2032)

    Latin America Augmented Reality (AR) by Device Type

    Head Mounted Display

    Head up Display

    Latin America Augmented Reality (AR) by Vertical

    Consumer Electronics

    Commercial

    Aerospace & Defense

    Medical

    Latin America Augmented Reality (AR) by Technology
    •  
      •  

    Marker Based

    Marker Less


    Infographic

    Free Sample Request

    Kindly complete the form below to receive a free sample of this Report

    Get Free Sample

    Customer Strories

    “I am very pleased with how market segments have been defined in a relevant way for my purposes (such as "Portable Freezers & refrigerators" and "last-mile"). In general the report is well structured. Thanks very much for your efforts.”

    Victoria Milne

    Founder
    Case Study
    Chemicals and Materials