• Cat-intel
  • MedIntelliX
  • Resources
  • About Us
  • Hero Background
    English
    Chinese
    French
    Japanese
    Korean
    German
    Spanish

    Asia Pacific Aluminum Market Share

    ID: MRFR/CnM/16269-HCR
    128 Pages
    Anshula Mandaokar
    October 2025

    Asia Pacific Aluminum Market Research Report Information By Type (Secondary/Recycled Aluminum and Primary Aluminum), By Product (Flat Rolled, Pigment & Powder, Forgings, Extrusions, Castings, Rod & Bar and Others), By Application (Building & Construction, Consumer Goods, Electrical, Foil & Packaging, Hardware & Accessories, Machinery & Equipment, Solar Industry, Transpor...

    Share:
    Download PDF ×

    We do not share your information with anyone. However, we may send you emails based on your report interest from time to time. You may contact us at any time to opt-out.

    Asia Pacific Aluminum Market Infographic
    $ 4,950.0
    $ 5,950.0
    $ 7,250.0

    Market Share

    Asia Pacific Aluminum Market Share Analysis

    The Asia Pacific Aluminum Market is currently witnessing as a dynamic landscape then forcing companies to adopt different market share positioning strategies in order for them to navigate this changing terrain. The main tactic here is having continuous differentiation of products. These industries have been striving to develop unique aluminum product with diverse properties and applications that are capable of meeting the needs of various sectors across region. By being ahead in technology while making some particular kind of alloy of aluminum, these firms wish to get the attention from such manufacturers who always want high quality performance materials on their own intended uses.

    Another significant market share positioning strategy in the Asia Pacific Aluminum Market is cost leadership. As cost effectiveness becomes more and more essential, companies are investing in innovative production processes and supply chain optimization aimed at reducing production costs. Through offering competitively priced but good quality aluminum products, firms target customers across a wide range including those within price sensitive sectors. It also helps in penetrating into the market without forgetting having long term sustainability within competitive aluminum markets.

    In shaping company’s position in the Asia Pacific Aluminum Market, collaboration and partnerships have been important. To improve their supply chains organizations are entering into strategic alliances with raw material suppliers, end users and industry associations which in turn enable them gather information about what consumers’ needs (and wants) as well as answering common problems like volatile commodity prices and disruptions happening in supply chain. In addition, fostering a collaborative ecosystem assists businesses enhances their adaptability and resilience whenever there are regular shifts occurring within a market.

    Geographic expansion is another important aspect of market share positioning when it comes to the Asia Pacific Aluminum Market. Given that the region has experienced robust industrial growths, companies can now locate manufacturing plants or distribution networks closer to emerging markets through strategic expansion efforts. This not only opens up opportunities but also aids in ensuring timely deliveries by bringing companies closer to their clients thus improving customer service delivery.

    Technological innovation remains key among other strategies for achieving market position in the Asia Pacific Aluminum Market. Enhancing manufacturing processes, energy efficiency and minimizing environmental pollution are some of the key areas being targeted through R&D. In this regard aluminum processing technologies like smelting and extrusion are not only useful for product quality but also vital to the overall sustainability of regional aluminum industry.

    Market Summary

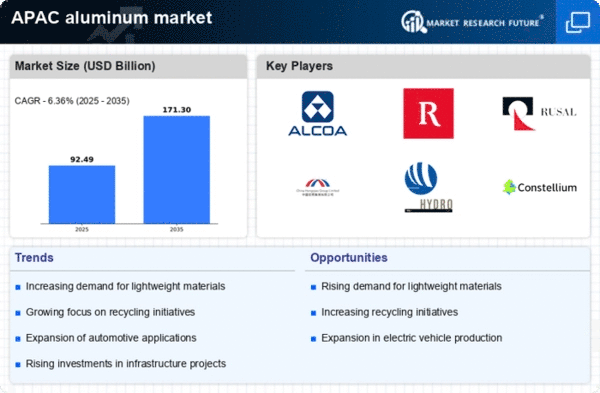
    As per Market Research Future Analysis, the Asia Pacific Aluminum Market was valued at USD 82.04 Billion in 2024 and is projected to grow from USD 82.04 Billion in 2024 to USD 187.46 Billion by 2035, with a CAGR of 7.80% during the forecast period. Key drivers include a focus on sustainability, advancements in aluminum processing technologies, and rising demand from the construction and packaging sectors. The secondary/recycled aluminum segment led the market in 2022, while extrusions dominated product types. The building and construction application generated the most revenue, driven by rapid urbanization and infrastructure development in countries like India and China.

    Key Market Trends & Highlights

    The Asia Pacific Aluminum Market is witnessing significant growth driven by various factors.

    • Market Size in 2024: USD 82.04 Billion.
    • Projected Market Size by 2035: USD 187.46 Billion.
    • CAGR from 2025 to 2035: 7.80%.
    • India's real estate sector expected to reach USD 1 trillion by 2030.

    Market Size & Forecast

    2024 Market Size USD 82.04 Billion
    2035 Market Size USD 187.46 Billion
    CAGR 7.80%

    Major Players

    Key players include Alcoa Corporation, Vedanta Ltd., Norsk Hydro ASA, and China Hongqiao Group.

    Market Trends

    Rising Building Sector in Asia-Pacific to Accelerate Market Growth

    India and the ASEAN region's construction industries are among the fastest-growing, and it is projected that they will hold a sizable portion of the global construction market. Building activity has grown significantly in the Asia-Pacific region, which includes Indonesia, Singapore, Thailand, Vietnam, the Philippines, and India. By 2030, the real estate sector in India is expected to grow to a GDP of USD 1 trillion, or roughly 13% of the total.

    Additionally, between April 2000 and June 2020, the construction development and infrastructure activities sectors received foreign direct investment (FDI) of USD 25.69 billion and USD 16.97 billion, respectively, according to the Department for Promotion of Industry and Internal Trade (DPIIT). In the initial phase of its 300,000-unit housing project, which was finished by 2018, the South Korean government had stated plans to build 35,000 housing units. The region's demand for aluminum from the construction industry is expected to rise over the course of the projection period due to the previously mentioned factors.

    Moreover, since aluminum is non-toxic, it preserves food for extended periods of time and prevents the spread of microbes. These factors are the main drivers of the aluminum market's growth, particularly from the food and packaging and pharmaceutical industries. In the manufacturing industry, packaging is one of the most crucial considerations for ensuring that their products are aesthetically pleasing to customers. Manufacturing, food processing, and industrial production facilities are growing quickly, which is driving up the worldwide packaging market. In addition, the e-retail sector and the food and beverage industry's demand have resulted in a large rise in packaging requirements.

    The need for aluminum is also being fueled by the expansion of retail pharmacies in emerging nations and the pharmaceutical industry's rising emphasis on product differentiation and brand promotion. Furthermore, the demand for medicines is rising as a result of different governments' emphasis on bolstering healthcare infrastructure and insurance coverage, which is itself driving market expansion. Thus, driving the aluminum market revenue.

    In February 2024, Vedanta Aluminium, the biggest aluminium manufacturer in India, introduces Vedanta Metal Bazaar, a groundbreaking online store for primary aluminium. This platform aims to revolutionize the purchasing and selling process of aluminium in India. During its inception, the superstore provides more than 750 different product variations, which include a wide range of items from Vedanta Aluminium. Additionally, it incorporates AI-driven price determination, providing clients with unparalleled value even when confronted with volatile commodity prices. Vedanta Aluminium has introduced Vedanta Metal Bazaar, an innovative e-commerce platform aimed at improving the customer experience and making it easier to conduct business.

    This platform has the potential to transform the way customers purchase aluminium. This solution guarantees to streamline the entire procurement process, allowing buyers to concentrate on their business expansion instead of spending time on transactional follow-ups and monitoring the uncertainties of commodity pricing and order fulfillment. Vedanta Metal Bazaar provides buyers with timely delivery, AI-driven pricing discovery, and complete visibility of their purchase process, from placing the order to receiving the delivery. This enables the implementation of a strong and reliable production planning system, while also releasing their cash for other important expenditures.

    Additionally, it empowers customers to make well-informed buying selections by considering their order history, dynamic market situations, and comparative prices with only a few simple clicks.

    Asia Pacific Aluminum Market Market Drivers

    Market Segment Insights

    Aluminum Type Insights

    The Asia Pacific Aluminum market segmentation, based on type includes Secondary/Recycled Aluminum and Primary Aluminum. The secondary/recycled aluminum category led the market in 2022. It is a real closed-loop process that turns scrap aluminum into new aluminum. There have been favorable environmental and economic effects on consumers as well as various businesses from the increased use of recycled aluminum in production and manufacturing. Additionally, the fabrication of secondary aluminum uses only 5% of the energy needed to produce primary aluminum, reducing greenhouse gas emissions and landfill trash.

    Figure 1: Asia Pacific Aluminum Market, by Type, 2022 & 2032 (USD Billion)

    Source: Secondary Research, Primary Research, Market Research Future Database and Analyst Review

    Aluminum Product Insights

    The Asia Pacific Aluminum market segmentation, based on product includes Flat Rolled, Pigment & Powder, Forgings, Extrusions, Castings, Rod & Bar and Others. The extrusions category led the market in 2022. There are countless uses for extrusion in the fields of architecture, automotive, electronics, aerospace, and energy. The major market for extruded aluminum is building and construction. It is present in aluminum panels, stairways, railings, and framing elements. They are gradually taking the place of conventional iron, concrete, and wood building materials.

    Aluminum Resin Application Insights

    The Asia Pacific Aluminum market segmentation, based on resin application, includes Building & Construction, Consumer Goods, Electrical, Foil & Packaging, Hardware & Accessories, Machinery & Equipment, Solar Industry, Transportation, Utensils and Others. The building & construction category generated the most income. The building and construction industries are expanding favorably as a result of rapid urbanization and the expansion of the service sector. Aluminum production costs were lowered by over 80% through the use of the electrolysis method, which boosted the use of aluminum in the building sector.

    Because aluminum can withstand temperatures between –80 °C and +300 °C, its minimum design service life is typically around 80 years. As a result, aluminum is predicted to become more popular in the building industry.

    Aluminum Country Insights

    During the projection period, the Asia-Pacific region is anticipated to hold the greatest market share for aluminum. The building and construction, electronics, aerospace, and other industries are expanding in nations like China, India, and Japan. The world's largest car manufacturing sector is found in China. The China Association of Automobile Manufacturers reports that the nation manufactured 27.02 million automobiles in 2022, up almost 3.4% from 26.08 million in 2021.

    Source: Secondary Research, Primary Research, Market Research Future Database and Analyst Review

    Get more detailed insights about Asia Pacific Aluminum Market Research Report—Forecast till 2032

    Regional Insights

    Key Players and Competitive Insights

    Leading market players are investing heavily in research and development in order to expand their product lines, which will help the aluminum market, grow even more. Market participants are also undertaking a variety of strategic activities to expand their  footprint, with important market developments including new product launches, contractual agreements, mergers and acquisitions, higher investments, and collaboration with other organizations. To expand and survive in a more competitive and rising market climate, aluminum industry must offer cost-effective items.

    Major players in the aluminum market are attempting to increase market demand by investing in research and development operations includes Alcoa Corporation (U.S.), Aluminum Bahrain (Bahrain), Century Aluminum Company (U.S.), Aluminum Corporation of China (China), Norsk Hydro ASA (Norway), Rio Tinto Alcan Inc. (Canada), China Hongqiao Group (China), Emirates Asia Pacific Aluminum PJSC (UAE), Hindalco Industries Limited (India), Rio Tinto Australia (Australia), BHP Billiton Aluminum Australia Pty Ltd. (Australia), RUSAL (Russia), and Vedanta Ltd. (India).

    Key Companies in the Asia Pacific Aluminum Market market include

    Industry Developments

    July 2023: Three of the immune-boosting lemonades from GUNNA Drinks, a soda brand that advocates against plastic use, come in a range of aluminum bottles. This action aims to address the rising demand for functional food and drink items while reducing the amount of plastic waste generated.

    December 2021: An agreement was signed by Hindalco Industries Limited to purchase the Indian operations of Norsk Hydro ASA's Al extrusions division. Hindalco will benefit from this acquisition by gaining an integrated plant in Andhra Pradesh, a skilled workforce, and knowledge of value-added, bespoke products. Additionally, this action will increase the company's presence in South India.

    In July 2024, ATK, a Chinese peripheral manufacturer, introduced a new mechanical keyboard called the ATK Z87 Pro. This keyboard offers a range of features that appeal to consumers who are mindful of their budget as well as those who prioritize performance. The Z87 Pro features a tiny 87-key layout, eliminating the numeric keypad to create a space-efficient design that is popular among both gamers and minimalists. The keyboard features a stylish semi-aluminum casing with a CNC anodized metal top cover, providing a combination of sturdiness and high-quality visual appeal.

    The keyboard is equipped with integrated PVD ornamental light strips that illuminate in conjunction with the keyboard's backlighting. The Z87 Pro provides users with a selection of two switch options: Kailh Blueberry Ice Cream switches and Aniya switches. Both switches are linear in nature and are renowned for their seamless keypress and emphasis on rapidity. The keyboard offers many keycap profile choices, such as MDA and OEM profile, with high-quality PBT keycaps, guaranteeing a pleasant typing experience.

    The Z87 Pro features a Gasket structure that use silicone pads to separate the plate from the keyboard's base, reducing typing noise and providing a more pleasant keystroke sensation. This function is commonly seen on keyboards of higher quality and enhances the overall typing experience, giving it a more luxurious feel.

    Market Segmentation

    Aluminum Type Outlook

    • Secondary/Recycled Aluminum
    • Primary Aluminum

    Aluminum Product Outlook

    • Flat Rolled
    • Pigment & Powder
    • Forgings
    • Extrusions
    • Castings
    • Rod & Bar
    • Others

    Aluminum Regional Outlook

    Asia-Pacific
    • China
    • Japan
    • India
    • Australia
    • South Korea
    • Indonesia
    • Thailand
    • Vietnam
    • Malaysia
    • Singapore
    • Rest of Asia-Pacific

    Aluminum Application Outlook

    • Building & Construction
    • Consumer Goods
    • Electrical
    • Foil & Packaging
    • Hardware & Accessories
    • Machinery & Equipment
    • Solar Industry
    • Transportation
    • Utensils
    • Others

    Report Scope

    Report Attribute/Metric Details
    Market Size 2035 187.46 (Value (USD Billion))
    Compound Annual Growth Rate (CAGR) 7.80% (2025 - 2035)
    Base Year 2024
    Market Forecast Period 2025 - 2035
    Historical Data 2018- 2022
    Market Forecast Units Value (USD Billion)
    Report Coverage Revenue Forecast, Market Competitive Landscape, Growth Factors, and Trends
    Segments Covered Type, Product, Application, and Region
    Region Covered Asia Pacific
    Countries Covered China, Japan, India, Australia, South Korea, Indonesia, Thailand, Vietnam, Malaysia, Singapore, and Rest of Asia-Pacific
    Key Companies Profiled Alcoa Corporation (U.S.), Aluminum Bahrain (Bahrain), Century Aluminum Company (U.S.), Aluminum Corporation of China (China), Norsk Hydro ASA (Norway), Rio Tinto Alcan Inc. (Canada), China Hongqiao Group (China), Emirates Asia Pacific Aluminum PJSC (UAE), Hindalco Industries Limited (India), Rio Tinto Australia (Australia), BHP Billiton Aluminum Australia Pty Ltd. (Australia), RUSAL (Russia), and Vedanta Ltd. (India)
    Key Market Opportunities ·       Rising Aluminum Consumption in Evs ·       Growing Aluminum Demand from the Pharmaceutical and Food & Packaging Sectors
    Key Market Dynamics ·       Asia-Pacific's Building Industry is Booming ·       Growing Use of Aluminum in the Electronics Sector
    Market Size 2024 82.04 (Value (USD Billion))
    Market Size 2025 88.44 (Value (USD Billion))

    Market Highlights

    Author

    Anshula Mandaokar
    Team Lead - Research

    She holds an experience of about 6+ years in market research and business consulting, working under the spectrum of information communication technology, telecommunications and semiconductor domains. aarti conceptualizes and implements a scalable business strategy and provides strategic leadership to the clients. her expertise lies in market estimation, competitive intelligence, pipeline analysis, customer assessment, etc.

    Leave a Comment

    Latest Comments

    John Doe
    john@example.com

    This is a great article! Really helped me understand the topic better.

    Posted on July 23, 2025, 10:15 AM
    Jane Smith
    jane@domain.com

    Thanks for sharing this. I’ve bookmarked it for later reference.

    Posted on July 22, 2025, 7:45 PM

    FAQs

    How much is the aluminum market?

    The Asia Pacific Aluminum market size was valued at USD 70.5 Billion in 2022.

    What is the growth rate of the aluminum market?

    Aluminum Market is expected to grow with a CAGR of 5.2% in the period 2025-2035

    Who are the key players in the aluminum market?

    The key players in the market are Alcoa Corporation (U.S.), Aluminum Bahrain (Bahrain), Century Aluminum Company (U.S.), Aluminum Corporation of China (China), Norsk Hydro ASA (Norway), Rio Tinto Alcan Inc. (Canada), China Hongqiao Group (China), Emirates Asia Pacific Aluminum PJSC (UAE), Hindalco Industries Limited (India), Rio Tinto Australia (Australia), BHP Billiton Aluminum Australia Pty Ltd. (Australia), RUSAL (Russia), and Vedanta Ltd. (India).

    Which type led the aluminum market?

    The secondary/recycled aluminum category dominated the market in 2022.

    Which product had the largest market share in the aluminum market?

    The extrusions category had the largest share in the market.

    1. . EXECUTIVE SUMMARY
    2. . MARKET INTRODUCTION
    3. . Definition
    4. . Scope of the Study
    5. . Research Objective
    6. . Assumptions
    7. . Limitations
    8. . RESEARCH METHODOLOGY
    9. . Overview
    10. . Data Mining
    11. . Secondary Research
    12. . Primary Research
    13. . Primary Interviews and Information Gathering Process
    14. . Breakdown of Primary Respondents
    15. . Forecasting Modality
    16. . Market Size Estimation
    17. . Bottom-Up Approach
    18. . Top-Down Approach
    19. . Data Triangulation
    20. . Validation
    21. . MARKET DYNAMICS
    22. . Overview
    23. . Drivers
    24. . Restraints
    25. . Opportunities
    26. . MARKET FACTOR ANALYSIS
    27. . Value Chain Analysis
    28. . Porter’s Five Forces Analysis
    29. . Bargaining Power of Suppliers
    30. . Bargaining Power of Buyers
    31. . Threat of New Entrants
    32. . Threat of Substitutes
    33. . Intensity of Rivalry
    34. . COVID-19 Impact Analysis
    35. . Market Impact Analysis
    36. . Regional Impact
    37. . Opportunity and Threat Analysis
    38. . ASIA PACIFIC ALUMINUM MARKET, BY TYPE
    39. . Overview
    40. . Secondary/Recycled Aluminum
    41. . Primary Aluminum
    42. . ASIA PACIFIC ALUMINUM MARKET, BY PRODUCT
    43. . Overview
    44. . Flat Rolled
    45. . Pigment & Powder
    46. . Forgings
    47. . Extrusions
    48. . Castings
    49. . Rod & Bar
    50. . Others
    51. . ASIA PACIFIC ALUMINUM MARKET, BY APPLICATION
    52. . Overview
    53. . Building & Construction
    54. . Consumer Goods
    55. . Electrical
    56. . Foil & Packaging
    57. . Hardware & Accessories
    58. . Machinery & Equipment
    59. . Solar Industry
    60. . Transportation
    61. . Utensils
    62. . Others
    63. . ASIA PACIFIC ALUMINUM MARKET, BY REGION
    64. . Overview
    65. . Asia-Pacific - China - Japan - India - Australia - South Korea - Indonesia - Thailand - Vietnam - Malaysia - Singapore - Rest of Asia-Pacific
    66. . COMPETITIVE LANDSCAPE
    67. . Overview
    68. . Competitive Analysis
    69. . Market Share Analysis
    70. . Major Growth Strategy in the Asia Pacific Aluminum Market,
    71. . Competitive Benchmarking
    72. . Leading Players in Terms of Number of Developments in the Asia Pacific Aluminum Market,
    73. . Key developments and Growth Strategies
    74. . New Product Launch/Service Deployment
    75. . Merger & Acquisitions
    76. . Joint Ventures
    77. . Major Players Financial Matrix
    78. . Sales & Operating Income, 2022
    79. . Major Players R&D Expenditure. 2022
    80. . COMPANY PROFILES
    81. . Alcoa Corporation (U.S.)
    82. . Company Overview
    83. . Financial Overview
    84. . Products Offered
    85. . Key Developments
    86. . SWOT Analysis
    87. . Key Strategies
    88. . ALUMINUM BAHRAIN (BAHRAIN)
    89. . Company Overview
    90. . Financial Overview
    91. . Products Offered
    92. . Key Developments
    93. . SWOT Analysis
    94. . Key Strategies
    95. . CENTURY ALUMINUM COMPANY (U.S.)
    96. . Company Overview
    97. . Financial Overview
    98. . Products Offered
    99. . Key Developments
    100. . SWOT Analysis
    101. . Key Strategies
    102. . ALUMINUM CORPORATION OF CHINA (CHINA)
    103. . Company Overview
    104. . Financial Overview
    105. . Products Offered
    106. . Key Developments
    107. . SWOT Analysis
    108. . Key Strategies
    109. . NORSK HYDRO ASA (NORWAY)
    110. . Company Overview
    111. . Financial Overview
    112. . Products Offered
    113. . Key Developments
    114. . SWOT Analysis
    115. . Key Strategies
    116. . RIO TINTO ALCAN INC. (CANADA)
    117. . Company Overview
    118. . Financial Overview
    119. . Products Offered
    120. . Key Developments
    121. . SWOT Analysis
    122. . Key Strategies
    123. . China Hongqiao Group (China)
    124. . Company Overview
    125. . Financial Overview
    126. . Products Offered
    127. . Key Developments
    128. . SWOT Analysis
    129. . Key Strategies
    130. . EMIRATES ASIA PACIFIC ALUMINUM PJSC (UAE)
    131. . Company Overview
    132. . Financial Overview
    133. . Products Offered
    134. . Key Developments
    135. . SWOT Analysis
    136. . Key Strategies
    137. . HINDALCO INDUSTRIES LIMITED (INDIA)
    138. . Company Overview
    139. . Financial Overview
    140. . Products Offered
    141. . Key Developments
    142. . SWOT Analysis
    143. . Key Strategies
    144. . RIO TINTO AUSTRALIA (AUSTRALIA)
    145. . Company Overview
    146. . Financial Overview
    147. . Products Offered
    148. . Key Developments
    149. . SWOT Analysis
    150. . Key Strategies
    151. . BHP Billiton Aluminum Australia Pty Ltd. (Australia)
    152. . Company Overview
    153. . Financial Overview
    154. . Products Offered
    155. . Key Developments
    156. . SWOT Analysis
    157. . Key Strategies
    158. . RUSAL (Russia)
    159. . Company Overview
    160. . Financial Overview
    161. . Products Offered
    162. . Key Developments
    163. . SWOT Analysis
    164. . Key Strategies
    165. . Vedanta Ltd. (India)
    166. . Company Overview
    167. . Financial Overview
    168. . Products Offered
    169. . Key Developments
    170. . SWOT Analysis
    171. . Key Strategies
    172. . APPENDIX
    173. . References
    174. . Related Reports LIST OF TABLES TABLE 1 ASIA PACIFIC ALUMINUM MARKET, SYNOPSIS, 2018-2032 TABLE 2 ASIA PACIFIC ALUMINUM MARKET, ESTIMATES & FORECAST, 2018-2032 (USD BILLION) TABLE 3 ASIA PACIFIC ALUMINUM MARKET, BY TYPE, 2018-2032 (USD BILLION) TABLE 4 ASIA PACIFIC ALUMINUM MARKET, BY PRODUCT , 2018-2032 (USD BILLION) TABLE 5 ASIA PACIFIC ALUMINUM MARKET, BY APPLICATION, 2018-2032 (USD BILLION) TABLE 6 CHINA ALUMINUM MARKET, BY TYPE, 2018-2032 (USD BILLION) TABLE 7 CHINA ALUMINUM MARKET, BY PRODUCT , 2018-2032 (USD BILLION) TABLE 8 CHINA ALUMINUM MARKET, BY APPLICATION, 2018-2032 (USD BILLION) TABLE 9 JAPAN ALUMINUM MARKET, BY TYPE, 2018-2032 (USD BILLION) TABLE 10 JAPAN ALUMINUM MARKET, BY PRODUCT , 2018-2032 (USD BILLION) TABLE 11 JAPAN ALUMINUM MARKET, BY APPLICATION, 2018-2032 (USD BILLION) TABLE 12 INDIA ALUMINUM MARKET, BY TYPE, 2018-2032 (USD BILLION) TABLE 13 INDIA ALUMINUM MARKET, BY PRODUCT , 2018-2032 (USD BILLION) TABLE 14 INDIA ALUMINUM MARKET, BY APPLICATION, 2018-2032 (USD BILLION) TABLE 15 AUSTRALIA ALUMINUM MARKET, BY TYPE, 2018-2032 (USD BILLION) TABLE 16 AUSTRALIA ALUMINUM MARKET, BY PRODUCT , 2018-2032 (USD BILLION) TABLE 17 AUSTRALIA ALUMINUM MARKET, BY APPLICATION, 2018-2032 (USD BILLION) TABLE 18 SOUTH KOREA ALUMINUM MARKET, BY TYPE, 2018-2032 (USD BILLION) TABLE 19 SOUTH KOREA ALUMINUM MARKET, BY PRODUCT , 2018-2032 (USD BILLION) TABLE 20 SOUTH KOREA ALUMINUM MARKET, BY APPLICATION, 2018-2032 (USD BILLION) TABLE 21 INDONESIA ALUMINUM MARKET, BY TYPE, 2018-2032 (USD BILLION) TABLE 22 INDONESIA ALUMINUM MARKET, BY PRODUCT , 2018-2032 (USD BILLION) TABLE 23 INDONESIA ALUMINUM MARKET, BY APPLICATION, 2018-2032 (USD BILLION) TABLE 24 THAILAND ALUMINUM MARKET, BY TYPE, 2018-2032 (USD BILLION) TABLE 25 THAILAND ALUMINUM MARKET, BY PRODUCT , 2018-2032 (USD BILLION) TABLE 26 THAILAND ALUMINUM MARKET, BY APPLICATION, 2018-2032 (USD BILLION) TABLE 27 VIETNAM ALUMINUM MARKET, BY TYPE, 2018-2032 (USD BILLION) TABLE 28 VIETNAM ALUMINUM MARKET, BY PRODUCT , 2018-2032 (USD BILLION) TABLE 29 VIETNAM ALUMINUM MARKET, BY APPLICATION, 2018-2032 (USD BILLION) TABLE 30 MALAYSIA ALUMINUM MARKET, BY TYPE, 2018-2032 (USD BILLION) TABLE 31 MALAYSIA ALUMINUM MARKET, BY PRODUCT , 2018-2032 (USD BILLION) TABLE 32 MALAYSIA ALUMINUM MARKET, BY APPLICATION, 2018-2032 (USD BILLION) TABLE 33 SINGAPORE ALUMINUM MARKET, BY TYPE, 2018-2032 (USD BILLION) TABLE 34 SINGAPORE ALUMINUM MARKET, BY PRODUCT , 2018-2032 (USD BILLION) TABLE 35 SINGAPORE ALUMINUM MARKET, BY APPLICATION, 2018-2032 (USD BILLION) TABLE 36 REST OF ASIA PACIFIC ALUMINUM MARKET, BY TYPE, 2018-2032 (USD BILLION) TABLE 37 REST OF ASIA PACIFIC ALUMINUM MARKET, BY PRODUCT , 2018-2032 (USD BILLION) TABLE 38 REST OF ASIA PACIFIC ALUMINUM MARKET, BY APPLICATION, 2018-2032 (USD BILLION) LIST OF FIGURES FIGURE 1 RESEARCH PROCESS FIGURE 2 MARKET STRUCTURE FOR THE ASIA PACIFIC ALUMINUM MARKET FIGURE 3 MARKET DYNAMICS FOR THE ASIA PACIFIC ALUMINUM MARKET FIGURE 4 ASIA PACIFIC ALUMINUM MARKET, SHARE (%), BY TYPE, 2022 FIGURE 5 ASIA PACIFIC ALUMINUM MARKET, SHARE (%), BY PRODUCT , 2022 FIGURE 6 ASIA PACIFIC ALUMINUM MARKET, SHARE (%), BY APPLICATION, 2022 FIGURE 7 ASIA PACIFIC ALUMINUM MARKET, SHARE (%), BY REGION, 2022 FIGURE 8 ASIA PACIFIC ALUMINUM MARKET: COMPANY SHARE ANALYSIS, 2022 (%) FIGURE 9 ALCOA CORPORATION (U.S.): FINANCIAL OVERVIEW SNAPSHOT FIGURE 10 ALCOA CORPORATION (U.S.): SWOT ANALYSIS FIGURE 11 ALUMINUM BAHRAIN (BAHRAIN): FINANCIAL OVERVIEW SNAPSHOT FIGURE 12 ALUMINUM BAHRAIN (BAHRAIN): SWOT ANALYSIS FIGURE 13 CENTURY ALUMINUM COMPANY (U.S.): FINANCIAL OVERVIEW SNAPSHOT FIGURE 14 CENTURY ALUMINUM COMPANY (U.S.): SWOT ANALYSIS FIGURE 15 ALUMINUM CORPORATION OF CHINA (CHINA): FINANCIAL OVERVIEW SNAPSHOT FIGURE 16 ALUMINUM CORPORATION OF CHINA (CHINA): SWOT ANALYSIS FIGURE 17 NORSK HYDRO ASA (NORWAY): FINANCIAL OVERVIEW SNAPSHOT FIGURE 18 NORSK HYDRO ASA (NORWAY): SWOT ANALYSIS FIGURE 19 RIO TINTO ALCAN INC. (CANADA): FINANCIAL OVERVIEW SNAPSHOT FIGURE 20 RIO TINTO ALCAN INC. (CANADA): SWOT ANALYSIS FIGURE 21 CHINA HONGQIAO GROUP (CHINA): FINANCIAL OVERVIEW SNAPSHOT FIGURE 22 CHINA HONGQIAO GROUP (CHINA): SWOT ANALYSIS FIGURE 23 EMIRATES ASIA PACIFIC ALUMINUM PJSC (UAE): FINANCIAL OVERVIEW SNAPSHOT FIGURE 24 EMIRATES ASIA PACIFIC ALUMINUM PJSC (UAE): SWOT ANALYSIS FIGURE 25 HINDALCO INDUSTRIES LIMITED (INDIA): FINANCIAL OVERVIEW SNAPSHOT FIGURE 26 HINDALCO INDUSTRIES LIMITED (INDIA): SWOT ANALYSIS FIGURE 27 RIO TINTO AUSTRALIA (AUSTRALIA): FINANCIAL OVERVIEW SNAPSHOT FIGURE 28 RIO TINTO AUSTRALIA (AUSTRALIA): SWOT ANALYSIS FIGURE 29 BHP BILLITON ALUMINUM AUSTRALIA PTY LTD. (AUSTRALIA): FINANCIAL OVERVIEW SNAPSHOT FIGURE 30 BHP BILLITON ALUMINUM AUSTRALIA PTY LTD. (AUSTRALIA): SWOT ANALYSIS FIGURE 31 RUSAL (RUSSIA): FINANCIAL OVERVIEW SNAPSHOT FIGURE 32 RUSAL (RUSSIA): SWOT ANALYSIS FIGURE 33 VEDANTA LTD. (INDIA): FINANCIAL OVERVIEW SNAPSHOT FIGURE 34 VEDANTA LTD. (INDIA): SWOT ANALYSIS
    175. List of Tables and Figures
      1. Table FIGURE 1 RESEARCH PROCESS FIGURE 2 MARKET STRUCTURE FOR THE ASIA PACIFIC ALUMINUM MARKET FIGURE 3 MARKET DYNAMICS FOR THE ASIA PACIFIC ALUMINUM MARKET FIGURE 4 ASIA PACIFIC ALUMINUM MARKET, SHARE (%), BY TYPE, 2022 FIGURE 5 ASIA PACIFIC ALUMINUM MARKET, SHARE (%), BY PRODUCT , 2022 FIGURE 6 ASIA PACIFIC ALUMINUM MARKET, SHARE (%), BY APPLICATION, 2022 FIGURE 7 ASIA PACIFIC ALUMINUM MARKET, SHARE (%), BY REGION, 2022 FIGURE 8 ASIA PACIFIC ALUMINUM MARKET: COMPANY SHARE ANALYSIS, 2022 (%) FIGURE 9 ALCOA CORPORATION (U.S.): FINANCIAL OVERVIEW SNAPSHOT FIGURE 10 ALCOA CORPORATION (U.S.): SWOT ANALYSIS FIGURE 11 ALUMINUM BAHRAIN (BAHRAIN): FINANCIAL OVERVIEW SNAPSHOT FIGURE 12 ALUMINUM BAHRAIN (BAHRAIN): SWOT ANALYSIS FIGURE 13 CENTURY ALUMINUM COMPANY (U.S.): FINANCIAL OVERVIEW SNAPSHOT FIGURE 14 CENTURY ALUMINUM COMPANY (U.S.): SWOT ANALYSIS FIGURE 15 ALUMINUM CORPORATION OF CHINA (CHINA): FINANCIAL OVERVIEW SNAPSHOT FIGURE 16 ALUMINUM CORPORATION OF CHINA (CHINA): SWOT ANALYSIS FIGURE 17 NORSK HYDRO ASA (NORWAY): FINANCIAL OVERVIEW SNAPSHOT FIGURE 18 NORSK HYDRO ASA (NORWAY): SWOT ANALYSIS FIGURE 19 RIO TINTO ALCAN INC. (CANADA): FINANCIAL OVERVIEW SNAPSHOT FIGURE 20 RIO TINTO ALCAN INC. (CANADA): SWOT ANALYSIS FIGURE 21 CHINA HONGQIAO GROUP (CHINA): FINANCIAL OVERVIEW SNAPSHOT FIGURE 22 CHINA HONGQIAO GROUP (CHINA): SWOT ANALYSIS FIGURE 23 EMIRATES ASIA PACIFIC ALUMINUM PJSC (UAE): FINANCIAL OVERVIEW SNAPSHOT FIGURE 24 EMIRATES ASIA PACIFIC ALUMINUM PJSC (UAE): SWOT ANALYSIS FIGURE 25 HINDALCO INDUSTRIES LIMITED (INDIA): FINANCIAL OVERVIEW SNAPSHOT FIGURE 26 HINDALCO INDUSTRIES LIMITED (INDIA): SWOT ANALYSIS FIGURE 27 RIO TINTO AUSTRALIA (AUSTRALIA): FINANCIAL OVERVIEW SNAPSHOT FIGURE 28 RIO TINTO AUSTRALIA (AUSTRALIA): SWOT ANALYSIS FIGURE 29 BHP BILLITON ALUMINUM AUSTRALIA PTY LTD. (AUSTRALIA): FINANCIAL OVERVIEW SNAPSHOT FIGURE 30 BHP BILLITON ALUMINUM AUSTRALIA PTY LTD. (AUSTRALIA): SWOT ANALYSIS FIGURE 31 RUSAL (RUSSIA): FINANCIAL OVERVIEW SNAPSHOT FIGURE 32 RUSAL (RUSSIA): SWOT ANALYSIS FIGURE 33 VEDANTA LTD. (INDIA): FINANCIAL OVERVIEW SNAPSHOT FIGURE 34 VEDANTA LTD. (INDIA): SWOT ANALYSIS
    176. Table FIGURE 1 RESEARCH PROCESS FIGURE 2 MARKET STRUCTURE FOR THE ASIA PACIFIC ALUMINUM MARKET FIGURE 3 MARKET DYNAMICS FOR THE ASIA PACIFIC ALUMINUM MARKET FIGURE 4 ASIA PACIFIC ALUMINUM MARKET, SHARE (%), BY TYPE, 2022 FIGURE 5 ASIA PACIFIC ALUMINUM MARKET, SHARE (%), BY PRODUCT , 2022 FIGURE 6 ASIA PACIFIC ALUMINUM MARKET, SHARE (%), BY APPLICATION, 2022 FIGURE 7 ASIA PACIFIC ALUMINUM MARKET, SHARE (%), BY REGION, 2022 FIGURE 8 ASIA PACIFIC ALUMINUM MARKET: COMPANY SHARE ANALYSIS, 2022 (%) FIGURE 9 ALCOA CORPORATION (U.S.): FINANCIAL OVERVIEW SNAPSHOT FIGURE 10 ALCOA CORPORATION (U.S.): SWOT ANALYSIS FIGURE 11 ALUMINUM BAHRAIN (BAHRAIN): FINANCIAL OVERVIEW SNAPSHOT FIGURE 12 ALUMINUM BAHRAIN (BAHRAIN): SWOT ANALYSIS FIGURE 13 CENTURY ALUMINUM COMPANY (U.S.): FINANCIAL OVERVIEW SNAPSHOT FIGURE 14 CENTURY ALUMINUM COMPANY (U.S.): SWOT ANALYSIS FIGURE 15 ALUMINUM CORPORATION OF CHINA (CHINA): FINANCIAL OVERVIEW SNAPSHOT FIGURE 16 ALUMINUM CORPORATION OF CHINA (CHINA): SWOT ANALYSIS FIGURE 17 NORSK HYDRO ASA (NORWAY): FINANCIAL OVERVIEW SNAPSHOT FIGURE 18 NORSK HYDRO ASA (NORWAY): SWOT ANALYSIS FIGURE 19 RIO TINTO ALCAN INC. (CANADA): FINANCIAL OVERVIEW SNAPSHOT FIGURE 20 RIO TINTO ALCAN INC. (CANADA): SWOT ANALYSIS FIGURE 21 CHINA HONGQIAO GROUP (CHINA): FINANCIAL OVERVIEW SNAPSHOT FIGURE 22 CHINA HONGQIAO GROUP (CHINA): SWOT ANALYSIS FIGURE 23 EMIRATES ASIA PACIFIC ALUMINUM PJSC (UAE): FINANCIAL OVERVIEW SNAPSHOT FIGURE 24 EMIRATES ASIA PACIFIC ALUMINUM PJSC (UAE): SWOT ANALYSIS FIGURE 25 HINDALCO INDUSTRIES LIMITED (INDIA): FINANCIAL OVERVIEW SNAPSHOT FIGURE 26 HINDALCO INDUSTRIES LIMITED (INDIA): SWOT ANALYSIS FIGURE 27 RIO TINTO AUSTRALIA (AUSTRALIA): FINANCIAL OVERVIEW SNAPSHOT FIGURE 28 RIO TINTO AUSTRALIA (AUSTRALIA): SWOT ANALYSIS FIGURE 29 BHP BILLITON ALUMINUM AUSTRALIA PTY LTD. (AUSTRALIA): FINANCIAL OVERVIEW SNAPSHOT FIGURE 30 BHP BILLITON ALUMINUM AUSTRALIA PTY LTD. (AUSTRALIA): SWOT ANALYSIS FIGURE 31 RUSAL (RUSSIA): FINANCIAL OVERVIEW SNAPSHOT FIGURE 32 RUSAL (RUSSIA): SWOT ANALYSIS FIGURE 33 VEDANTA LTD. (INDIA): FINANCIAL OVERVIEW SNAPSHOT FIGURE 34 VEDANTA LTD. (INDIA): SWOT ANALYSIS

    Asia Pacific Aluminum Market Segmentation

    Market Segmentation Overview

    • Detailed segmentation data will be available in the full report
    • Comprehensive analysis by multiple parameters
    • Regional and country-level breakdowns
    • Market size forecasts by segment
    Infographic

    Free Sample Request

    Kindly complete the form below to receive a free sample of this Report

    Get Free Sample

    Customer Strories

    “I am very pleased with how market segments have been defined in a relevant way for my purposes (such as "Portable Freezers & refrigerators" and "last-mile"). In general the report is well structured. Thanks very much for your efforts.”

    Victoria Milne

    Founder
    Case Study
    Chemicals and Materials